Mobile Engagement Automation Market Size, Trends and Insights By Component (Software, Services, Professional Services, Managed Services), By Deployment Mode (Cloud-based, On-premise), By Organization Size (Small and Medium Enterprises (SMEs), Large Enterprises), By Application (Push Notifications, In-App Messaging, Email Marketing, SMS Marketing, Mobile Wallet Marketing, Other Applications), By End-User Industry (Retail and E-commerce, Banking and Financial Services, Healthcare, Media and Entertainment, Travel and Hospitality, Gaming, Other Industries), and By Region - Global Industry Overview, Statistical Data, Competitive Analysis, Share, Outlook, and Forecast 2026 – 2035
Report Snapshot
CAGR: 9.8%
| Study Period: | 2026-2035 |
| Fastest Growing Market: | Asia Pacific |
| Largest Market: | North America |
Major Players
- Braze Inc.
- CleverTap
- MoEngage
- Leanplum (CleverTap)
- Others
Reports Description
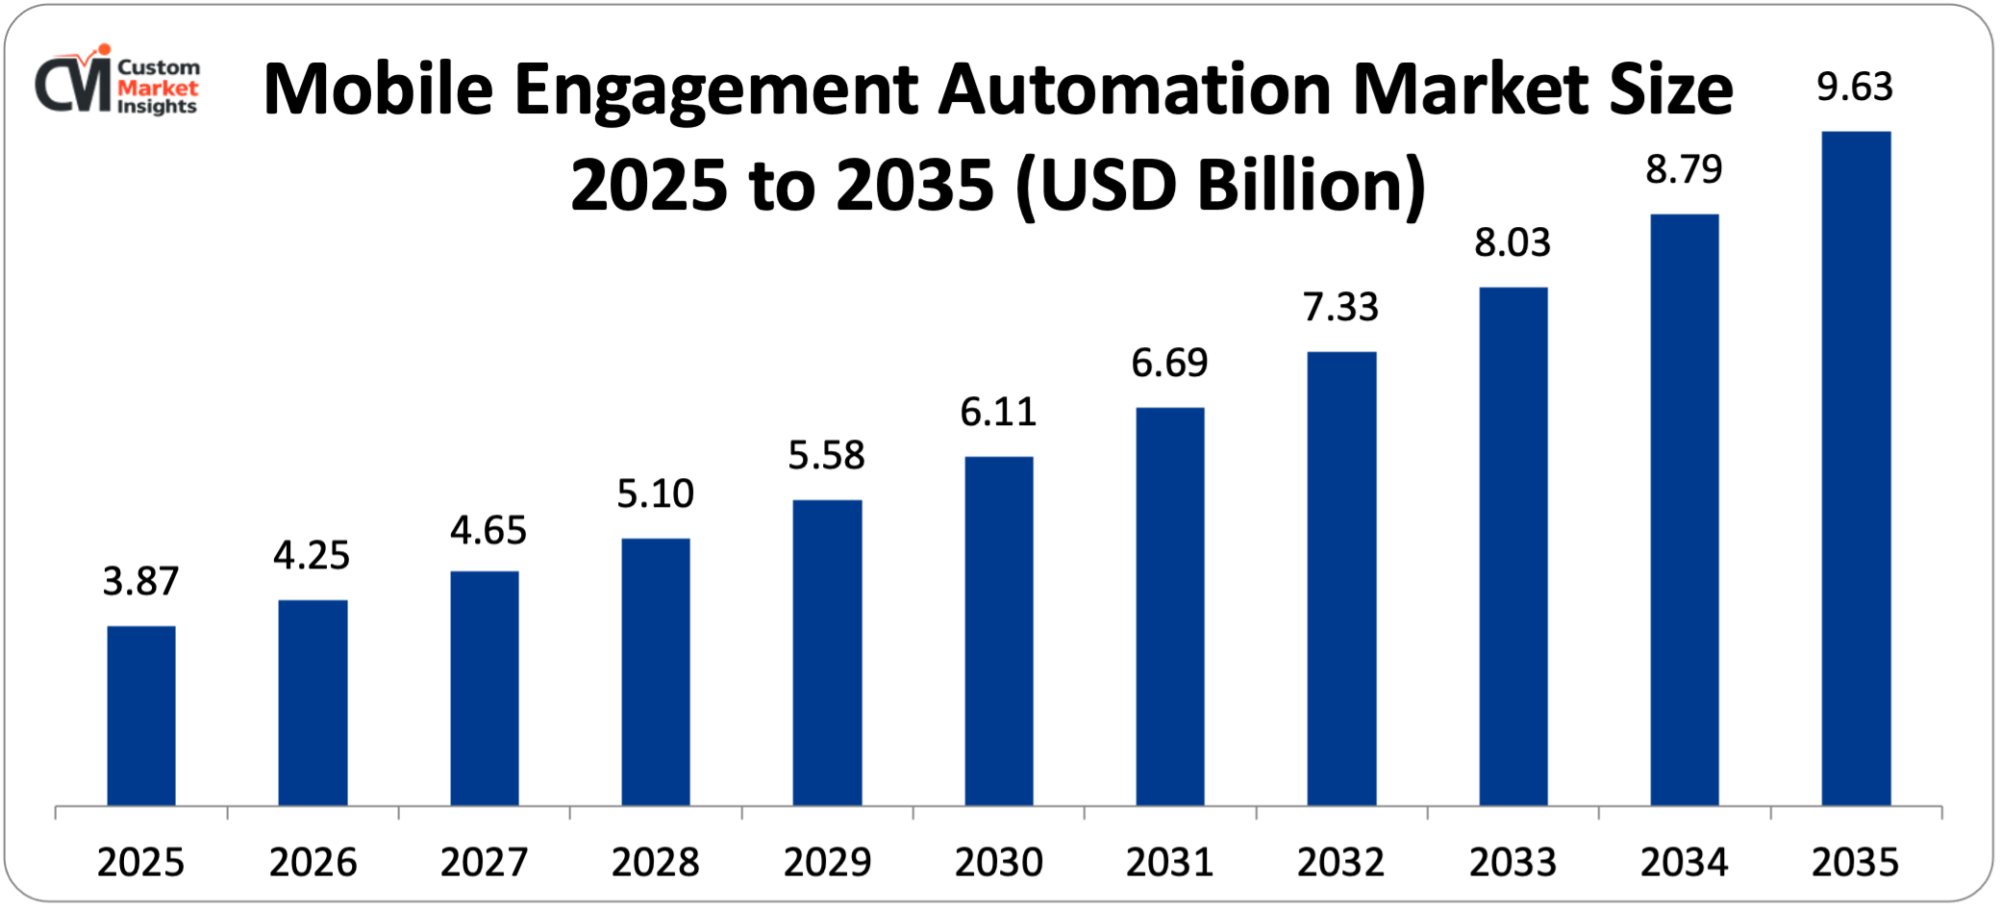
The mobile engagement automation market worldwide is estimated to be USD 3.87 billion in 2025 and is estimated to go up to USD 4.25 billion in 2026 to another USD 9.63 billion by 2035 with a CAGR of 9.8% between 2026 and 2035. The market is growing due to the growing smartphone penetration across the world, the growing activities of mobile commerce, the increasing need to provide personal customer experiences, the development of artificial intelligence and machine learning technologies, and the adoption of omnichannel marketing practices.
Market Highlight
- North America dominated the mobile engagement automation market, 38% market share in 2025.
- Otherwise, it is predicted that Asia Pacific will grow at the highest CAGR of 12.4% over the period 2026-2035.
- By component, the software segment is projected to take approximately 67% of the market share in 2025.
- Based on the deployment mode, the cloud-based segment exhibits the highest CAGR of 10.6% between 2026 and 2035.
- By end-user industry, the retail and e-commerce industry segment will lead the market share of 31% in 2025 with banking and financial services industry segment projected to grow at a CAGR of 11.2% throughout the projected period of 2026 to 2035.
- By the size of the organization, large enterprises took the market share of 58% in 2025.
- Educational engagement Automation systems on mobile devices sent more than 2.3 trillion push messages worldwide in 2024.
Significant Growth Factors
The Mobile Engagement Automation Market Trends present significant growth opportunities due to several factors:
- Explosive Growth in Mobile Commerce and App-Based Economy: The primary force behind the mobile engagement automation market is the blistering development of mobile commerce and applications-based business models, as more and more businesses come to count on mobile apps to power customer engagement, customer retention, and customer revenue development. It is a huge shift in the consumer buying behavior virtual, given that by 2027, mobile commerce will comprise 62% of all the e-commerce purchases in the world, with an expected USD 5.4 trillion in sales, according to the data presented in a global e-commerce analysis in 2025. The number of smartphone users in the whole world stands at an approximate of 6.8 billion users as of 2024 and it is estimated to increase up to 7.7 billion users by 2028 and this presents a huge market to be addressed by smartphone engagement strategies. The mean individual is spending 4.8 hours per day on mobile platforms, 88% of which is spent in mobile applications and not mobile web-based browsers, which highlights the extreme significance of in-app engagement to a business. Mobile engagement automation services allow organizations to organize complex communication plans on a variety of platforms such as push notifications, in-app messages, SMS, email, and changes in the mobile wallet, and such initiatives help companies create unified customer experiences that can result in conversions and loyalty. They use real-time behavioral data to send contextually relevant messages prompted by user actions, preferences, location, and history of engagement up to 3-5 times the rate of engagement of traditional marketing channels. Research on the industry shows that businesses that adopt mobile engagement automation grow their average revenues by 25-30% in the first year of adoption. Retail and e-commerce is the fastest-growing market share with 31% in 2025 and is because of the intensity of competition to get attention and focus on customers and the desire to maximize lifetime value in already crowded online market places. Large brands such as Amazon, Walmart, Nike, and Starbucks have shown how advanced mobile engagement strategies can attract billions of dollars in incremental revenue, and Starbucks had over 25% of total transactions being done through mobile ordering, which is enabled by personalized mobile engagement campaign. Modern mobile engagement platforms also connect to customer data platforms, analytics systems and marketing clouds, producing cohesive views of customer behavior in touchpoints and allowing accurate segmentation and targeting capabilities that could not have been attempted using the traditional marketing technologies.
- AI-Powered Personalization and Predictive Analytics Revolution: The market growth has increased significantly thanks to artificial intelligence and machine learning technologies that have made it possible to use the technologies to perform unprecedented personalizations, predictive engagement, and automated optimization of the mobile marketing campaign. The market of AI in marketing is estimated to amount to USD 107.5 billion in 2028, with an annual growth of 29.8% CAGR, with mobile engagement being one of the key areas of application of the technologies. The new mobile engagement platforms are now able to perform AI functions such as predictive churn models of users who are at risk of abandonment, next-best-action engines of what are the most appropriate messages and timing to send to an individual user, automated A/B testing systems offering continuous optimization of message content and delivery parameters, and natural language processing to enable conversational interfaces and intelligent chat-bots. The industry analysis also indicates that with the use of AI-powered, mobile engagement, conversions of up to 20-40% of companies will be achieved over a rule-based algorithm, and message fatigue and unsubscribe rates will decrease by 15-25% due to more timely, relevant messages. Millions of data points such as behavioral models, transaction history, physical device features, time zones and other contextual cues are analyzed using machine learning algorithms and used to identify the most effective engagement strategies with each user group. Real-time decisioning engines are able to examine incoming events and user actions in milliseconds and invoke a response that is immediate and context-sensitive as opposed to being batched and generic. According to the report by progressive retailers, the rates of AI-based product recommendation messages sent via push notifications reach between 8-12% in terms of click-through, as opposed to 2-3% in generic promotional messages, which proves the enormous influence of intelligent personalization. Banking and financial services industry is on a fast track adoption with the CAGR of 11.2% is expected to reach 2035 due to the AI capabilities of fraud notification, customized financial guidance, and customer-focused services that will improve security and user experience. The most recent platforms also use sentiment analysis measuring customer feedback and reviews to determine dissatisfaction areas, customer journey mapping to track common routes to conversion and pinpoint areas of friction, and the use of lookalike models to find new groups of customers that are similar to the already high-value customers to be acquired in targeted campaigns.
What are the Major Advances Changing the Mobile Engagement Automation Market Today
- Omnichannel Orchestration and Journey Automation: While mobile engagement has yet to be established as an essential component or strategy within the marketing mix, it is important to recognize the most significant change that could occur in this area, which is the coordination of customer experience across mobile applications, web platforms, email, SMS, social media, and physical interaction points. The current omnichannel mobile engagement systems have cross-channel journey builders that enable marketers to create complex multi-channel campaigns that are executed across multiple channels, consolidated customer profiles that bring the data collected through all channels to the single views, channel preference learning that automatically defines the preferred channels of communication by each user, and attribution modeling that tracks the contribution of each touchpoint to conversions. Based on studies conducted by marketing technology analysts, firms that have an effective omnichannel customer engagement strategies retain customers in 89% of cases versus 33% firms that have poor omnichannel customer engagement strategies, indicating strong business influence. These sophisticated systems can support more advanced applications such as abandoned cart recovery, which starts with in-app messages, which is followed by push notifications, then email, and finally SMS depending on how responsive the customer is, or the campaign activated when they visit a physical store, and in-app messages when they enter, and an email follow-up after they leave. The cloud-based deployment segment is growing at the quickest rate of 10.6% CAGR because of scalability and integration features that cloud platforms bring to orchestrating the omnichannel. Industries are undergoing digital transformation, and autonomy of mobile engagement is taking place with most enterprises proposing to invest more in automating mobile engagement in 2025, as CMO surveys have shown. The contemporary platforms include real-time event processing that supports millions of customer interactions at any given time, customized content assembly that tailors the elements of the messages to the attributes of the user and compliance management to make sure that the communications comply with GDPR, CCPA and other privacy-related regulations in the global markets.
- Advanced Analytics and Real-Time Performance Optimization: The emergence of advanced analytics solutions and real-time optimization engines responds to the increasing demand of a quantifiable ROI and constant enhancement of mobile engagement programs. Older forms of mobile marketing were based on simple metrics such as opens and clicks but newer engagement automation tools offer detailed analytics such as cohort analysis of groups of users over time to determine retention and lifetime value, funnel analytics showing which areas of a multi-step user journey were conversion bottlenecks, revenue attribution linking engagement activities to business real-world results, and predictive analytics of forecasting future behavior based on past patterns. Data in the industry frequently shows that companies that employ superior mobile usage analytics have 35 times higher returns on investment in marketing expenditures than those that employ rudimentary tracking, which justifies the benefit of complex platforms. Real time dash boards allow marketers to have real-time visibility into the performance of the campaigns, which can lead to quick adjustments and A/B test outcomes that drive faster learning processes. Automated optimization systems automatically test message timing and content, imagery, call-to-action text and channel choice variations and automatically allocate more traffic to successful variations. Platform providers argue these systems can generally boost key performance indicators by 15-30% in three months by experimenting and optimizing them. The personal computer software segment has the largest share 67% in 2025 due to the advanced features needed to handle the advanced analytics and optimization. The modern platforms are connected to the business intelligence systems, data warehouses, and customer data platforms, allowing the mobile engagement performance to be analyzed in the frames of overall business indicators. Predictive churn models are used to identify users who will leave an app or service, which can be retained proactively to prevent churn by 20-40% based on case studies. Predictions of customer lifetime value are used in setting engagement strategies by allocating resources to users who are most likely to be valuable and spending less on low-value groups.
- Hyper-Personalization Through Behavioral Intelligence: The ability to leverage tiny behavioral signals and contextual cues in the form of hyper-personalization is an order of magnitude better than the old-fashioned demographic (segmentation) strategies of the past. Current mobile engagement platforms monitor hundreds of behavioral indicators such as patterns of feature use, content use, session count and duration, navigation patterns, transaction history, and unfinished actions and aggregates these into detailed behavioral profiles. Consumer research indicates that 80% of consumers tend to purchase more products and services offered by the brands that offer a personalized experience, and 71% feel frustrated about the personalized shopping experiences which provides a strong business case on further personalizations. Behavioral intelligence engines detect high intent or receptiveness moments, including those users who have looked at particular product categories more than once, those who have read particular content matters, or demonstrated tendencies that relate to the buying process. Context-aware messaging includes real-time components such as current location, weather, time of the day, type of device, battery life, and network connection to make messages more relevant and deliver them at the most appropriate time. Behavioral personalization proves its might in the retail and e-commerce industry that holds the largest market share at 31% and the platforms allow applications such as dynamic price reductions based on price sensitives, cross-sell deals based on browsing, and re-engagement offers based on individual abandonment reasons. SMEs are swiftly implementing these capabilities as the SME market is projected to expand at a rate of 10.8% CAGR as inexpensive cloud-based services enable the democratization of access to the enterprise level of personalization technology. Contemporary platforms use zero-party data collection (preference centers and interactive experiences in which users actively choose to disclose interests and preferences) and first-party data (direct customer interactions and transactions) and anonymized third-party data (extensive insights into the market) synthesized by privacy-compliant data management systems.
Category Wise Insights
By Component
Why Software Dominates the Market?
In 2025, the largest segment is software which will cover about 67% of total market share. This preeminence demonstrates the essence of the value proposition of the mobile engagement automation stored in advanced software and platforms that can coordinate and multi-channel behavioral analytics, personalization engines, and campaign management features. Industry surveys show that 92% of marketing executives believe mobile engagement software is a key component of digital transformation efforts, with 3-5 integrated marketing technology platforms becoming the average usage of enterprises. The mobile engagement automation software is built on several modules such as campaign creation and management tool, audience segmentation engines, real-time decisioning systems, analytics and reporting dashboards, integration frameworks which integrate with the other marketing and business systems. These systems work with large volumes of data, with the latest solutions processing billions of events per day and having profiles of hundreds of millions of users in the customer base of the whole world.
The services segment, although with the smallest market share of 33%, is also gaining momentum with a CAGR of 9.2% because organizations need implementation support, strategy consulting, message-designing creative services, and managed services to constantly optimize their campaigns. Professional services assist businesses in identifying strategies of mobile engagement that support business objectives, install and set up platforms that address unique requirements, and train marketing teams on how to use platforms effectively. The managed services allow organizations to subcontract the routine campaign activities to expert agencies, especially applicable to those that do not have the expertise of mobile marketing in house.
By Deployment Mode
Why Cloud-Based Solutions Are Growing Fastest?
Cloud-based deployment is the most dynamic segment with the revenue growth rate of 10.6% between 2026 and 2035 because of better scalability, reduced overall cost of ownership, reduced implementation schedules, and constant feature upgrades that cloud platforms offer. Solutions that are considered to be cloud based mobile engagement automaton solutions include elastic infrastructure that automatically scales to accommodate traffic bursts during promotion periods, global content delivery networks that can deliver messages quickly globally, automatic software updates that can provide the latest features, and pricing models that can be updated to match business expansion. Cloud computing studies indicate that organizations making use of cloud-based marketing services cut IT infrastructure expenses by 30-50% over on-premise choices and also, cut phenomena time-to-market by 60% on new campaigns and features.
On-premise deployments, even though their rate of growth is slow, are relevant to organizations whose data security and compliance needs are stringent, especially in the regulated sectors such as banking and healthcare. On-premise services allow direct control of data storage and processing, customisation that can be used to meet specific business needs and integration with existing legacy systems that might not be easily accessible on a cloud. On-premise deployments are more common in financial services institutions and government organizations in need of full data sovereignty and to meet regulatory demands. Nevertheless, hybrid deployment models of on-premise customer data management with cloud-based campaign execution are becoming more popular with a compromise between control and scalability.
By Organization Size
Why Large Enterprises Lead Adoption?
The biggest segment is the retail and e-commerce applications which take about 31% of the total market share by 2025. Such leadership is a product of the core position of mobile apps in the contemporary retailing strategies, where mobile channels determine 62% of e-commerce sales and provide the major shopping interface to younger shoppers. Retail Stationary mobile engagement can be critically applied in the case of personalized product recommendations that can increase average order values by 20-30%, abandoned cart recovery campaigns that can convert 10-15% of abandonment into a final purchase, inventory availability notifications that create a sense of urgency about limited-stock items, loyalty program communications, and rewarding repeat purchases and engagement. Mobile commerce market has become USD 3.4 trillion in 2024 and projected to be USD 5.4 trillion by 2027, which generates colossal addressable opportunity in automation of engagement platforms.
By End-User Industry
Why Retail and E-commerce Dominate Mobile Engagement?
Retail mobile engagement strategies are based on advanced behavioral segmentation of high-value customers, regular browsers, discount-seekers, and lapsed customers who need other messaging strategies. Personalized machines are dynamic engines that modify content in the apps, search results, and messages in real time based on tastes and history of browsing. Location based marketing elicits messages as customers move towards stores and combines online shopping and offline shopping. Research in the retail industry has shown that mobile-first retailers with complex engagement automation experience 40 years higher customer lifetime values than retailers whose mobile strategies are simple, with highly competitive advantages being realized through more complex execution.
The banking and financial services offer the highest growth rate at the 11.2% CAGR between 2026 and 2035 due to the digital banking transformation initiatives that have seen mobile apps as the main point of customer service. Financial institutions are using mobile engagement automation to send account alerts and transaction notification that offers real time updates, fraud detection messages that need real-time customer verification, personalized financial recommendations based on spending patterns and financial objectives and product cross-sell campaigns to offer loans, credit cards and investment products to the right customers. Such regulatory compliance requirements as consumer financial protection regulations and data privacy laws are pushing the use of advanced platforms with inbuilt compliance management features. Engagement rates in modern banking apps are 5-7x higher in time-sensitive messages such as fraud alerts compared to email, which can be used as a clear indication that mobile is effective in communicating with customers on critical matters.
By Application
Why Push Notifications Remain Primary Engagement Channel?
The most popular application in mobile engagement automation is Push notifications which are used by 89% of mobile applications based on industry surveys. Push notifications also provide unmatched immediacy where the message is displayed directly on lock screens and notification centers, high visibility so that the user is guaranteed to see the message even in absence of opening apps, and exhibit action-oriented design that allows a one-tap response to calls-to-action. Based on the engagement metrics of different industries, push notifications have an average open-rate of 7-10, significantly higher than the open-rate of 20-25 of email, but with lower overall reach because users have to opt-in to get push notifications. Advanced push strategies also use rich media such as images, videos, and GIFs that generate more engagement, action buttons that allow users to respond in multiple options without opening applications, and deep links that send users to particular screens in the apps instead of general home pages.
In-app messaging is an additional channel where users want to receive messages when they are already in an app but not as an external message and it has a higher engagement rate of 20-40% because it is more relevant especially when the users are already in the app. In-app messages accept a wide range of formats such as banners, modals, carousels, and full-screen takeovers, which allow an interactive experience to advertise features, collect feedback, or elicit a particular behavior. Multi-touch campaigns Push and in-app messaging are organized using modern platforms with push notifications used to initiate app openings and in-app messages to complete the conversion journeys.
Email marketing will continue to be vital where more content is involved, more information about a product, newsletters, and communications with those users who have not enabled push notifications. Time-sensitive messages such as delivery notifications, appointment reminders, and verification codes get 98% response with SMS marketing, which usually occur 3 minutes after being received. Mobile wallet marketing helps maintain the constant presence with passes and cards stored in device wallets, which is perfect in the case of loyalty cards, event tickets, and time-sensitive deals.
Report Scope
| Feature of the Report | Details |
| Market Size in 2026 | USD 4.25 billion |
| Projected Market Size in 2035 | USD 9.63 billion |
| Market Size in 2025 | USD 3.87 billion |
| CAGR Growth Rate | 9.8% CAGR |
| Base Year | 2025 |
| Forecast Period | 2026-2035 |
| Key Segment | By Component, Deployment Mode, Organization Size, Application, End-User Industry and Region |
| Report Coverage | Revenue Estimation and Forecast, Company Profile, Competitive Landscape, Growth Factors and Recent Trends |
| Regional Scope | North America, Europe, Asia Pacific, Middle East & Africa, and South & Central America |
| Buying Options | Request tailored purchasing options to fulfil your requirements for research. |
Regional Analysis
How Big is the North America Market Size?
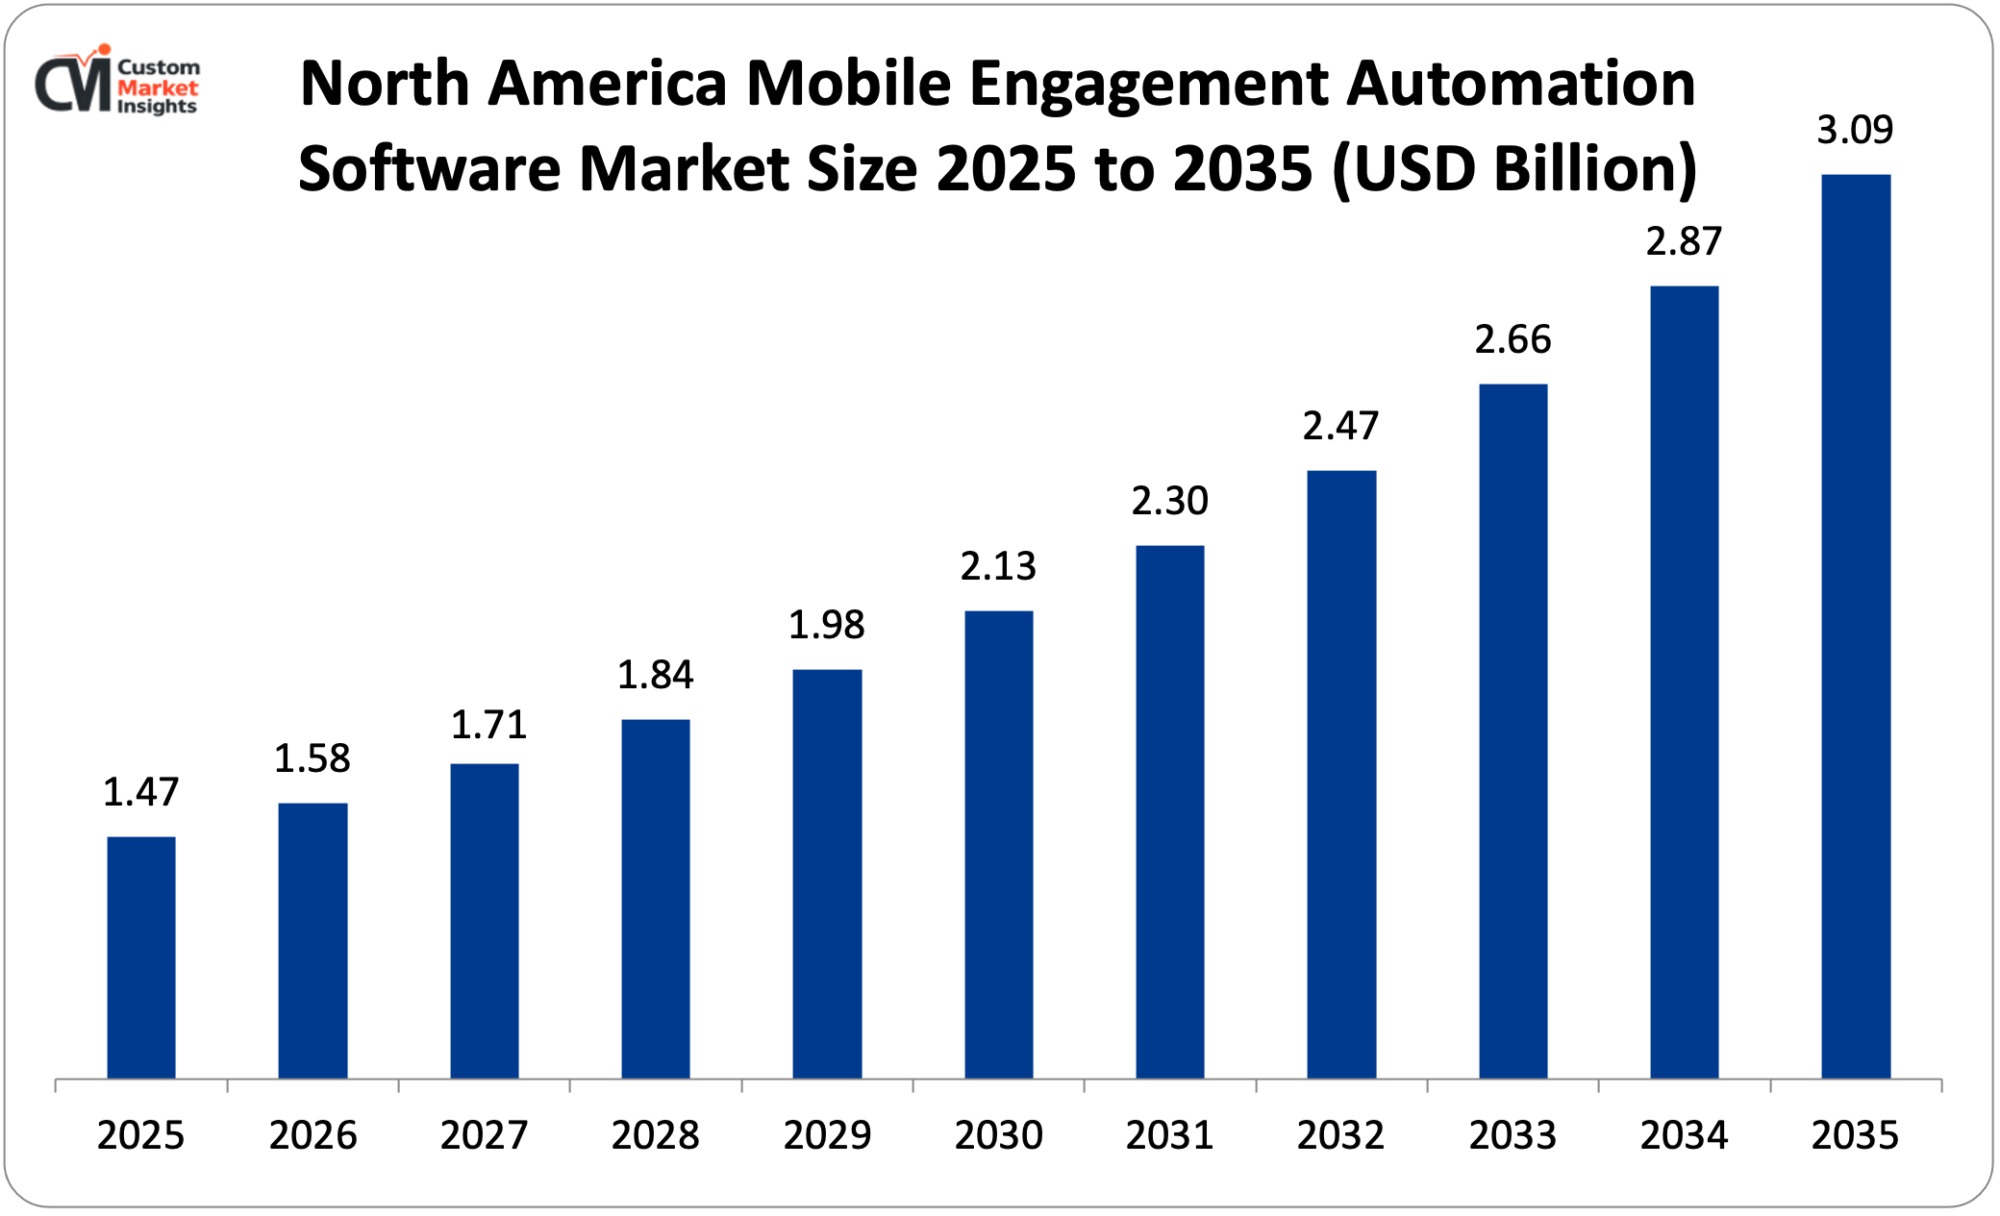
The North America mobile engagement automation market size is estimated at USD 1.47 billion in 2025 and is projected to reach approximately USD 3.09 billion by 2035, with a 9.1% CAGR from 2026 to 2035.
Why Did North America Dominate the Market in 2025?
The most important player in the world has been identified as North America, with a market share of about 38% in 2025, due to the great digital infrastructure and high rate of smartphone penetration in the region over 85, in the case of developed mobile app ecosystem with advanced consumer expectations, aggregation of leading technology companies and first mover businesses, and huge budgets on marketing technology adoption. The territory enjoys well-developed e-commerce markets with mobile constituting 60%+ of online purchases, well-developed marketing automation standards that create a basis of mobile-specific features, and regulatory standards such as CCPA that create consumer privacy protection at the expense of authorization-based marketing. The US had a dominant share in the market high command through its status as the largest digital advertising market in the world with USD 297Bn expenditure in 2024, concentration of fortune 500 companies in enterprise adoption, and mobile app development and marketing. The North American region has become faster in adopting major mobile engagement platforms vendors such as Braze, Airship, and Iterable, due to their headquarter location and the active linkage of the platforms with regional technology ecosystems.
U.S. Market Trends
The US market is a huge share of world demand based on highly competitive digital marketplace with incentives of sophisticated engagement strategies, retail giants such as Amazon, Walmart, and Target defining engagement best practices, financial services digitalization incorporating mobile banking users of 197 million subscribers and retention in 2024, and streaming media companies competing intensively to gain subscriber attention and retain them. The US digital marketing surveys show that 78% of the enterprises will step up investment in mobile engagement automation in 2026 due to the demonstrated ROI and the competitive forces. The market represents a high level of implementation maturity where companies are using multi-channel orchestration, AI-enabled personalization and sophisticated analytics, but privacy laws and sensitivity of consumers regarding the use of their data necessitate a delicate balance between personalization and sensitivity towards user preferences.
Why is Asia Pacific Growing at the Fastest Rate?
Asia Pacific is on course of the highest growth expected CAGR 12.4% 2026-2035, due to the explosive adoption of smartphones with 3.1 billion mobile users, and expected growth to 3.9 billion by 2028 and the growth of middle class and consumer spending, as well as digital interactions, as a mobile-first digital economy where mobile has become the first internet access and where e-commerce grows quickly with countries like China, India, and Southeast Asia realizing 30-50% annual mobile commerce growth. Regional digital economy research indicates that in a period of 2027, mobile commerce will constitute 74% of regional e-commerce, vindicating mobile commerce, in comparison with 62% of the global e-commerce.
China Market Trends
China boasts the largest Asia Pacific mobile engagement market as it has the largest mobile user base in the world, over 1.1 billion smartphones, super-app ecosystem has many as WeChat, Alipay, and others, built on a single platform, sophisticated smartphone payment infrastructure, with 85% of urban consumers already using mobile payments, and platform providers in China such as Alibaba Cloud and Tencent offer localized mobile engagement solutions. The e-commerce giants of China such as Alibaba, JD.com, and Pinduoduo can be seen as the world leaders in the sophistication of mobile engagement, as they use powerful AI, social commerce merging, and live-streaming commerce that demands the automation of real-time engagement on a scale previously unseen. Nevertheless, the localization of data demand and privacy laws demand special compliance strategies to conduct business in the Chinese market.
Why is Europe Focusing on Privacy-Compliant Engagement?
The market size in Europe is huge, the level of digital economy and high smartphone adoption of 80% on average throughout the region, deep focus on the need to protect consumer privacy via GDPR and ePrivacy rules, developed e-commerce markets with high expectations of consumers, and increased mobile banking and fintech uptake. Europe has a large market share across the world with privacy-first platform capabilities such as consent management, data reduction, and user privacy over personal information, a diverse linguistic and cultural environment necessitating local interaction strategies, and extensive adoption of artificial intelligence and automation in privacy-regulatory systems. European marketing technology surveys have shown that 83% of European enterprises believe compliance with GDPR to be crucial when choosing mobile engagement platforms, which led vendors to innovate privacy-preservation personalization methods.
Germany Market Trends
Germany boasts high market coverage since its advanced manufacturing and automotive industries are digitizing customer relationships, high retail and e-commerce market with mobile accounting 60% of online transactions, high-tech financial services market with mobile banking aggressively deploying its services, and consumer privacy-focused requirements which dictate it needs a transparent and permission-based engagement strategy. Germany is a market with a high emphasis on security and data protection, which makes them prefer using platforms with better privacy settings and automation of compliance. The growth in the importance of automation investment in mobile engagement was 34% in 2024, as reported by German research on digital economy, with recognition of the strategic significance of mobile despite the cultural value of privacy.
Why is the LAMEA Region Experiencing Growth?
The LAMEA region is witnessing an increasingly marketable development with smartphone penetration in emerging markets rising, more people joining the internet and using it for the first time, increasing adoption of e-commerce in such areas as the Brazilian and the Mexican markets, and the adoption of mobile payments in response to the inadequate banking infrastructure in most markets. The Middle Eastern nations such as UAE and Saudi Arabia show a smartphone penetration of more than 90% and an advanced level of digital infrastructure that facilitates the implementation of advanced mobile engagement. The mobile commerce in Latin America is expected to be expanded by 20%+ CAGR in the coming 2028 due to the enhancement of infrastructure that facilitates logistics, increasing consumer trust in online purchases, and intensive acquisition of e-commerce by the country and global organizations.
Top Players in the Market and Their Offerings
- Braze Inc.
- Airship (Formerly Urban Airship)
- CleverTap
- MoEngage
- Leanplum (CleverTap)
- Iterable Inc.
- Amplitude Inc.
- Salesforce Inc. (Marketing Cloud)
- Adobe Inc. (Adobe Experience Cloud)
- Oracle Corporation (Oracle CX Marketing)
- IBM Corporation (Watson Campaign Automation)
- Others
Market News – Key Developments
The market has undergone significant developments as industry participants seek to expand capabilities and enhance product portfolios.
- In June 2023: Braze unveiled higher-order AI-driven predictive analytics in the customer engagement platform. Timely, content, and channel selection in the new Sage AI are automatically optimized according to the individual user behaviour patterns and shows a major development in automated optimization of the campaigns.
- In January 2025: CleverTap launched its advanced omnichannel orchestration suite integrating mobile, web, email, SMS, and WhatsApp messaging within unified customer journey builder, enabling marketers to create sophisticated cross-channel campaigns with automated fallback logic and real-time performance optimization.
These strategic activities have allowed companies to strengthen market positions, expand product offerings, enhance technological capabilities, and capitalize on growth opportunities within the expanding market.
The Mobile Engagement Automation Market is segmented as follows:
By Component
- Software
- Services
- Professional Services
- Managed Services
By Deployment Mode
- Cloud-based
- On-premise
By Organization Size
- Small and Medium Enterprises (SMEs)
- Large Enterprises
By Application
- Push Notifications
- In-App Messaging
- Email Marketing
- SMS Marketing
- Mobile Wallet Marketing
- Other Applications
By End-User Industry
- Retail and E-commerce
- Banking and Financial Services
- Healthcare
- Media and Entertainment
- Travel and Hospitality
- Gaming
- Other Industries
Regional Coverage:
North America
- U.S.
- Canada
- Mexico
- Rest of North America
Europe
- Germany
- France
- U.K.
- Russia
- Italy
- Spain
- Netherlands
- Rest of Europe
Asia Pacific
- China
- Japan
- India
- New Zealand
- Australia
- South Korea
- Taiwan
- Rest of Asia Pacific
The Middle East & Africa
- Saudi Arabia
- UAE
- Egypt
- Kuwait
- South Africa
- Rest of the Middle East & Africa
Latin America
- Brazil
- Argentina
- Rest of Latin America
Table of Contents
- Chapter 1. Preface
- 1.1 Report Description and Scope
- 1.2 Research scope
- 1.3 Research methodology
- 1.3.1 Market Research Type
- 1.3.2 Market research methodology
- Chapter 2. Executive Summary
- 2.1 Global Mobile Engagement Automation Market, (2026 – 2035) (USD Billion)
- 2.2 Global Mobile Engagement Automation Market : snapshot
- Chapter 3. Global Mobile Engagement Automation Market – Industry Analysis
- 3.1 Mobile Engagement Automation Market: Market Dynamics
- 3.2 Market Drivers
- 3.2.1 Explosive Growth in Mobile Commerce and App-Based Economy
- 3.2.2 AI-Powered Personalization and Predictive Analytics Revolution
- 3.3 Market Restraints
- 3.4 Market Opportunities
- 3.5 Market Challenges
- 3.6 Porter’s Five Forces Analysis
- 3.7 Market Attractiveness Analysis
- 3.7.1 Market attractiveness analysis By Component
- 3.7.2 Market attractiveness analysis By Deployment Mode
- 3.7.3 Market attractiveness analysis By Organization Size
- 3.7.4 Market attractiveness analysis By Application
- 3.7.5 Market attractiveness analysis By End-User Industry
- Chapter 4. Global Mobile Engagement Automation Market- Competitive Landscape
- 4.1 Company market share analysis
- 4.1.1 Global Mobile Engagement Automation Market: company market share, 2025
- 4.2 Strategic development
- 4.2.1 Acquisitions & mergers
- 4.2.2 New Product launches
- 4.2.3 Agreements, partnerships, cullaborations, and joint ventures
- 4.2.4 Research and development and Regional expansion
- 4.3 Price trend analysis
- 4.1 Company market share analysis
- Chapter 5. Global Mobile Engagement Automation Market – Component Analysis
- 5.1 Global Mobile Engagement Automation Market overview: By Component
- 5.1.1 Global Mobile Engagement Automation Market share, By Component, 2025 and 2035
- 5.2 Software
- 5.2.1 Global Mobile Engagement Automation Market by Software, 2026 – 2035 (USD Billion)
- 5.3 Services
- 5.3.1 Global Mobile Engagement Automation Market by Services, 2026 – 2035 (USD Billion)
- 5.4 Professional Services
- 5.4.1 Global Mobile Engagement Automation Market by Professional Services, 2026 – 2035 (USD Billion)
- 5.5 Managed Services
- 5.5.1 Global Mobile Engagement Automation Market by Managed Services, 2026 – 2035 (USD Billion)
- 5.1 Global Mobile Engagement Automation Market overview: By Component
- Chapter 6. Global Mobile Engagement Automation Market – Deployment Mode Analysis
- 6.1 Global Mobile Engagement Automation Market overview: By Deployment Mode
- 6.1.1 Global Mobile Engagement Automation Market share, By Deployment Mode, 2025 and 2035
- 6.2 Cloud-based
- 6.2.1 Global Mobile Engagement Automation Market by Cloud-based, 2026 – 2035 (USD Billion)
- 6.3 On-premise
- 6.3.1 Global Mobile Engagement Automation Market by On-premise, 2026 – 2035 (USD Billion)
- 6.1 Global Mobile Engagement Automation Market overview: By Deployment Mode
- Chapter 7. Global Mobile Engagement Automation Market – Organization Size Analysis
- 7.1 Global Mobile Engagement Automation Market overview: By Organization Size
- 7.1.1 Global Mobile Engagement Automation Market share, By Organization Size, 2025 and 2035
- 7.2 Small and Medium Enterprises (SMEs)
- 7.2.1 Global Mobile Engagement Automation Market by Small and Medium Enterprises (SMEs), 2026 – 2035 (USD Billion)
- 7.3 Large Enterprises
- 7.3.1 Global Mobile Engagement Automation Market by Large Enterprises, 2026 – 2035 (USD Billion)
- 7.1 Global Mobile Engagement Automation Market overview: By Organization Size
- Chapter 8. Global Mobile Engagement Automation Market – Application Analysis
- 8.1 Global Mobile Engagement Automation Market overview: By Application
- 8.1.1 Global Mobile Engagement Automation Market share, By Application, 2025 and 2035
- 8.2 Push Notifications
- 8.2.1 Global Mobile Engagement Automation Market by Push Notifications, 2026 – 2035 (USD Billion)
- 8.3 In-App Messaging
- 8.3.1 Global Mobile Engagement Automation Market by In-App Messaging, 2026 – 2035 (USD Billion)
- 8.4 Email Marketing
- 8.4.1 Global Mobile Engagement Automation Market by Email Marketing, 2026 – 2035 (USD Billion)
- 8.5 SMS Marketing
- 8.5.1 Global Mobile Engagement Automation Market by SMS Marketing, 2026 – 2035 (USD Billion)
- 8.6 Mobile Wallet Marketing
- 8.6.1 Global Mobile Engagement Automation Market by Mobile Wallet Marketing, 2026 – 2035 (USD Billion)
- 8.7 Other Applications
- 8.7.1 Global Mobile Engagement Automation Market by Other Applications, 2026 – 2035 (USD Billion)
- 8.1 Global Mobile Engagement Automation Market overview: By Application
- Chapter 9. Global Mobile Engagement Automation Market – End-User Industry Analysis
- 9.1 Global Mobile Engagement Automation Market overview: By End-User Industry
- 9.1.1 Global Mobile Engagement Automation Market share, By End-User Industry, 2025 and 2035
- 9.2 Retail and E-commerce
- 9.2.1 Global Mobile Engagement Automation Market by Retail and E-commerce, 2026 – 2035 (USD Billion)
- 9.3 Banking and Financial Services
- 9.3.1 Global Mobile Engagement Automation Market by Banking and Financial Services, 2026 – 2035 (USD Billion)
- 9.4 Healthcare
- 9.4.1 Global Mobile Engagement Automation Market by Healthcare, 2026 – 2035 (USD Billion)
- 9.5 Media and Entertainment
- 9.5.1 Global Mobile Engagement Automation Market by Media and Entertainment, 2026 – 2035 (USD Billion)
- 9.6 Travel and Hospitality
- 9.6.1 Global Mobile Engagement Automation Market by Travel and Hospitality, 2026 – 2035 (USD Billion)
- 9.7 Gaming
- 9.7.1 Global Mobile Engagement Automation Market by Gaming, 2026 – 2035 (USD Billion)
- 9.8 Other Industries
- 9.8.1 Global Mobile Engagement Automation Market by Other Industries, 2026 – 2035 (USD Billion)
- 9.1 Global Mobile Engagement Automation Market overview: By End-User Industry
- Chapter 10. Mobile Engagement Automation Market – Regional Analysis
- 10.1 Global Mobile Engagement Automation Market Regional Overview
- 10.2 Global Mobile Engagement Automation Market Share, by Region, 2025 & 2035 (USD Billion)
- 10.3. North America
- 10.3.1 North America Mobile Engagement Automation Market, 2026 – 2035 (USD Billion)
- 10.3.1.1 North America Mobile Engagement Automation Market, by Country, 2026 – 2035 (USD Billion)
- 10.3.1 North America Mobile Engagement Automation Market, 2026 – 2035 (USD Billion)
- 10.4 North America Mobile Engagement Automation Market, by Component, 2026 – 2035
- 10.4.1 North America Mobile Engagement Automation Market, by Component, 2026 – 2035 (USD Billion)
- 10.5 North America Mobile Engagement Automation Market, by Deployment Mode, 2026 – 2035
- 10.5.1 North America Mobile Engagement Automation Market, by Deployment Mode, 2026 – 2035 (USD Billion)
- 10.6 North America Mobile Engagement Automation Market, by Organization Size, 2026 – 2035
- 10.6.1 North America Mobile Engagement Automation Market, by Organization Size, 2026 – 2035 (USD Billion)
- 10.7 North America Mobile Engagement Automation Market, by Application, 2026 – 2035
- 10.7.1 North America Mobile Engagement Automation Market, by Application, 2026 – 2035 (USD Billion)
- 10.8 North America Mobile Engagement Automation Market, by End-User Industry, 2026 – 2035
- 10.8.1 North America Mobile Engagement Automation Market, by End-User Industry, 2026 – 2035 (USD Billion)
- 10.9. Europe
- 10.9.1 Europe Mobile Engagement Automation Market, 2026 – 2035 (USD Billion)
- 10.9.1.1 Europe Mobile Engagement Automation Market, by Country, 2026 – 2035 (USD Billion)
- 10.9.1 Europe Mobile Engagement Automation Market, 2026 – 2035 (USD Billion)
- 10.10 Europe Mobile Engagement Automation Market, by Component, 2026 – 2035
- 10.10.1 Europe Mobile Engagement Automation Market, by Component, 2026 – 2035 (USD Billion)
- 10.11 Europe Mobile Engagement Automation Market, by Deployment Mode, 2026 – 2035
- 10.11.1 Europe Mobile Engagement Automation Market, by Deployment Mode, 2026 – 2035 (USD Billion)
- 10.12 Europe Mobile Engagement Automation Market, by Organization Size, 2026 – 2035
- 10.12.1 Europe Mobile Engagement Automation Market, by Organization Size, 2026 – 2035 (USD Billion)
- 10.13 Europe Mobile Engagement Automation Market, by Application, 2026 – 2035
- 10.13.1 Europe Mobile Engagement Automation Market, by Application, 2026 – 2035 (USD Billion)
- 10.14 Europe Mobile Engagement Automation Market, by End-User Industry, 2026 – 2035
- 10.14.1 Europe Mobile Engagement Automation Market, by End-User Industry, 2026 – 2035 (USD Billion)
- 10.15. Asia Pacific
- 10.15.1 Asia Pacific Mobile Engagement Automation Market, 2026 – 2035 (USD Billion)
- 10.15.1.1 Asia Pacific Mobile Engagement Automation Market, by Country, 2026 – 2035 (USD Billion)
- 10.15.1 Asia Pacific Mobile Engagement Automation Market, 2026 – 2035 (USD Billion)
- 10.16 Asia Pacific Mobile Engagement Automation Market, by Component, 2026 – 2035
- 10.16.1 Asia Pacific Mobile Engagement Automation Market, by Component, 2026 – 2035 (USD Billion)
- 10.17 Asia Pacific Mobile Engagement Automation Market, by Deployment Mode, 2026 – 2035
- 10.17.1 Asia Pacific Mobile Engagement Automation Market, by Deployment Mode, 2026 – 2035 (USD Billion)
- 10.18 Asia Pacific Mobile Engagement Automation Market, by Organization Size, 2026 – 2035
- 10.18.1 Asia Pacific Mobile Engagement Automation Market, by Organization Size, 2026 – 2035 (USD Billion)
- 10.19 Asia Pacific Mobile Engagement Automation Market, by Application, 2026 – 2035
- 10.19.1 Asia Pacific Mobile Engagement Automation Market, by Application, 2026 – 2035 (USD Billion)
- 10.20 Asia Pacific Mobile Engagement Automation Market, by End-User Industry, 2026 – 2035
- 10.20.1 Asia Pacific Mobile Engagement Automation Market, by End-User Industry, 2026 – 2035 (USD Billion)
- 10.21. Latin America
- 10.21.1 Latin America Mobile Engagement Automation Market, 2026 – 2035 (USD Billion)
- 10.21.1.1 Latin America Mobile Engagement Automation Market, by Country, 2026 – 2035 (USD Billion)
- 10.21.1 Latin America Mobile Engagement Automation Market, 2026 – 2035 (USD Billion)
- 10.22 Latin America Mobile Engagement Automation Market, by Component, 2026 – 2035
- 10.22.1 Latin America Mobile Engagement Automation Market, by Component, 2026 – 2035 (USD Billion)
- 10.23 Latin America Mobile Engagement Automation Market, by Deployment Mode, 2026 – 2035
- 10.23.1 Latin America Mobile Engagement Automation Market, by Deployment Mode, 2026 – 2035 (USD Billion)
- 10.24 Latin America Mobile Engagement Automation Market, by Organization Size, 2026 – 2035
- 10.24.1 Latin America Mobile Engagement Automation Market, by Organization Size, 2026 – 2035 (USD Billion)
- 10.25 Latin America Mobile Engagement Automation Market, by Application, 2026 – 2035
- 10.25.1 Latin America Mobile Engagement Automation Market, by Application, 2026 – 2035 (USD Billion)
- 10.26 Latin America Mobile Engagement Automation Market, by End-User Industry, 2026 – 2035
- 10.26.1 Latin America Mobile Engagement Automation Market, by End-User Industry, 2026 – 2035 (USD Billion)
- 10.27. The Middle-East and Africa
- 10.27.1 The Middle-East and Africa Mobile Engagement Automation Market, 2026 – 2035 (USD Billion)
- 10.27.1.1 The Middle-East and Africa Mobile Engagement Automation Market, by Country, 2026 – 2035 (USD Billion)
- 10.27.1 The Middle-East and Africa Mobile Engagement Automation Market, 2026 – 2035 (USD Billion)
- 10.28 The Middle-East and Africa Mobile Engagement Automation Market, by Component, 2026 – 2035
- 10.28.1 The Middle-East and Africa Mobile Engagement Automation Market, by Component, 2026 – 2035 (USD Billion)
- 10.29 The Middle-East and Africa Mobile Engagement Automation Market, by Deployment Mode, 2026 – 2035
- 10.29.1 The Middle-East and Africa Mobile Engagement Automation Market, by Deployment Mode, 2026 – 2035 (USD Billion)
- 10.30 The Middle-East and Africa Mobile Engagement Automation Market, by Organization Size, 2026 – 2035
- 10.30.1 The Middle-East and Africa Mobile Engagement Automation Market, by Organization Size, 2026 – 2035 (USD Billion)
- 10.31 The Middle-East and Africa Mobile Engagement Automation Market, by Application, 2026 – 2035
- 10.31.1 The Middle-East and Africa Mobile Engagement Automation Market, by Application, 2026 – 2035 (USD Billion)
- 10.32 The Middle-East and Africa Mobile Engagement Automation Market, by End-User Industry, 2026 – 2035
- 10.32.1 The Middle-East and Africa Mobile Engagement Automation Market, by End-User Industry, 2026 – 2035 (USD Billion)
- Chapter 11. Company Profiles
- 11.1 Braze Inc.
- 11.1.1 Overview
- 11.1.2 Financials
- 11.1.3 Product Portfolio
- 11.1.4 Business Strategy
- 11.1.5 Recent Developments
- 11.2 Airship (Formerly Urban Airship)
- 11.2.1 Overview
- 11.2.2 Financials
- 11.2.3 Product Portfolio
- 11.2.4 Business Strategy
- 11.2.5 Recent Developments
- 11.3 CleverTap
- 11.3.1 Overview
- 11.3.2 Financials
- 11.3.3 Product Portfolio
- 11.3.4 Business Strategy
- 11.3.5 Recent Developments
- 11.4 MoEngage
- 11.4.1 Overview
- 11.4.2 Financials
- 11.4.3 Product Portfolio
- 11.4.4 Business Strategy
- 11.4.5 Recent Developments
- 11.5 Leanplum (CleverTap)
- 11.5.1 Overview
- 11.5.2 Financials
- 11.5.3 Product Portfolio
- 11.5.4 Business Strategy
- 11.5.5 Recent Developments
- 11.6 Iterable Inc.
- 11.6.1 Overview
- 11.6.2 Financials
- 11.6.3 Product Portfolio
- 11.6.4 Business Strategy
- 11.6.5 Recent Developments
- 11.7 Amplitude Inc.
- 11.7.1 Overview
- 11.7.2 Financials
- 11.7.3 Product Portfolio
- 11.7.4 Business Strategy
- 11.7.5 Recent Developments
- 11.8 Salesforce Inc. (Marketing Cloud)
- 11.8.1 Overview
- 11.8.2 Financials
- 11.8.3 Product Portfolio
- 11.8.4 Business Strategy
- 11.8.5 Recent Developments
- 11.9 Adobe Inc. (Adobe Experience Cloud)
- 11.9.1 Overview
- 11.9.2 Financials
- 11.9.3 Product Portfolio
- 11.9.4 Business Strategy
- 11.9.5 Recent Developments
- 11.10 Oracle Corporation (Oracle CX Marketing)
- 11.10.1 Overview
- 11.10.2 Financials
- 11.10.3 Product Portfolio
- 11.10.4 Business Strategy
- 11.10.5 Recent Developments
- 11.11 IBM Corporation (Watson Campaign Automation)
- 11.11.1 Overview
- 11.11.2 Financials
- 11.11.3 Product Portfolio
- 11.11.4 Business Strategy
- 11.11.5 Recent Developments
- 11.12 Others.
- 11.12.1 Overview
- 11.12.2 Financials
- 11.12.3 Product Portfolio
- 11.12.4 Business Strategy
- 11.12.5 Recent Developments
- 11.1 Braze Inc.
List Of Figures
Figures No 1 to 41
List Of Tables
Tables No 1 to 127
FAQs
Global Mobile Engagement Automation Market is estimated to be witnessing a considerable market growth because of the explosive growth of mobile commerce, which is likely to grow to USD 5.4 trillion by 2027 (or 62% of e-commerce sales), which has 6.8 billion smartphone users worldwide generating huge addressable market, which has 4.8 hours daily average mobile use with 88% of them using app-based opportunities, which is driving the importance of in-app engagement, and oligo-channel orchestration needs that will integrate interactions across various customer touchpoints.
Asia-Pacific Region is recording the highest growth with an estimated CAGR of 12.4% between 2026 and 2035, due to the explosive smartphone adoption, projected to reach 4 billion users by 2028, mobile-first digital economy, in which mobile is the main way most consumers access the internet, massive e-commerce that is seeing markets increase 30-50% per annum, fast growing middle classes that are raising consumer spending, sophisticated super-app ecosystem in China that is setting global innovation standards, and a fast growing.
It is projected that North America will have the largest share of revenue, with an estimated market share of about 38% of the global market share given the well-developed digital infrastructure, where 85 or more% of the population has smartphone access, largest digital advertising market in the world with USD 297 billion in 2024 and the concentration of Fortune 500 companies that are driving enterprise adoption, sophisticated consumer expectations in mobile app ecosystems, and the availability of leading mobile engagement platforms vendors such as Braze, Airship, and Iterable based in the region give them.
According to the present analysis, it is estimated that the market will grow to about USD 9.63 billion by 2035 with a speedy growth aided by further penetration of smartphones into the global market reaching 7.7 billion users by 2028, the growth of AI and machine learning that allows the application of advanced personalization and predictive analytics, the need to coordinate mobile with other customer touchpoints through omnichannel marketing, the mobile commerce market is likely to reach USD 5.4 trillion by 2027, privacy-compliant engagement technologies.
Automation of mobile engagement platforms are variable investments whose prices vary based on deployment model, feature sophistication and volume of use. The pricing of software-as-a-Service platforms is often based on usage with ranges of USD 500-2000/month based on small businesses with below 100,000 monthly active users, USD 5000-20,000/month with mid-market companies with 500,000-2 million monthly users, and USD 25,000-100,000+/month based on enterprise deployments with millions of users across multiple brands and geographic markets. Nonetheless, a number of reasons support these investments such as dramatic customer lifetime value increases of 25-40% with improvements that are commonly reported, a lower cost of customer acquisition due to retention with resultant reduction of 300-500% ROI on platform investment in the first year, automation efficiency gains which reduce manual marketing workload by 40-60% which allows the team to focus on strategy and quantifiable ROI which is commonly reported at 300-500% on platform investment in the first year. Freemium and tiered pricing enable advanced features to be available to startups and SMEs and enterprise licensing offers predictable prices in large-scale implementations.
Government regulations have a big impact on the market with data privacy laws such as GDPR in Europe, CCPA in California and similar laws mandating explicit user consent, data minimization and disclosure of data use, consumer protection laws that dictate the frequency of marketing communications, opt-out options and disclosure policies, telecommunications laws setting conditions on the use of SMS and push notifications and industry-specific regulations such as HIPAA in healthcare and financial services regulations that require sensitive customer information would be used securely and accessibility requirements where inaccessible mobile experiences serve customers with disabilities. The laws governing privacy inspire the innovation of the platform in the area of consent management, personalization methods that preserve privacy, and automated compliance detection.
The key players in the market are Braze Inc., Airship (Formerly Urban Airship), CleverTap, MoEngage, Leanplum (CleverTap), Iterable Inc., Amplitude Inc., Salesforce Inc. (Marketing Cloud), Adobe Inc. (Adobe Experience Cloud), Oracle Corporation (Oracle CX Marketing), IBM Corporation (Watson Campaign Automation), Others.