Configure Price and Quote CPQ Software Market Size, Trends and Insights By Deployment Type (Cloud-Based, On-Premise, Hybrid), By Enterprise Size (Large Enterprises, Small and Medium-Sized Enterprises (SMEs)), By Application (Manufacturing, IT and Telecom, Healthcare and Life Sciences, BFSI (Banking, Financial Services, and Insurance), Retail and E-Commerce, Automotive, Other Applications), By Integration Type (CRM Integration, ERP Integration, Billing Integration), and By Region - Global Industry Overview, Statistical Data, Competitive Analysis, Share, Outlook, and Forecast 2026 – 2035
Report Snapshot
CAGR: 16.5%
| Study Period: | 2026-2035 |
| Fastest Growing Market: | Asia Pacific |
| Largest Market: | North America |
Major Players
- Salesforce Inc.
- Oracle Corporation
- SAP SE
- IBM Corporation
- Others
Reports Description
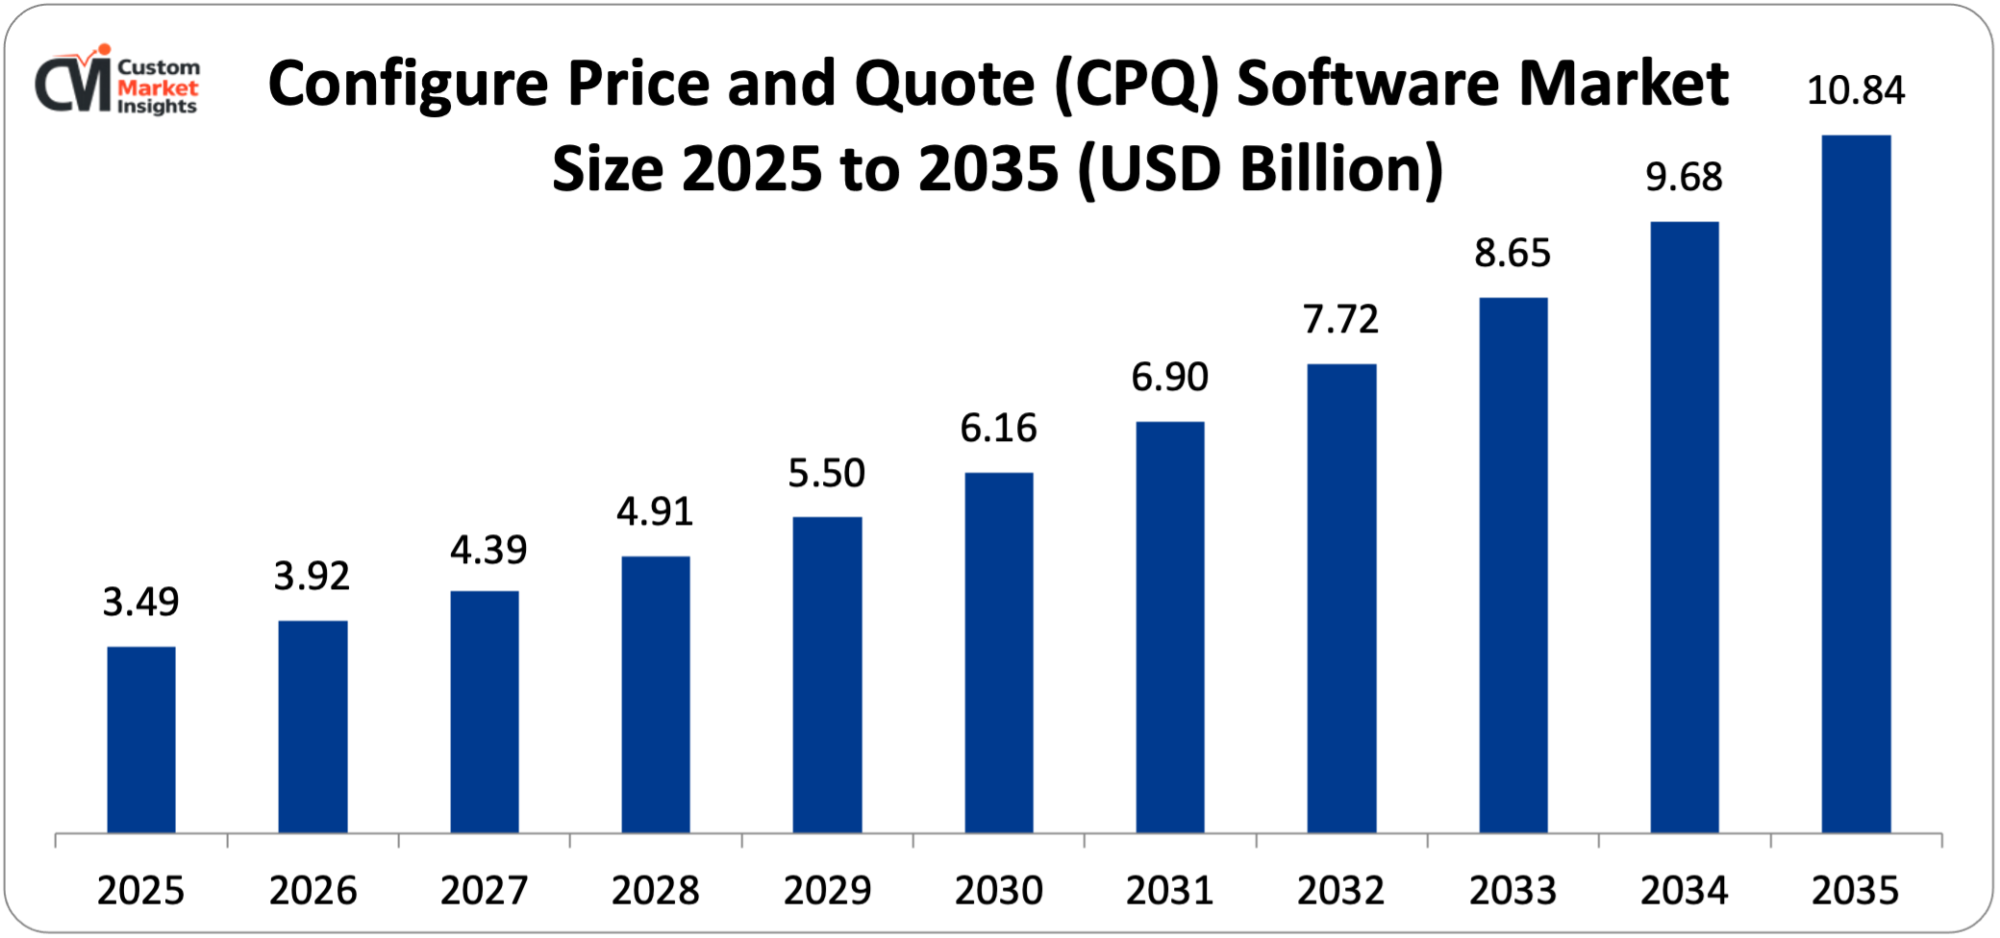
The world market value of the CPQ software is projected to be USD 3.49 billion in the year 2025, and it is projected that the market value will increase to USD 3.92 billion during the year 2026, and at 16.5% CAGR growth between 2026 and 2035, the market value will be approximately USD 10.84 billion.
The market is expanding due to the rising demand of automation of sales in enterprises, the complexity of product design and pricing frameworks, the spread of cloud-based solutions and digital transformation efforts, the implementation of artificial intelligence and machine learning to provide intelligent pricing suggestions, and the necessity to shorten the time frame of sales and remove the pricing mistakes of complex B2B interactions.
Market Highlight
- Market of CPQ software in North America was the market leader with a 2025 market share.
- Asia Pacific will continue to expand by 14.2% between the years 2026 and 2035.
- By type of deployment, 68% of the market share had been conquered by the cloud-based segment deployment in 2025.
- By the deployment type, the hybrid segment will record the best CAGR of 18.3% in the period 2026-2035.
- Application-wise, the manufacturing segment will have the largest market share of 34% in 2025, with the healthcare and life sciences segment projected to have the highest CAGR of 17.8% within the period of the projection, 2026-35.
- Enterprise size, The large enterprises segment took 71% of market share in 2025.
- In 2024, approximately 58% of B2B companies relied on CPQ tools to streamline their sales processes and reduce quote turnaround times.
Significant Growth Factors
The Configure Price and Quote CPQ Software Market Trends present significant growth opportunities due to several factors:
- Accelerating Digital Transformation and Sales Automation Demand Globally: The overriding theme of the CPQ software market is the increased urgency of businesses to automate their sales processes and complex quoting workflows, which is driving enterprises in all sectors to consider automating their operations to increase profitability and reduce low efficiency sales cycles. Global CPQ market showed outstanding growth momentum with the forecast showing that the market would experience a compound annual growth rate of 19.3% between 2021 and 2026 which is beckoning organizations to put technology at the center in achieving a competitive advantage in the ever-changing complex B2B sales environment. The Configure, Price and Quote (CPEQ) process used to require several stakeholders, spreadsheets, manual calculations, and a lot of back and forth between the salespeople, the financial departments and the product experts which created bottlenecks and slowed down deal closures and caused costly pricing mistakes. The CPQ market will expand at a rate of more than 20% per year, as the demand for automation of the sales process and the need for tailor-made solutions in the competitive business environment, where buyers demand swift and correct answers to their questions, increase. With the need to optimize the operation of revenue operations and organizations to establish smooth buying experiences, CPQ platforms have emerged as strategic investments that integrate operations, finance, and sales teams around seamless digital interactions. Systems of CPQ today store product catalogs with thousands of SKUs and apply sophisticated pricing policies such as volume breaks, contract terms and customer specific agreements, place a margin guard on deals to prohibit losses, and create professional quote records, which could be programmed and delivered within minutes instead of days. The fact that the global construction business is projected to rise to USD 15.5 trillion by the year 2030, the likes of the technological, health and manufacturing sectors are expected to grow in similar proportions has meant that there is an unprecedented demand to have advanced quoting systems that would deal with complex product structures, multiple currency pricing and regulatory laws across the various jurisdictions. It is estimated that cloud CPQ tools in publicly awarded companies will become close to USD 5.8 billion by 2026 at a 3-year CAGR of 16%, indicating the shift of tactical sales tools to strategic revenue platforms that organizations consider a core part of modern selling. The move to more subscription-based business models, usage-based pricing models, and outcome-based contracts has only increased the necessity of CPQ systems capable of order to deal with recurring revenue, proration-based pricing, mid-term amendments and automated renewal processes that traditional quoting systems are not as efficient in managing.
- Artificial Intelligence and Machine Learning Integration Transforming Pricing Intelligence: The adoption of artificial intelligence and machine learning systems into CPQ systems is a paradigm shift in how businesses manage the configuration of products and optimization of pricing and deal strategy, ceasing to be reactive but becoming predictive and intelligent in revenue management. AI-driven CPQ systems utilize thousands of previous quotes, customer buying patterns, competitive data, and immediate market circumstances to suggest the best pricing techniques that will maximize the win rates and profit margins, which have shown a quantifiable effect on a business. A survey of more than 1,000 go-to-market professionals commissioned in 2025 found that sales teams that often use AI tools on average say their sales cycle is shorter by nearly three weeks and that the deal size of organization using AI-based CPQ solutions increased by up to 20% with intelligent cross-sell and upsell recommendations based on customer segmentation and purchasing behaviors. Recent AI applications in CPQ are predictive configuration engines, which analyze customer needs and automatically recommend optimum product combinations, dynamic price algorithms, which vary the recommendation depending on factors such as order volume, customer relationship value, competitive positioning, and inventory levels, intelligent approval routing, which evaluates deal risk profile and automatically approves the suggestion of low-risk quotes and flags high-risk configurations to management consideration, and natural language process interfaces, which enable sales representatives to interact with CPQ systems in a conversational way, describing customer needs and receiving real-time configuration and pricing advice. By 2024, mid-market SaaS vendors experienced rapid adoption of AI-enhanced predictive pricing models and intelligent upsell suggestions, with growth increasing by 44% alone, showing that intelligent upsell suggestions and predictive pricing models have been rapidly adopted by companies that previously could only afford to deploy them with custom-built systems. Machine learning algorithms are constantly enhancing the precision of the quotes by finding trends in successful transactions, learning what goes wrong, and automatically updating recommendations because of the changes in market dynamics and customer behaviors. Firms that use AI-based CPQ have stated that quote-to-cash cycles had been cut by 30-40%, sales had been boosted by 20-25%, and pricing errors had been reduced by up to 90%, generating substantial competitive advantages in industries where speed and accuracy directly affect customer buying behaviors. Oracle indicated that the proportion of customer-based quotes rose to 79% in the market after incorporating AI-based CPQ solutions, and this showed that AI supports self-service customization portals whereby customers can assemble intricate products and get the correct quotation without the intervention of the sales representative.
What are the Major Advances Changing the Configure Price and Quote CPQ Software Market Today
- Generative AI and Natural Language Processing Revolutionizing User Experience: The most disruptive technological component in CPQ software is the adoption of generative AI and natural language processing functions that essentially alter the modeling of interaction between sales teams and configuration and pricing systems, replacing the usual form-based interfaces with a chat-based, intelligent assistant. Today, CPQ systems now have AI agents that can mimic the Salesforce Agent Force, Microsoft Copilot, and HubSpot agents like Agent.ai that handle routine quoting tasks, propose optimal approval routes and offer contextual insights during the quoting process and create workflows that are less frictional, letting salespeople focus on high value customer interactions. These artificial intelligences enable sales teams to simply explain what the customer needs using natural language, the system processes the request and automatically creates suitable product combinations, pricing suggestions, and quote paperwork without them having to go through complicated and cumbersome configuration interfaces or memorize the product rules. AskCPQ by Mobileforce can be seen as the tip of the iceberg since it adopts the concept of conversational AI whereby natural language communication is enabled throughout the quoting process to the extent of a sales representative asking questions such as “What is the best configuration to build a manufacturing client who needs 500 units and a 24-month warranty?” and getting immediate and optimized suggestions. Beyond configuration, generative AI can be used to write detailed proposal documents, automatically filling them with customer-specific information, technical specifications, terms and conditions, and personalized messages based on customer information and past interactions and can run in hours, which used to take hours of time on sales representatives’ desks. The AI systems study the patterns of document interactions to streamline the content structure, propose which sections should be highlighted according to what the previous customers have considered the most valuable, and even change language and level of detail according to customer preferences that were determined through the pattern of previous interactions. The implementation data indicates that conversational AI interfaces with CPQ allow sales teams to spend 40-50% less time on creating quotes and have an accuracy improvement of 85-95% over manual configuration processes indicating that they are not incremental improvements but fundamental changes in the productivity of salespersons. The natural language also makes training of new sales representatives less demanding as they can become more productive faster when they are able to pose questions to the system instead of memorizing product rules and pricing matrices.
- Advanced Visual Configuration and Augmented Reality Integration: The introduction of rich visual configuration and AR integration is one of the significant steps toward the transformation in the customer and sales department experience of product customization, especially in the business of complex, customizable tangible goods. Current CPQ systems are now fitted with 3D visualization engines which are capable of displaying photorealistic portrayals of configured products in real-time so that customers can view precisely what their custom solution will appear like as they make configuration decisions, greatly enhancing buyer confidence and eliminating the problem of post-sale surprises that will lead to returns or cancellations. The automotive, specialty vehicle manufacturing, industrial equipment, architectural products, and consumer goods industries are deploying CPQ systems with augmented reality features that enable customers to see configured products in their real space with the use of smartphone or tablet cameras, which give them spatial context that is not possible with a static image. As an example, a client operating a CPQ portal, which has an AR feature, can point a computer device at their factory floor and see a scaled-up, precisely configured image of the equipment at exactly the point it would be installed, with spatial clearances, openings, and connections with other infrastructure. Visual arrangement techniques can also be used with complicated technical items where the traditional text- or table-based configuration displays have a cognitive load that slows down the sales procedure and makes configuration errors; visual interfaces enable customers to drag and drop components and 3D models to view other facets and get instant visual feedback when making incompatible or sub-optimal selections. The manufacturing firms that have adopted visual CPQ, with the added functionality of AR have recorded 60-70% cuts in configuration errors, 40-50% reductions in post-sale changes, and 15-point higher scores in customer satisfaction with regard to product expectations, which proves that the investment in advanced visualization technology does have quantifiable payoffs. This visual mode of approach also helps in better cooperation between the sales teams and the customers in doing the configuration process because both parties can refer to the same visual representation rather than trying to get to a similar understanding by verbal description or technical specifications that can be understood differently.
- No-Code and Low-Code Configuration Platforms Democratizing CPQ Management: No-codes and low-codes are another important trend in the CPQ market that allows business users to assemble pricing rules, product relations, approval processes, and quote templates without creating software code. The appeal of easy-to-use no-code or low-code CPQ systems keeps rising due to the ability of non-technical staff such as sales operations managers, product managers and finance teams to configure pricing rules and processes in a simple way, saving extreme time and expenses in maintaining and updating CPQ systems. Even simple adjustments to the pricing rules or product settings would have required much involvement of the IT department, which resulted in bottlenecks of business that did not respond to the changes in the market, competitive pressure, or the introduction of new products; no-code systems break these bottlenecks by offering visual rule builders, drag-and-drop workflow designers, and template editors that can be operated without the knowledge of programming languages. In February 2025, a major enterprise provider of software introduced a no-code CPQ system specifically designed to meet the needs of small businesses, enabling more than 5,000 users to create pricing processes without IT support in the first three months, which shows how much organizations have been waiting to have easy access to use CPQ. These systems usually provide templates that cover common pricing situations such as volume discounts, tiered pricing, bundle pricing, promotional pricing and customer-specific contracts so that a business is able to use a complex pricing approach by choosing templates and then configuring them to suit specific needs instead of writing new logic. No-code approach goes all the way to integration configuration, where current offerings include visual integration builders, which tie CPQ systems to CRM, ERP, and other enterprise applications by connecting them with pre-built connectors, which business users configure by field mapping and by choosing synchronization options, without knowing how the underlying API protocols work. Individual organizations that have applied no-code CPQ report that time-to-market with new products has been reduced 50-60%, IT dependency has been reduced 70-80%, and business users take greater control and ownership of their systems, which become nimbler in responding to emerging business needs.
Category Wise Insights
By Deployment Type
Why Cloud-Based Deployment Leads the Market?
The cloud-based deployment will occupy approximately 68% of the market in 2025, and it is the biggest segment. This has been made possible by the fact that cloud-based CPQ solutions have several benefits that include short deployment times, scaling to meet the needs of business expansion, accessibility at all places thereby allowing remote working, automatic updates to access new features and reduced overall cost of ownership as compared to on-premise systems. The forecasts of Gartner indicate that more than 60% of B2B sales organizations will be utilizing cloud CPQ in 2026, which is the result of the speeding up of the shift of older on-premise platforms to new cloud environments. The cloud CPQ systems also do not require much upfront investment in infrastructure since organizations pay subscription fees and do not acquire hardware and software licenses and therefore higher-level CPQ services are available to institutions of all sizes including small and medium-sized businesses that have not been able to afford the cost of capital in order to implement on-premise systems. The fastest growing category is the hybrid deployment segment, which is projected to grow by an average of 18.3% in the next five years (2026-2035) as companies desire to achieve flexibility and scalability of cloud systems against the control and customization of on-premise elements. The typical implementation of hybrid deployments is to store sensitive pricing data, customer data, or proprietary product configurations on-site and to use cloud features to provide user interfaces, team collaboration solutions, and integration with cloud-based CRM and marketing automation products. This method is attractive to organizations that are regulated such as banking, healthcare, and government that have to adhere to data residency or security policies that limit the storage of some information in the open cloud services. Businesses that have also invested heavily in current on-premise infrastructure also fit into hybrid solutions where they wish to modernize over time instead of a full migration of platforms that impact business and necessitate retraining whole sales organizations.
By Application
Why Manufacturing Dominates CPQ Software Applications?
The manufacturing uses will be the biggest market with an approximate market share of 34% in the year 2025. Such leadership epitomizes the inherent complexity of manufactured goods that can have thousands of potential combinations, the complexities of interrelation among elements, individualization needs of the client, and pricing models that need to take into consideration the cost of materials, the intricacy of production, volume savings, and market positioning. Production processes normally create highly configurable products that enable customers to choose among a wide selection of items such as base models, features, accessories, colors, materials, and performance items and generate a product mix that has thousands or millions of possible combinations and is very poorly managed without sophisticated CPQ systems. Such industrial sectors as industrial machinery, automotive, aerospace, electronics, and specialty equipment are heavily dependent on CPQ solutions to ensure that the sales team can build technically viable products that can actually be produced, rather than making expensive mistakes where combinations that are impossible to produce are quoted and then found out during the production planning stage.
The most robust growth is in healthcare and life sciences applications, which are expected to see a CAGR of 17.8% between 2026 and 2035 due to the complexity of healthcare products and services such as medical equipment, diagnostic equipment, pharmaceuticals, and the healthcare IT system that are required to be precisely configured, to have regulatory compliance checked, and to have a pricing structure that serves various payer types, payer reimbursement situations, and volume buying arrangements. The unique issues healthcare organizations have with regard to quoting are the necessity to preserve that configured medical devices are in conformance with regulatory requirements and compatibility standards; complex pricing relations with group purchasing organizations, healthcare systems, and government programs, configuring service agreements such as training, maintenance, and ongoing support, which have a multi-year span, and maintenance of detailed audit trails to use in compliance and reimbursement verification. Healthcare-specific CPQ systems also have compliance checking capabilities, which automatically test setup products against regulations by the FDA, CE marking, or other standards to ensure that sales teams would not offer non-compliant configurations that would expose them to legal and regulatory risk. The shift to value care approaches, bundled payments, and results-based contracts in the healthcare sector has added complexities to pricing, which cannot be effectively managed by manual methods of quoting, leading to a quick pace of CPQ implementation among medical device manufacturers, pharmaceutical firms and healthcare IT vendors.
By Enterprise Size
Why Large Enterprises Dominate the Market?
The greatest segment is the large enterprises which occupy a market share of about 71% in 2025. This is superiority based on the fact that larger organizations tend to have more complex products, large sales forces, worldwide operations, and advanced pricing strategies that produce interesting returns on investment to CPQ implementing organizations. Marketers in large organizations have many channels to sell through such as direct sales forces, value added resellers, distributors and e-commerce websites where CPQ systems need to impose uniform pricing and configuration policies across all channels as well as support channel specific margins, discounts and terms. The size of large enterprise operations leads to proportionally bigger agony exerted by manual quoting, and studies have shown that sales personnel in large organizations invest 20-30% of their time in administrative work on quoting, approving prices, and revisions of quotes that can be completely stopped or severely diminished by CPQ automation.
The market of small and middle-sized business enterprises has been undergoing a faster growth rate with cloud-based CPQ solutions at a subscription price level and with short implementation times, reducing the potential barriers to entry that in the past caused CPQ to be limited only to the large organizations. It is anticipated that micro and small companies will significantly raise the expenditure on CPQ within the next three years as the vendors will provide the way to purchase the right-sized solution, easy feature set, industry templates, and support to implement CPQ within weeks instead of months of operation. The introduction of no-code CPQs with a specific focus on SMEs has especially been active, with solutions allowing companies to adopt advanced quoting options without the need to pay specific IT personnel or external consultants. CPQ adoption in SMEs typically centers around a few core competencies, such as automated price computation, quote documents, simple approval processes, and CRM integration, without the advanced features of large businesses that internal enterprises are interested in but that internal organizations do not need and that complicate implementation.
Report Scope
| Feature of the Report | Details |
| Market Size in 2026 | USD 3.92 billion |
| Projected Market Size in 2035 | USD 10.84 billion |
| Market Size in 2025 | USD 3.49 billion |
| CAGR Growth Rate | 16.5% CAGR |
| Base Year | 2025 |
| Forecast Period | 2026-2035 |
| Key Segment | By Deployment Type, Enterprise Size, Application, Integration Type and Region |
| Report Coverage | Revenue Estimation and Forecast, Company Profile, Competitive Landscape, Growth Factors and Recent Trends |
| Regional Scope | North America, Europe, Asia Pacific, Middle East & Africa, and South & Central America |
| Buying Options | Request tailored purchasing options to fulfil your requirements for research. |
Regional Analysis
How Big is the North America Market Size?
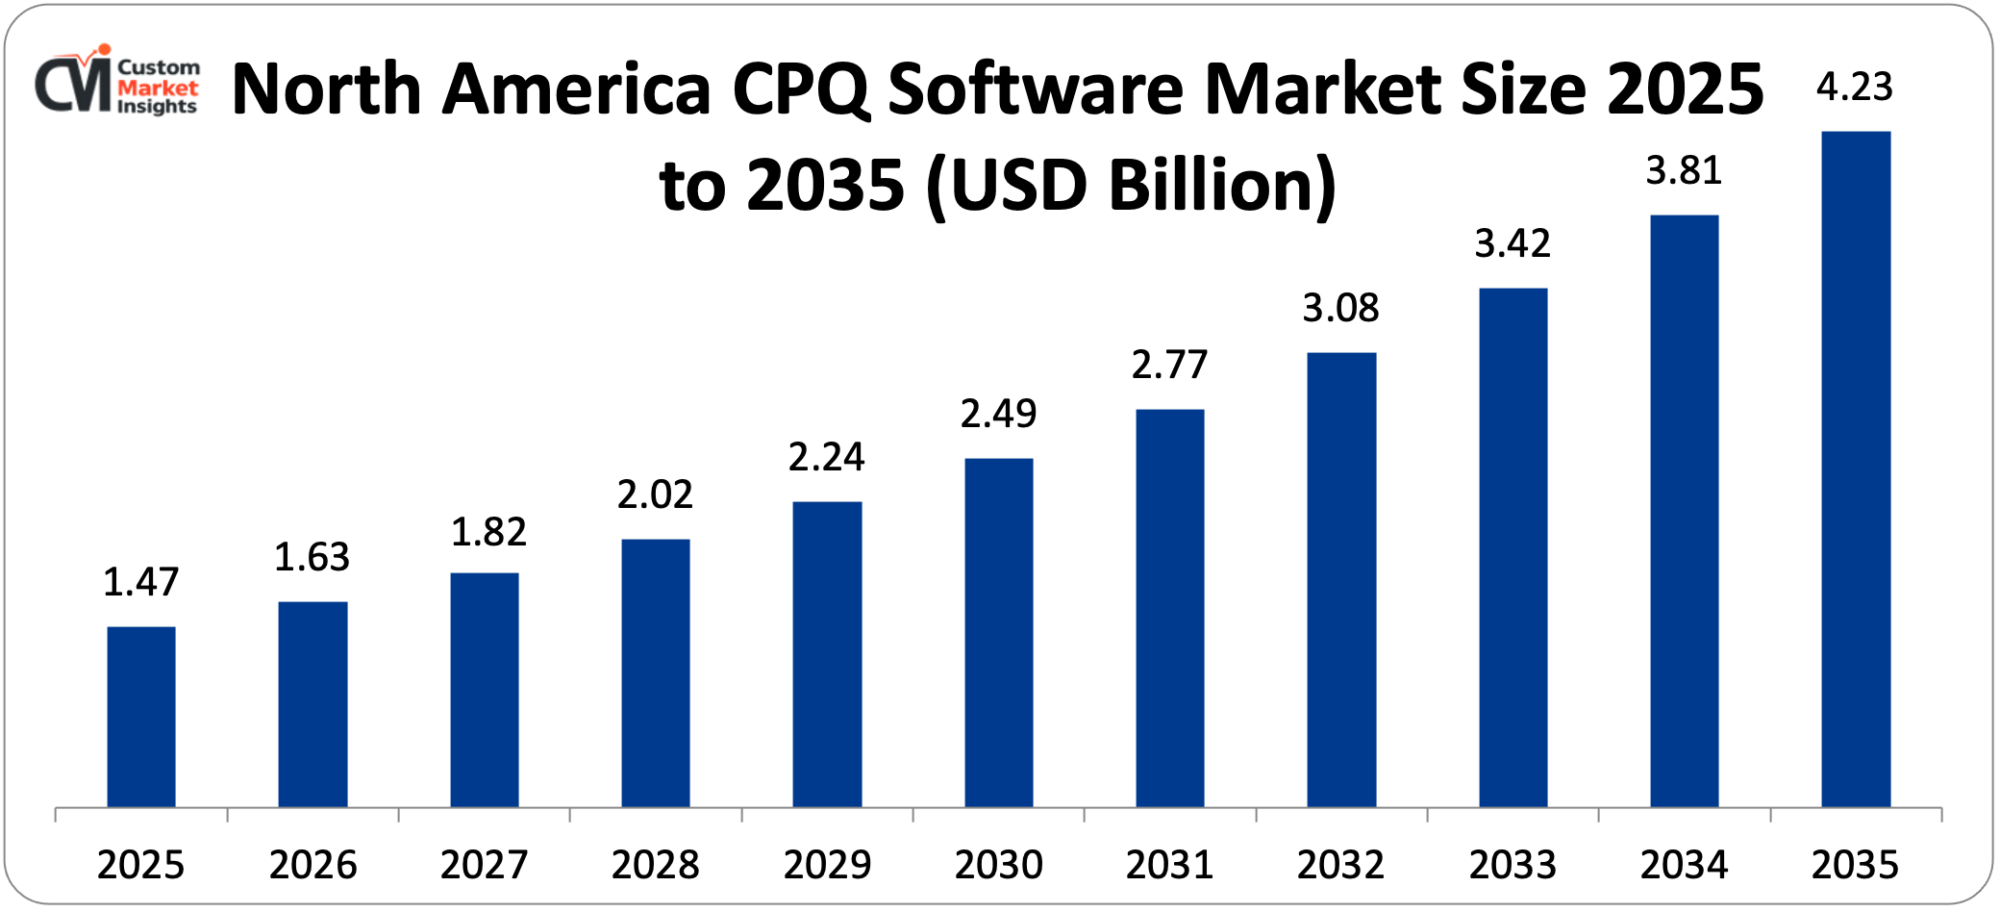
The North America CPQ software market size is estimated at USD 1.47 billion in 2025 and is projected to reach approximately USD 4.23 billion by 2035, with an 11.2% CAGR from 2026 to 2035.
Why did North America Dominate the Market in 2025?
In the global market, North America is the leader with a projected 42% market share in 2025 due to a number of reasons such as the presence of large vendors of CPQ software in the region, early uptake of cloud technologies and digital transformation projects, developed B2B sales markets with highly operationalized revenue functions, substantial investment in sales enablement technology, and established integration of CPQ with other enterprise systems. It has the largest concentration of enterprise software firms and technology innovators actively developing CPQ functionality, forming the ecosystem with the new features and methods being launched in North American markets before moving to other regions of the world. Such large CPQ vendors as Salesforce, Oracle, IBM, and SAP have large research and development activities within the North American markets, which guarantees that the recent advances in AI, machine learning, and cloud architecture are quickly reflected in commercially available CPQs. The adoption of CPQ in the United States is specifically driven by the presence of a large manufacturing base, thriving IT and telecommunications facilities, developed financial services firms, and a mature software-as-a-service economy that has conventionalized the use of cloud-based applications in enterprise.
United States Market Trends
The enormous B2B economy, where complex sales processes prevail in manufacturing, technology, and services; where the dominant technology vendors headquartered in the United States contribute to constant innovation; where high uptake of cloud computing and SaaS applications provides a platform on which cloud CPQ can be developed; where there is high investment in sales enablement and revenue operations technology; and where there is early adoption of AI and machine learning functionality in commercial applications, makes the United States the single largest national market for CPQ software. The U.S. market is one of the most developed ones, with its customers seeking high levels of functionality such as AI-powered pricing suggestions, visual product assembly, omnichannel quoting opportunities, and thorough integration with best-of-breed CRM, ERP, and billing systems. The adoption of CPQ, especially in manufacturing companies within the U.S., has been particularly aggressive, with companies seeking solutions that can support complex product designs; support engineer-to-order and configure-to-order manufacturing designs, integrate with PLM systems, channel partner quoting via partner portal; and have imposed pricing policies and margin requirements.
Why is Asia Pacific Experiencing Rapid Growth?
The rapid digitalization of sales processes in emerging economies, expansion of the manufacturing industry in China, India, and Southeast Asia, increased use of cloud computing and enterprise software, proliferation of product lines by firms, and government policies of digital transformation all in support of enterprise technology adoption all make the Asia Pacific its fastest-growing region with a projected CAGR of 14.2% in 2026-2035, an indicator of rapid digitalization of the sales processes in these emerging economies. The increase in the region is specifically propelled by the development of the manufacturing sector and the nations of China, India, South Korea, and Japan are the key world manufacturing centers where companies are updating their sales to compete in the global markets that demand quick quote turnaround and professional sales. China’s Belt and Road Initiative and infrastructure development projects have generated a level of demand that has never been experienced before and demanded complex industrial equipment, machinery, and construction materials that demand advanced configuration and pricing facilities that CPQ systems offer.
China Market Trends
The largest manufacturing economy in the world with vast production of industrial equipment, electronics, and machinery with high needs for local customization, quick digital transformation efforts in business sectors of the enterprise, increased use of cloud computing and SaaS business models, the rise of local CPQ vendors serving Chinese-speaking markets, and state-level assistance of automation and digital commerce in industries all make China a key growth market with CPQ software. International companies operating in the Chinese marketplace are under pressure to embrace international sales processes such as professional quote generation, and this is influencing the development of CPQ even for the mid-sized companies still using manualized methods of quoting processes. The increased complexity of Chinese B2B e-commerce systems and the addition of CPQ functionality into those systems are developing new distribution channels of CPQ technology to allow it to be adopted by companies of small and medium sizes.
Why is Europe Focusing on Integration and Compliance?
The European customer market is defined by high-level use of enterprise software, strict data protection policies such as GDPR necessitating cautious data protection, a focus on integration between CPQ and current ERP platforms that most European businesses use, current multi-country operations with strong demand on configuration features, and powerful manufacturing industries in Germany, France, and Italy. Europe is a large market, which is especially strong in such industries as automotive, industrial machinery, pharmaceuticals, and specialty chemicals, where complexity in product configuration and regulatory compliance demands powerful CPQ applications. European customers tend to put more emphasis on data sovereignty with a preference to be deployed in options that keep data in EU jurisdiction, strong integration profiles with deployed ERP systems such as SAP, Oracle, and local vendors, feature-oriented compliance features to adhere to the GDPR, VAT, and industry-specific regulations and customization features to support the varied business processes across the different European countries.
Germany Market Trends
The dominance in the manufacturing economy, the concentration of companies producing automotive and industrial machinery, well-established Mittelstand firms aiming to digitalize their traditional sales models, a culture of high engineering, emphasis on precision in product configuration and pricing, and heavy uptake of Industry 4.0 concepts up to sales operations in Germany make Germany the best European market for CPQ software. German manufacturers especially appreciate CPQ connecting with engineering tools such as CAD and PLM software, which ensures sales settings are based on updated product design and manufacturing capacity.
Why is the Middle East & Africa Region Experiencing Growth?
The market growth in the LAMEA region is associated with the infrastructure development and industrial diversification of the countries of the Gulf Cooperation Council, the growth of the manufacturing industries in South Africa and the North African countries, the increased use of technologies and the digital transformation efforts, the development of telecommunications and IT industries that need more complex quotation, and the programs of the governments aimed at the diversification of the economy beyond the traditional resources exploitation. Such countries as the United Arab Emirates, Saudi Arabia and Qatar are spending on infrastructure and digital government programs which involve modernization of the procurement processes, which creates a prospect of CPQ implementation both in the state and the business sector. The development is also aided by the international firms that develop their regional operations, which introduce the global standard sales processes, such as CPQ systems.
Top Players in the Market and Their Offerings
- Salesforce Inc.
- Oracle Corporation
- SAP SE
- IBM Corporation
- Apttus Corporation (Conga)
- Infor Inc.
- PROS Holdings Inc.
- CallidusCloud (SAP)
- DealHub io
- Vendavo Inc.
- Model N Inc.
- ConnectWise Inc.
- Cincom Systems Inc.
- FPX LLC
- Tacton Systems AB
- Others
Key Developments
The market has undergone significant developments as industry participants seek to expand capabilities and enhance product portfolios.
- In March 2023: A major step in AI sales automation Salesforce added Einstein GPT to Revenue Cloud, adding generative AI to its CPQ solution to automate proposal creation, offer intelligent pricing advice, and facilitate natural language interactions, a major development in sales process automation.
- In March 2025: LTIMindtree introduced a no-code CPQ offering targeting small companies and was able to have more than 5,000 customers in the initial three months develop pricing workflows without IT assistance, showing the democratization of CPQ technology to others than the big companies.
These business units have enabled businesses to reinforce market positions, expand product offerings, increase technological competencies, and exploit growth opportunities in the growing market.
The Configure Price and Quote CPQ Software Market is segmented as follows:
By Deployment Type
- Cloud-Based
- On-Premise
- Hybrid
By Enterprise Size
- Large Enterprises
- Small and Medium-Sized Enterprises (SMEs)
By Application
- Manufacturing
- IT and Telecom
- Healthcare and Life Sciences
- BFSI (Banking, Financial Services, and Insurance)
- Retail and E-Commerce
- Automotive
- Other Applications
By Integration Type
- CRM Integration
- ERP Integration
- Billing Integration
Regional Coverage:
North America
- U.S.
- Canada
- Mexico
- Rest of North America
Europe
- Germany
- France
- U.K.
- Russia
- Italy
- Spain
- Netherlands
- Rest of Europe
Asia Pacific
- China
- Japan
- India
- New Zealand
- Australia
- South Korea
- Taiwan
- Rest of Asia Pacific
The Middle East & Africa
- Saudi Arabia
- UAE
- Egypt
- Kuwait
- South Africa
- Rest of the Middle East & Africa
Latin America
- Brazil
- Argentina
- Rest of Latin America
Table of Contents
- Chapter 1. Preface
- 1.1 Report Description and Scope
- 1.2 Research scope
- 1.3 Research methodology
- 1.3.1 Market Research Type
- 1.3.2 Market research methodology
- Chapter 2. Executive Summary
- 2.1 Global Configure Price and Quote CPQ Software Market, (2026 – 2035) (USD Billion)
- 2.2 Global Configure Price and Quote CPQ Software Market: snapshot
- Chapter 3. Global Configure Price and Quote CPQ Software Market – Industry Analysis
- 3.1 Configure Price and Quote CPQ Software Market: Market Dynamics
- 3.2 Market Drivers
- 3.2.1 Accelerating Digital Transformation and Sales Automation Demand Globally
- 3.2.2 Artificial Intelligence and Machine Learning Integration Transforming Pricing Intelligence
- 3.3 Market Restraints
- 3.4 Market Opportunities
- 3.5 Market Challenges
- 3.6 Porter’s Five Forces Analysis
- 3.7 Market Attractiveness Analysis
- 3.7.1 Market attractiveness analysis By Deployment Type
- 3.7.2 Market attractiveness analysis By Enterprise Size
- 3.7.3 Market attractiveness analysis By Application
- 3.7.4 Market attractiveness analysis By Integration Type
- Chapter 4. Global Configure Price and Quote CPQ Software Market- Competitive Landscape
- 4.1 Company market share analysis
- 4.1.1 Global Configure Price and Quote (CPQ) Software Market: company market share, 2025
- 4.2 Strategic development
- 4.2.1 Acquisitions & mergers
- 4.2.2 New Product launches
- 4.2.3 Agreements, partnerships, collaborations, and joint ventures
- 4.2.4 Research and development and Regional expansion
- 4.3 Price trend analysis
- 4.1 Company market share analysis
- Chapter 5. Global Configure Price and Quote CPQ Software Market – Deployment Type Analysis
- 5.1 Global Configure Price and Quote CPQ Software Market overview: By Deployment Type
- 5.1.1 Global Configure Price and Quote CPQ Software Market share, By Deployment Type, 2025 and 2035
- 5.2 Cloud-Based
- 5.2.1 Global Configure Price and Quote CPQ Software Market by Cloud-Based, 2026 – 2035 (USD Billion)
- 5.3 On-Premise
- 5.3.1 Global Configure Price and Quote CPQ Software Market by On-Premise, 2026 – 2035 (USD Billion)
- 5.4 Hybrid
- 5.4.1 Global Configure Price and Quote CPQ Software Market by Hybrid, 2026 – 2035 (USD Billion)
- 5.1 Global Configure Price and Quote CPQ Software Market overview: By Deployment Type
- Chapter 6. Global Configure Price and Quote CPQ Software Market – Enterprise Size Analysis
- 6.1 Global Configure Price and Quote CPQ Software Market overview: By Enterprise Size
- 6.1.1 Global Configure Price and Quote CPQ Software Market share, By Enterprise Size, 2025 and 2035
- 6.2 Large Enterprises
- 6.2.1 Global Configure Price and Quote CPQ Software Market by Large Enterprises, 2026 – 2035 (USD Billion)
- 6.3 Small and Medium-Sized Enterprises (SMEs)
- 6.3.1 Global Configure Price and Quote CPQ Software Market by Small and Medium-Sized Enterprises (SMEs), 2026 – 2035 (USD Billion)
- 6.1 Global Configure Price and Quote CPQ Software Market overview: By Enterprise Size
- Chapter 7. Global Configure Price and Quote CPQ Software Market – Application Analysis
- 7.1 Global Configure Price and Quote CPQ Software Market overview: By Application
- 7.1.1 Global Configure Price and Quote CPQ Software Market share, By Application, 2025 and 2035
- 7.2 Manufacturing
- 7.2.1 Global Configure Price and Quote CPQ Software Market by Manufacturing, 2026 – 2035 (USD Billion)
- 7.3 IT and Telecom
- 7.3.1 Global Configure Price and Quote CPQ Software Market by IT and Telecom, 2026 – 2035 (USD Billion)
- 7.4 Healthcare and Life Sciences
- 7.4.1 Global Configure Price and Quote CPQ Software Market by Healthcare and Life Sciences, 2026 – 2035 (USD Billion)
- 7.5 BFSI (Banking, Financial Services, and Insurance)
- 7.5.1 Global Configure Price and Quote CPQ Software Market by BFSI (Banking, Financial Services, and Insurance), 2026 – 2035 (USD Billion)
- 7.6 Retail and E-Commerce
- 7.6.1 Global Configure Price and Quote CPQ Software Market by Retail and E-Commerce, 2026 – 2035 (USD Billion)
- 7.7 Automotive
- 7.7.1 Global Configure Price and Quote CPQ Software Market by Automotive, 2026 – 2035 (USD Billion)
- 7.8 Other Applications
- 7.8.1 Global Configure Price and Quote CPQ Software Market by Other Applications, 2026 – 2035 (USD Billion)
- 7.1 Global Configure Price and Quote CPQ Software Market overview: By Application
- Chapter 8. Global Configure Price and Quote CPQ Software Market – Integration Type Analysis
- 8.1 Global Configure Price and Quote CPQ Software Market overview: By Integration Type
- 8.1.1 Global Configure Price and Quote CPQ Software Market share, By Integration Type, 2025 and 2035
- 8.2 CRM Integration
- 8.2.1 Global Configure Price and Quote CPQ Software Market by CRM Integration, 2026 – 2035 (USD Billion)
- 8.3 ERP Integration
- 8.3.1 Global Configure Price and Quote CPQ Software Market by ERP Integration, 2026 – 2035 (USD Billion)
- 8.4 Billing Integration
- 8.4.1 Global Configure Price and Quote CPQ Software Market by Billing Integration, 2026 – 2035 (USD Billion)
- 8.1 Global Configure Price and Quote CPQ Software Market overview: By Integration Type
- Chapter 9. Configure Price and Quote CPQ Software Market – Regional Analysis
- 9.1 Global Configure Price and Quote CPQ Software Market Regional Overview
- 9.2 Global Configure Price and Quote CPQ Software Market Share, by Region, 2025 & 2035 (USD Billion)
- 9.3. North America
- 9.3.1 North America Configure Price and Quote CPQ Software Market, 2026 – 2035 (USD Billion)
- 9.3.1.1 North America Configure Price and Quote CPQ Software Market, by Country, 2026 – 2035 (USD Billion)
- 9.3.1 North America Configure Price and Quote CPQ Software Market, 2026 – 2035 (USD Billion)
- 9.4 North America Configure Price and Quote CPQ Software Market, by Deployment Type, 2026 – 2035
- 9.4.1 North America Configure Price and Quote CPQ Software Market, by Deployment Type, 2026 – 2035 (USD Billion)
- 9.5 North America Configure Price and Quote CPQ Software Market, by Enterprise Size, 2026 – 2035
- 9.5.1 North America Configure Price and Quote CPQ Software Market, by Enterprise Size, 2026 – 2035 (USD Billion)
- 9.6 North America Configure Price and Quote CPQ Software Market, by Application, 2026 – 2035
- 9.6.1 North America Configure Price and Quote CPQ Software Market, by Application, 2026 – 2035 (USD Billion)
- 9.7 North America Configure Price and Quote CPQ Software Market, by Integration Type, 2026 – 2035
- 9.7.1 North America Configure Price and Quote CPQ Software Market, by Integration Type, 2026 – 2035 (USD Billion)
- 9.8. Europe
- 9.8.1 Europe Configure Price and Quote CPQ Software Market, 2026 – 2035 (USD Billion)
- 9.8.1.1 Europe Configure Price and Quote CPQ Software Market, by Country, 2026 – 2035 (USD Billion)
- 9.8.1 Europe Configure Price and Quote CPQ Software Market, 2026 – 2035 (USD Billion)
- 9.9 Europe Configure Price and Quote CPQ Software Market, by Deployment Type, 2026 – 2035
- 9.9.1 Europe Configure Price and Quote CPQ Software Market, by Deployment Type, 2026 – 2035 (USD Billion)
- 9.10 Europe Configure Price and Quote CPQ Software Market, by Enterprise Size, 2026 – 2035
- 9.10.1 Europe Configure Price and Quote CPQ Software Market, by Enterprise Size, 2026 – 2035 (USD Billion)
- 9.11 Europe Configure Price and Quote CPQ Software Market, by Application, 2026 – 2035
- 9.11.1 Europe Configure Price and Quote CPQ Software Market, by Application, 2026 – 2035 (USD Billion)
- 9.12 Europe Configure Price and Quote CPQ Software Market, by Integration Type, 2026 – 2035
- 9.12.1 Europe Configure Price and Quote CPQ Software Market, by Integration Type, 2026 – 2035 (USD Billion)
- 9.13. Asia Pacific
- 9.13.1 Asia Pacific Configure Price and Quote CPQ Software Market, 2026 – 2035 (USD Billion)
- 9.13.1.1 Asia Pacific Configure Price and Quote CPQ Software Market, by Country, 2026 – 2035 (USD Billion)
- 9.13.1 Asia Pacific Configure Price and Quote CPQ Software Market, 2026 – 2035 (USD Billion)
- 9.14 Asia Pacific Configure Price and Quote CPQ Software Market, by Deployment Type, 2026 – 2035
- 9.14.1 Asia Pacific Configure Price and Quote CPQ Software Market, by Deployment Type, 2026 – 2035 (USD Billion)
- 9.15 Asia Pacific Configure Price and Quote CPQ Software Market, by Enterprise Size, 2026 – 2035
- 9.15.1 Asia Pacific Configure Price and Quote CPQ Software Market, by Enterprise Size, 2026 – 2035 (USD Billion)
- 9.16 Asia Pacific Configure Price and Quote CPQ Software Market, by Application, 2026 – 2035
- 9.16.1 Asia Pacific Configure Price and Quote CPQ Software Market, by Application, 2026 – 2035 (USD Billion)
- 9.17 Asia Pacific Configure Price and Quote CPQ Software Market, by Integration Type, 2026 – 2035
- 9.17.1 Asia Pacific Configure Price and Quote CPQ Software Market, by Integration Type, 2026 – 2035 (USD Billion)
- 9.18. Latin America
- 9.18.1 Latin America Configure Price and Quote CPQ Software Market, 2026 – 2035 (USD Billion)
- 9.18.1.1 Latin America Configure Price and Quote CPQ Software Market, by Country, 2026 – 2035 (USD Billion)
- 9.18.1 Latin America Configure Price and Quote CPQ Software Market, 2026 – 2035 (USD Billion)
- 9.19 Latin America Configure Price and Quote CPQ Software Market, by Deployment Type, 2026 – 2035
- 9.19.1 Latin America Configure Price and Quote CPQ Software Market, by Deployment Type, 2026 – 2035 (USD Billion)
- 9.20 Latin America Configure Price and Quote CPQ Software Market, by Enterprise Size, 2026 – 2035
- 9.20.1 Latin America Configure Price and Quote CPQ Software Market, by Enterprise Size, 2026 – 2035 (USD Billion)
- 9.21 Latin America Configure Price and Quote CPQ Software Market, by Application, 2026 – 2035
- 9.21.1 Latin America Configure Price and Quote CPQ Software Market, by Application, 2026 – 2035 (USD Billion)
- 9.22 Latin America Configure Price and Quote CPQ Software Market, by Integration Type, 2026 – 2035
- 9.22.1 Latin America Configure Price and Quote CPQ Software Market, by Integration Type, 2026 – 2035 (USD Billion)
- 9.23. The Middle-East and Africa
- 9.23.1 The Middle-East and Africa Configure Price and Quote CPQ Software Market, 2026 – 2035 (USD Billion)
- 9.23.1.1 The Middle-East and Africa Configure Price and Quote CPQ Software Market, by Country, 2026 – 2035 (USD Billion)
- 9.23.1 The Middle-East and Africa Configure Price and Quote CPQ Software Market, 2026 – 2035 (USD Billion)
- 9.24 The Middle-East and Africa Configure Price and Quote CPQ Software Market, by Deployment Type, 2026 – 2035
- 9.24.1 The Middle-East and Africa Configure Price and Quote CPQ Software Market, by Deployment Type, 2026 – 2035 (USD Billion)
- 9.25 The Middle-East and Africa Configure Price and Quote CPQ Software Market, by Enterprise Size, 2026 – 2035
- 9.25.1 The Middle-East and Africa Configure Price and Quote CPQ Software Market, by Enterprise Size, 2026 – 2035 (USD Billion)
- 9.26 The Middle-East and Africa Configure Price and Quote CPQ Software Market, by Application, 2026 – 2035
- 9.26.1 The Middle-East and Africa Configure Price and Quote CPQ Software Market, by Application, 2026 – 2035 (USD Billion)
- 9.27 The Middle-East and Africa Configure Price and Quote CPQ Software Market, by Integration Type, 2026 – 2035
- 9.27.1 The Middle-East and Africa Configure Price and Quote CPQ Software Market, by Integration Type, 2026 – 2035 (USD Billion)
- Chapter 10. Company Profiles
- 10.1 Salesforce Inc.
- 10.1.1 Overview
- 10.1.2 Financials
- 10.1.3 Product Portfolio
- 10.1.4 Business Strategy
- 10.1.5 Recent Developments
- 10.2 Oracle Corporation
- 10.2.1 Overview
- 10.2.2 Financials
- 10.2.3 Product Portfolio
- 10.2.4 Business Strategy
- 10.2.5 Recent Developments
- 10.3 SAP SE
- 10.3.1 Overview
- 10.3.2 Financials
- 10.3.3 Product Portfolio
- 10.3.4 Business Strategy
- 10.3.5 Recent Developments
- 10.4 IBM Corporation
- 10.4.1 Overview
- 10.4.2 Financials
- 10.4.3 Product Portfolio
- 10.4.4 Business Strategy
- 10.4.5 Recent Developments
- 10.5 Apttus Corporation (Conga)
- 10.5.1 Overview
- 10.5.2 Financials
- 10.5.3 Product Portfolio
- 10.5.4 Business Strategy
- 10.5.5 Recent Developments
- 10.6 Infor Inc.
- 10.6.1 Overview
- 10.6.2 Financials
- 10.6.3 Product Portfolio
- 10.6.4 Business Strategy
- 10.6.5 Recent Developments
- 10.7 PROS Holdings Inc.
- 10.7.1 Overview
- 10.7.2 Financials
- 10.7.3 Product Portfolio
- 10.7.4 Business Strategy
- 10.7.5 Recent Developments
- 10.8 CallidusCloud (SAP)
- 10.8.1 Overview
- 10.8.2 Financials
- 10.8.3 Product Portfolio
- 10.8.4 Business Strategy
- 10.8.5 Recent Developments
- 10.9 DealHub io
- 10.9.1 Overview
- 10.9.2 Financials
- 10.9.3 Product Portfolio
- 10.9.4 Business Strategy
- 10.9.5 Recent Developments
- 10.10 Vendavo Inc.
- 10.10.1 Overview
- 10.10.2 Financials
- 10.10.3 Product Portfolio
- 10.10.4 Business Strategy
- 10.10.5 Recent Developments
- 10.11 Model N Inc.
- 10.11.1 Overview
- 10.11.2 Financials
- 10.11.3 Product Portfolio
- 10.11.4 Business Strategy
- 10.11.5 Recent Developments
- 10.12 ConnectWise Inc.
- 10.12.1 Overview
- 10.12.2 Financials
- 10.12.3 Product Portfolio
- 10.12.4 Business Strategy
- 10.12.5 Recent Developments
- 10.13 Cincom Systems Inc.
- 10.13.1 Overview
- 10.13.2 Financials
- 10.13.3 Product Portfolio
- 10.13.4 Business Strategy
- 10.13.5 Recent Developments
- 10.14 FPX LLC
- 10.14.1 Overview
- 10.14.2 Financials
- 10.14.3 Product Portfolio
- 10.14.4 Business Strategy
- 10.14.5 Recent Developments
- 10.15 Tacton Systems AB
- 10.15.1 Overview
- 10.15.2 Financials
- 10.15.3 Product Portfolio
- 10.15.4 Business Strategy
- 10.15.5 Recent Developments
- 10.16 Others.
- 10.16.1 Overview
- 10.16.2 Financials
- 10.16.3 Product Portfolio
- 10.16.4 Business Strategy
- 10.16.5 Recent Developments
- 10.1 Salesforce Inc.
List Of Figures
Figures No 1 to 33
List Of Tables
Tables No 1 to 102
FAQs
The key players in the market are Salesforce Inc., Oracle Corporation, SAP SE, IBM Corporation, Apttus Corporation (Conga), Infor Inc., PROS Holdings Inc., CallidusCloud (SAP), DealHub io, Vendavo Inc., Model N Inc., ConnectWise Inc., Cincom Systems Inc., FPX LLC, Tacton Systems AB, Others.
The government regulation has a great effect on the CPQ market by providing data privacy requirements such as GDPR in Europe and equivalent regulations in other jurisdictions requiring businesses to manage customer and pricing data and standardizing product safety and certification requirements which CPQ systems would need to verify during the configuration phase, creating compliance verification requirements especially in regulated markets such as healthcare, financial services and government contracting where quotes are required to document compliance with specific requirements, creating digital transformation programs which provide incentives or requirements to businesses to modernize sales operations. Rules also indirectly affect the adoption of CPQ in raising the complexity of products with safety regulations, environmental regulations, and certification requirements that make manual quoting less practical.
The prices of the CPQ software are very different depending on the type of deployment, the size of the company, the set of features, and the integration needs. Cloud-based solutions are normally priced at USD 75-150 per user per month depending on the basic plans and USD 300 and above per user per month depending on the enterprise editions with advanced features, whereas on-premise solutions are associated with huge initial costs of USD 500,000 to USD 2 million or more, including software, implementation, customization, and infrastructure. With such costs, the payback is significant, with average payback periods of 12-18 months realized by enhancement in sales productivity of 20-30%, improvements in the quote-to-cash cycle of 30-50%, reductions in pricing errors and margin decay, and enhancements in deal size of up to 20% with intelligent recommendations on cross-selling and upselling. The appearance of no-code solutions and SME-oriented solutions at lower prices and shorter implementation times is widening the range of companies that can be served to include smaller companies that could not afford CPQ investments before.
As of the current analysis, the market is projected to reach up to USD 10.84 billion by 2035 with a strong growth rate of 16.5% CAGR, 2026-2035, as the ongoing digital transformation efforts in industries, the integration of AI and machine learning to provide intelligent pricing and configuration operations, an expansion of subscription and use-based business models that demand a complex quoting system, the continued adoption of small and medium-sized businesses as cloud solutions reduce entry barriers, and the growing complexity of B2B sales necessitate automation.
With an estimated 42% in the global market, North America will remain a dominant force, in large part due to the presence of major CPQ software vendors and technology innovators in the region, an early adoption of cloud technologies and digital transformation efforts, well-developed B2B sales markets with advanced revenue operations requirements, and the presence of key industries such as manufacturing, technology, healthcare, and financial services with a continuous need for advanced CPQ capabilities.
The Asia-Pacific region will show the fastest CAGR of 14.2% in the 2026-2035 period, with a fast-growing manufacturing sector in China, India, and Southeast Asia, with accelerated digital transformation programs across the emerging economies; with higher use of the cloud computing industry with government support of technology infrastructure; with more complex B2B sales as regional companies globalize their business capabilities; and the increasing number of domestic CPQ vendors serving the domestic markets with localized solutions to the local business practices and languages.
The Global CPQ Software Market is seen to experience impressive growth due to the accelerating digital transformation, whereby IDC projects 19.3% CAGR CPQ market growth between 2021 and 2026; the integration of artificial intelligence, whereby 78% of AI-using sales teams report reduced sales cycles; cloud-based implementation that is set to benefit from an increased number of B2B organizations using cloud CPQ by 2026, the complexity of modern pricing with subscription-based and usage-based models; and the fact that a sales representative needs automation of the sales.