Digital Marketing Analytics (DMA) Market Size, Trends and Insights By Solution (Web Analytics, Social Media Analytics, Email Marketing Analytics, Mobile Analytics, Marketing Automation Analytics, Content Marketing Analytics, SEO and SEM Analytics, Video Analytics), By Deployment Mode (Cloud-based, On-premise, Hybrid), By Organization Size (Large Enterprises, Small and Medium Enterprises), By Application (Customer Acquisition, Customer Retention, Lead Generation, Campaign Management, Personalization, Market Research, Competitive Intelligence, Other Applications), By End-User Industry (Retail and E-commerce, BFSI (Banking, Financial Services, Insurance), Media and Entertainment, Healthcare, Technology and Software, Travel and Hospitality, Telecommunications, Automotive, Other Industries), and By Region - Global Industry Overview, Statistical Data, Competitive Analysis, Share, Outlook, and Forecast 2026 – 2035
Report Snapshot
CAGR: 11.89%
| Study Period: | 2026-2035 |
| Fastest Growing Market: | Asia Pacific |
| Largest Market: | North America |
Major Players
- Adobe Inc.
- Salesforce Inc.
- Oracle Corporation
- IBM Corporation
- Others
Reports Description
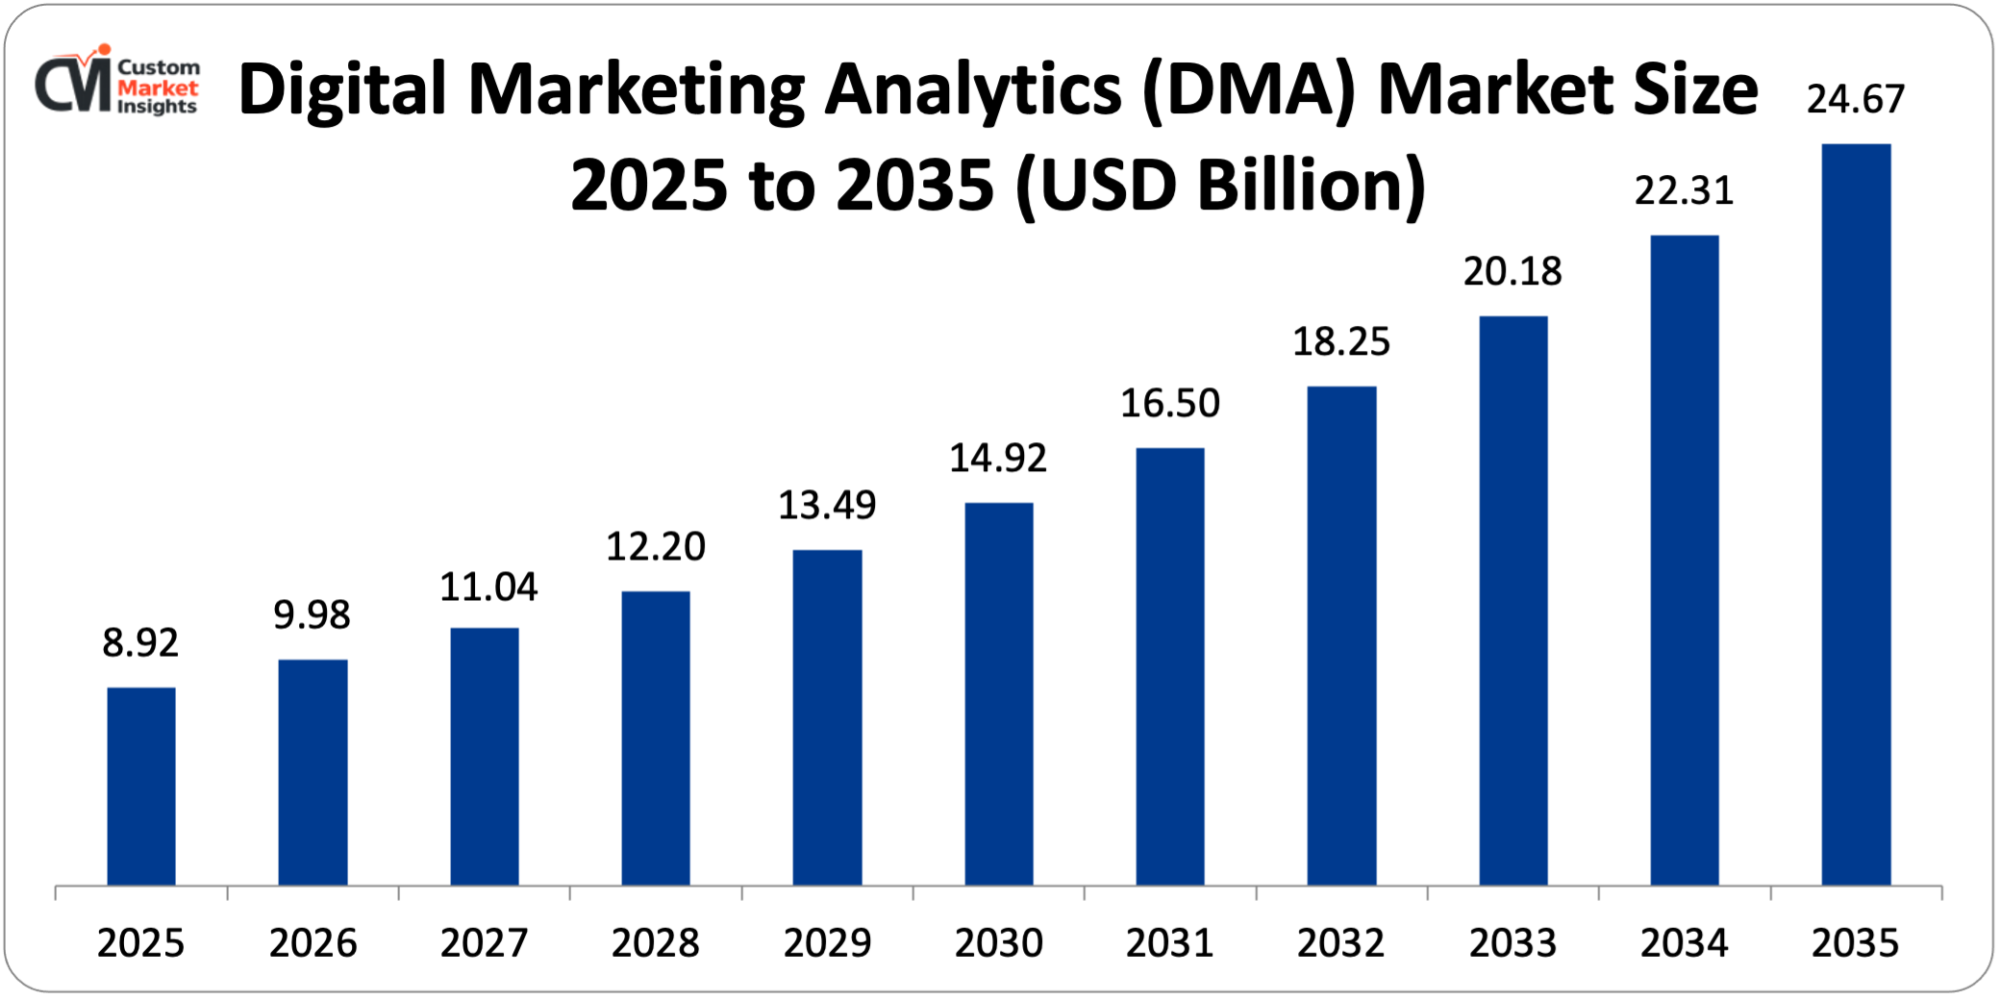
Market size of the global Digital Marketing Analytics (DMA) is projected to be USD 8.92 billion in 2025 and it is projected that market size will increase to USD 9.98 billion in 2026, and to approximately USD 24.67 billion in 2035 at an annual CAGR of 11.89% between the years 2026 and 2035.
The market is expanding as a result of the exponential growth in spending on digital advertising (projected to grow to USD 870 billion worldwide by 2027), the spread of digital customer touchpoints (via web, mobile, social media and new digital channels) now creating sophisticated customer journey requirements necessitating advanced analytics, the growing competition in the marketplace to capture consumer attention, the growth of artificial intelligence and machine learning to provide predictive analytics and automated optimization, and the growing regulatory requirements of marketing attribution and customer data protection creating demand on compliant analytics infrastructure.
Market Highlight
- North America was the strongest Digital Marketing Analytics market in 2025 with a market share of 40%.
- Asia Pacific will increase by 14.2% in the period between 2026 and 2035.
- By type of solution, the web analytics segment had acquired 32% of the market share in 2025.
- Solution, marketing automation analytics segment will record the largest CAGR of 13.5% between 2026 and 2035.
- End-user industry-wise, the biggest market share of 29% will be in the retail and e-commerce segment in 2025, and the healthcare segment has the highest CAGR of 13.8% within the span of projection, 2026-35.
- Organization size: 64% of the market share in 2025 was occupied by the large enterprises segment.
- In 2024, analytics and measurement solutions accounted for 38.5% of the total market of the entire global marketing technology.
Key Trends & Drivers
The Digital Marketing Analytics (DMA) Market Trends present significant growth opportunities due to several factors:
- Explosive Growth in Digital Advertising Investment and Channel Proliferation: The increasing movement of marketing budgets towards digital platforms rather than traditional ones has seen the creation of unprecedented demand on the solutions of analytics that can be used to gauge efficiency, streamline the campaigns and illustrate the return on investment in more and more multi-channel ecosystems. Dentsu statistics show that in 2024, USD 667 billion was spent digitally on advertising annually, which is 60.5% of all advertising expenditure, as compared to the 35.2% spent on advertising in the same year, and is projected to continue growing to 70% of all advertising spending by 2027 to more than USD 870 billion annually. USD 298 billion was the largest amount spent on digital advertisements in 2024, with China following at USD 167 billion and the United Kingdom at USD 35 billion, with programmatic advertisement making up 72% of digital display advertisement spending, based on eMarketer research. The Gartner CMO Survey suggests that the average enterprise currently operates marketing activities in 15-20 channels, which can be digital, such as owned properties, such as websites and mobile applications; paid channels, such as search advertising, display advertising, social media advertising, and video platforms; earned media, such as social engagement and influencer alliances; and emerging channels, such as connected TV (CTV), digital out-of-home (DOOH), and retail media networks. The nature of customer journeys has grown exponentially with studies by Google and Boston Consulting Group revealing that customers are now touching brands at 20 touchpoints on average before making purchase decisions, compared to 5 touchpoints 10 years ago, necessitating the level of attribution analytics to identify the contribution of each of these touchpoints. Only social media advertising has reached USD 207 billion worldwide in 2024 with 4.95 billion active social media users and search advertising USD 279 billion annually with Google Ads revenue of USD 237.9 billion. The emergence of retail media networks where Amazon Advertising has reached USD 47.1 billion, Walmart Connect USD 3.4 billion, and new networks that are being built by Target, CVS, and other retailers are providing new advertisement channels that demand specialized analytics capabilities. The mobile advertising growth is still strong since 73% of the digital advertisement expenditure, or USD 487 billion, will be allocated to mobile channels by 2024 due to smartphone penetration of 6.9 billion devices worldwide and an average of 4 hours 37 minutes of mobile use per day, as per App Annie statistics. Video adverts, especially on websites such as YouTube (2.7 billion monthly users), TikTok (1.7 billion users), and connected TV services, are projected to raise USD 132 billion in 2024 and the performance of video advertisements is measured by advanced view-through attribution and brand lift research. This disaggregation of the advertising inventory on thousands of websites, apps, and platforms poses measurement problems, and header bidding as well as programmatic marketplaces that handle 200+ billion ad impressions every day create a need to employ real time analytics to help optimize bid strategies and prevent ad fraud, as estimated by USD 81 billion per year.
- Artificial Intelligence and Machine Learning Revolution in Marketing: By implementing sophisticated artificial intelligence and machine learning functions into marketing analytics systems, this is a core revolution that facilitates predictive intelligence, automatic optimization, and a personalized customer experience at scale that was previously unattainable under the old paradigm of analytics. Marketing analytics platforms powered by AI currently process billions of customer engagements per day to detect patterns and behaviors and automatically optimize campaigns, and the most successful, including Google Analytics 4, are based on machine learning which sews together gaps in data with cookie limitations and predicts the likelihood of conversion of unidentified users. Predictive analytics capabilities help marketers make 85-90% predictions on customer lifetime value, anticipate customers at risk of churning within 30-60 days so that they can then launch retention efforts, and predict the time and channel of individual customer communications to improve engagement rates by 40-60%. NLP A marketing analytics application of sentiment analysis that processes millions of social media posts, reviews, and customer feedback messages to determine brand perception in real-time, chatbot interaction analysis which extracts insights from 100+ billion customer service conversations each year, and automated report generation which builds natural language summaries of campaign performance are all applications of natural language processing. Computer vision technologies are used to study the performance of visual content in such platforms as Instagram (2.4 billion users), Pinterest (498 million users), and TikTok, where the most popular pictures of products, video thumbnails, and other creative elements are promoted, and such solutions as Google Vision AI and Amazon Rekognition process billions of images every month. Collaborative filtering as well as deep learning-based recommendation engines contribute to 35% of Amazon and 75% of Netflix viewing as well as the 150-300 average conversion rate increase by retailers using AI-driven product recommendations. Machine learning-enhanced marketing mix modeling (MMM) determines the impact of all marketing and external variables on the business results, and current platforms can compute 50+ variables, whereas standard MMM models need a weekly update instead of quarterly as the traditional models did. Reinforcement learning algorithms that optimize real-time bids live are running programmatic advertising campaigns 200 billion bid requests a day to adjust the bid within less than 100 milliseconds based on the predicted conversion probability, competitive environment, and budget pacing to maximize the campaign ROI. Machine learning-based attribution models examine billions of customer journey touchpoints to credit marketing efforts, and according to Google internal data, algorithmic attribution models are 35-40% more accurate than rule-based attribution. Adobe boasts that their AI platform Sensei is running 18 trillion data transactions every year and 55 billion predictions every day and is used to drive functions such as automated audience segmentation which helps identify 10,000+ micro-segments of customer bases, content performance predictions which help predict which creative will be the most effective prior to the launch of a campaign, and anomaly detection which can automatically identify unusual campaign performance that needs to be investigated.
What are the Major Advances Changing the Digital Marketing Analytics Market Today
- Privacy-First Analytics and Cookieless Measurement Solutions: Google Chrome Removing 3rd-party cookies in 2025 (63/70) of all web browser usage and the App Tracking Transparency framework implemented by Apple (70/24) has meant that the core of digital marketing measurement needs to be radically changed to require new privacy-friendly signal measurement methods. The 2.5 billion Chrome users worldwide: The depreciation of third-party cookies will remove cross-site tracking which the IAB estimates accounted for USD 395 billion in programmatic advertising, compelling the industry to invent alternative identity and measurement methods. Apple’s ATT framework in iOS 14.5 made the IDFA (Identifier for Advertisers) up to 25% less than the 70% in the IDFA that was available before, in Flurry Analytics evidence, to 1.8 billion iPhone users in 2022 alone and affected advertising effectiveness measurement, as it decreased the number of users who can enable tracking to 25% of those who choose to do so in iOS 14.5, i.e., 25% of the iOS users who can also be tracked. Server-side tracking has become an important solution and applications such as Google Tag Manager Server-side and Segment employ first-party data collection, where data is transmitted by company servers but not client browsers, which enhances data accuracy (by 25-40% based on industry standards) and does not violate privacy regulations. The customer data strategy has taken center stage, and 88% of marketers surveyed by Twilio Segment see first-party data as their most valuable asset, which has led to investment in customer data platforms (CDP) that integrate CRM systems, e-commerce, mobile applications, and customer service data to build a full customer profile and avoid third-party identifiers. The Privacy Sandbox initiative by Google proposes privacy-friendly APIs such as Topics API for interest-based advertising, FLEDGE for remarketing, and Attribution Reporting API for measuring conversions, with initial testing showing that 95% of the conversion performance could be preserved relative to cookie-based solutions, based on the Google Chrome team statistics. Contextual advertising is undergoing a revival with expenditure amounting to USD 376 billion by 2027 based on Insider Intelligence. advertisers are moving beyond behavioral targeting to content-based targeting which evaluates page content, user intent indicators and semantic relationships without tracking a specific user across web sites. The techniques of differential privacy which are being adopted by large platforms such as Apple and Google introduce statistical noise to analytics data to ensure that individual users are not identified, although aggregate accuracy is retained, and conversion attribution is available with a 24-48 hour delay and limited data (3 bits) instead of the full unlimited coverage offered by tracking cookies. Identity solutions such as the Trade Desk UID2.0, LiveRamp RampID and ID5 universal ID develop cross-platform identity systems built on authenticated user identities with express consent and available on 300+ programmatic advertising technology platforms as per trade desk figures. Marketing mix modelling (MMM) is regaining its momentum with cookie depreciation constraining granular digital attribution, and contemporary MMM systems are based on Bayesian statistics and machine learning to understand macro-level marketing contribution and give strategic guidance when micro-level attribution becomes infeasible.
- Real-Time Analytics and Instant Optimization Capabilities: The transformation of batch-run historical reporting to streaming analytics that provide real-time analytics and allow marketers to make immediate decisions and automated optimization is a radical change in the functioning of the modern platform, as billions of events are processed every second, and automated actions are taken within milliseconds of opportunity identification or problem detection. Google analytics 4, Adobe analytics and Mixpanel are real time analytics platforms that analyze streams of events in real time using technologies such as Apache Kafka, Flink, and Google cloud Pub sub instead of the 24-48 hour lag in traditional analytics systems. The e-commerce websites that accommodate the Black Friday and Cyber Monday traffic have analytics systems that monitor the stock quantities, conversion percentages, page loading times, and success rates in payment transactions in real-time, allowing quick resolution of problems that will cost millions of dollars in revenue. Decisions to personalize the content of the webpage, product suggestions, and promotional offers made by real-time personalization engines require less than 50 milliseconds of customer behavior signal, demographic information, and predictive model processing, and the Amazon recommendation engine manages 350 million items versus 300 million customer profiles 20+ times a second. Paid search engines use automated bidding to make 15 billion bid adjustments each day based on Google Ads data to optimize bids in real-time, based on factors such as device type, location, time of day, competitor activity, and the likelihood of conversion, to better optimize performance of the campaign. Journey orchestration software such as Salesforce Marketing Cloud and Adobe Journey Optimizer can send personalized messages in seconds following customer activities or inactivity, and systems use 100 million+ decision triggers per hour. Live campaign monitoring: Marketers are alerted in minutes when a campaign is overperforming or underperforming benchmarks, when the creative has become fatigued and is losing its appeal, or when technical problems are affecting the monitoring and are responding quickly to prevent wasting budgets. Real time competitive intelligence systems monitor competitors’ advertising campaigns, pricing adjustments, and promotional campaigns on an hourly basis thereby providing a marketer with intelligence to respond dynamically to their rivals based on the prevailing market circumstances. Event-driven architectures can support detailed automated workflows in which the behavior of customers can stimulate immediate analytics processing and marketing responses, including abandoned cart recovery emails dispatched within 1 hour with 15-20% conversion rates versus 3-5% conversion rates with 24-hour delays, as Barilliance research indicates.
- Cross-Channel Attribution and Unified Customer Journey Analytics: The increasing marketing touchpoints in 15-20+ channels have necessitated comprehending the complexity of the customer journey and precise attribution of conversions to marketing efforts as a paramount challenge that has created a need to deploy advanced multi-touch attribution and journey analytics solutions that offer a holistic perspective on marketing performance. The traditional last-click attribution that attributes the last touchpoint before conversion does not acknowledge the 19 other average interactions that shape the purchase decision leading to systematic undervaluation of the upper-funnel awareness activities and overvaluation of the lower-funnel conversion tactics based on Attribution research by Google. Multi-touch attribution (MTA) models such as time decay, position-based, and algorithmic assign credit to conversion touchpoints of the customer journey, and data-driven attribution is a method to assign credit that uses machine learning to designate the most effective allocation of credit to improve marketing ROI by 15-30% (Nielsen studies). Criteo research of 65% of customer journeys indicates that users initiate product research on mobile on their commutes, carry it over to work computers, and make purchases on home tablets or desktops, and they need solutions that identify an individual across devices without infringing privacy. Marketing data warehouses aggregate data on 20-50+ marketing platforms, CRM systems, e-commerce platforms, and customer service tools into central databases allowing in-depth journey analysis, with systems like Snowflake, Google BigQuery, and Amazon Redshift scaling their use to petabytes of marketing data on behalf of enterprise clients. Customer Data Platforms (CDP) are USD 4.8 billion markets in 2024 that grow by 34% CAGR, according to CDP Institute, which consolidate customer data of every type to create an impressive single source of truth to deliver consistent analytics and activation across channels with leading CDPs handling billions of customer events per day. Sankey diagrams and flowcharts generated using journey mapping visualisation tools show the flow of customers across touchpoints, the high-value routes, the points of friction that lead to abandonment, and the areas of optimisation, and Amplitude reports customers using journey analytics improve conversion rates by 20%. Cross-channel campaign measurement allows marketers to assess effectiveness across channels to consider channel differences in attribution window, type of conversion, and audience overlap that allow marketers to optimize budget allocation across search (USD 279B/year), social (USD 207B/year), display (USD 189B/year), and video (USD 132B/year) based on channel-specific data on spending. True causal impact The true impact of marketing activities is measured through incrementality testing based on geo-holdout experiments and synthetic control groups and overcomes the attribution problems of correlation not causation.
- Integration of Marketing Analytics with Business Intelligence and Revenue Operations: As marketing analytics converges with wider business intelligence, sales analytics and revenue operations, it will result in end-to-end capacity of revenue attribution and predictive modeling that provides a direct relationship between marketing operations and business results such as revenue, profitability and customer lifetime value. The growing revenue responsibility of marketing, seen by the fact that 72% of CMOs are now measured on revenue contribution, compared to 38% in 2018, by the Gartner CMO Survey, requires the use of an analytics platform to bridge the linkage of marketing activities to close deals and recurring revenue via the entire lifecycle of the customer. Revenue attribution models follow the customer journey starting with the anonymous visitor of the website, all the way to marketing qualified lead (MQL), sales accepted lead (SAL), sales qualified opportunity (SQL), closed-won customer and expansion revenue, and offer visibility of marketing contribution throughout 6-12 month B2B sales cycles of enterprise software and complex solution sales. The role of marketing in the pipeline with B2B companies which source 45-55% of qualified leads in marketing activity based on SiriusDecisions research necessitates advanced lead scoring models based on 50 or more behavioral and firmographic indicators to identify the likelihood of conversion and rank a sales follow-up. Customer lifetime value (LTV) models embodied into marketing systems provide the ability to optimize on long-term value, rather than initial customer acquisition cost, which is especially important in the case of subscription businesses which have a high initial customer acquisition cost but generate profit in the long term of 3-5 years of customer retention. The evolution of marketing efficiency indices, replacing cost-per-click and cost-per-acquisition with customer acquisition cost (CAC) payback period, LTV:CAC ratio, and revenue contribution reflect rising sophistication, with best-in-class B2B SaaS companies having LTV:CAC practices that are not less than 3.0, and CAC payback of less than 12 months.
Category Wise Insights
By Solution
Why Web Analytics Lead the Market?
Web analytics that will occupy an approximate market share of 32% will constitute the largest segment in 2025. This is due to the root status of websites as the primary digital presence of 97% of businesses based on a Clutch survey and the huge volumes of web traffic with 5.3 billion internet users driving 4.66 billion Google searches and 1.9 billion website visits respectively. Web analytics platforms monitor 100+ metrics such as sessions, pageviews, bounce rates, conversion rates, and user flows, and the platform gives a holistic insight into visitor interaction with websites and optimization opportunities to increase conversion rates by an average of 20-30%. Online transactions constituted 21.2% of retail sales and all of the world’s 24 million e-commerce stores and online transactions have web analytics as their essential infrastructure to monitor product views, cart additions, checkout abandonment, revenue attribution, and cart additions, as per eMarketer, the global e-commerce market reached USD 6.3 trillion in 2024.
The highest CAGR in marketing automation analytics between 2026 and 2035 is attributed to the booming growth of the marketing automation platform, the market worth USD 8.42 billion in 2024 with a 19.6% CAGR, the growing sophistication of the multi-channel automated campaign, the transition to account-based marketing where 94% of marketers B2B have ABM strategies, the need for performance analytics because of the complexity of the multi-channel automated campaign, and the need to have comprehensive analytics feedback loops as a The daily volume of automated email messages dispatched by marketing automation platforms is 6.5 billion, the number of automated personalized experiences triggered on the websites is 2.8 billion, and the number of multi-touch nurture campaigns executed using marketing automation is in the billions, which creates enormous analytics demands to maximize campaign performance, and marketing automation users have reported a 451% improvement in qualified leads.
By End-User Industry
Why Retail and E-commerce Dominate DMA Applications?
The largest segment will be the retail and e-commerce applications, which will be estimated at 29% in 2025. This leadership is indicative of the digital-first nature of the industry with 24 million e-commerce stores worldwide and USD 6.3 trillion in online sales representing 21.2% of total retail in the eMarketer data, the high competition among online buyers with average e-commerce conversion rates of 2-3% generating enormous optimization opportunities, the complicated customer experiences with 20 touchpoints on average before purchase able to directly measure the marketing ROI by using transaction data. Amazon itself can generate USD 575 billion of yearly revenues and Alibaba manages USD 1.3 trillion of gross merchandise value as 1.4 billion active consumers visit its platform monthly and need the support of petabyte-scale analytics infrastructure. The multi-channel analytics needed to maximize the budgets, the average e-commerce company uses 15+ marketing channels such as paid search (28% of traffic), organic search (23%), direct navigation (17%), social media (8%), email (7%), and display advertising (5%), as Wolfgang Digital E-commerce KPI Report.
The healthcare segment is also recording the largest CAGR of 13.8% between 2026 and 2035 because of the digitalization of healthcare with telehealth adoption rising to 46% in 2024 compared to 11% pre-pandemic as per a McKinsey study; the increasing direct-to-consumer healthcare marketing with pharmaceutical digital spending expanding to USD 14.8 billion/year; patient acquisition marketing by healthcare practitioners with 4.2 million annual Medicare Advantage enrollees as competition, and the H The special issues affecting healthcare organizations are long average patient decision-making periods of 91 days, a complicated attribution process across multiple providers and insurance issues, and the strict privacy requirements that do not allow tracking third parties, which makes them seek specific healthcare marketing analytics solutions.
By Organization Size
Why Large Enterprises Dominate the Market?
In 2025, the largest segment is large enterprises which occupy a market share of some 64%. This leadership is indicative of the huge marketing budgets of Fortune 500 corporations that spend an average of USD 250-500 million/year on advertising, the complexity of global operations managing 50-100+ brands in 150+ countries that drive marketing optimization, the sophistication of marketing operations (on average, 91 marketing technology tools are used by enterprises as Chiefmartec research reports), and the size of internal analytics teams that on average employ 20-100 data scientists and analysts in services dedicated to marketing optimization. Big data is produced by large companies that process billions of customer interactions, websites that serve 100+ million users every month, or communities with over 10 million followers that make use of analytics that are able to scale to petabyte volumes of data.
Small and medium enterprise (SME) segment with 36% of market share is growing with a 12.5% CAGR as cloud-based analytics platforms make advanced capabilities more accessible with solutions such as Google Analytics 4 free tier serving 30 million SME websites, HubSpot Marketing Hub with plans starting at USD 800 monthly, and niche services such as Mixpanel with freemium offerings. SMEs are paying growing attention to analytics significance with the Salesforce Small Business Trends Report revealing 68% identify data-driven marketing as a competitive priority but have difficulty in meeting budget constraints with average USD 10,000-50,000 monthly marketing expenditures and limited teams of 1-5 marketers necessitating an easy-to-use platform with few technical needs.
Report Scope
| Feature of the Report | Details |
| Market Size in 2026 | USD 9.98 billion |
| Projected Market Size in 2035 | USD 24.67 billion |
| Market Size in 2025 | USD 8.92 billion |
| CAGR Growth Rate | 11.89% CAGR |
| Base Year | 2025 |
| Forecast Period | 2026-2035 |
| Key Segment | By Solution, Deployment Mode, Organization Size, Application, End-User Industry and Region |
| Report Coverage | Revenue Estimation and Forecast, Company Profile, Competitive Landscape, Growth Factors and Recent Trends |
| Regional Scope | North America, Europe, Asia Pacific, Middle East & Africa, and South & Central America |
| Buying Options | Request tailored purchasing options to fulfil your requirements for research. |
Regional Analysis
How Big is the North America Market Size?
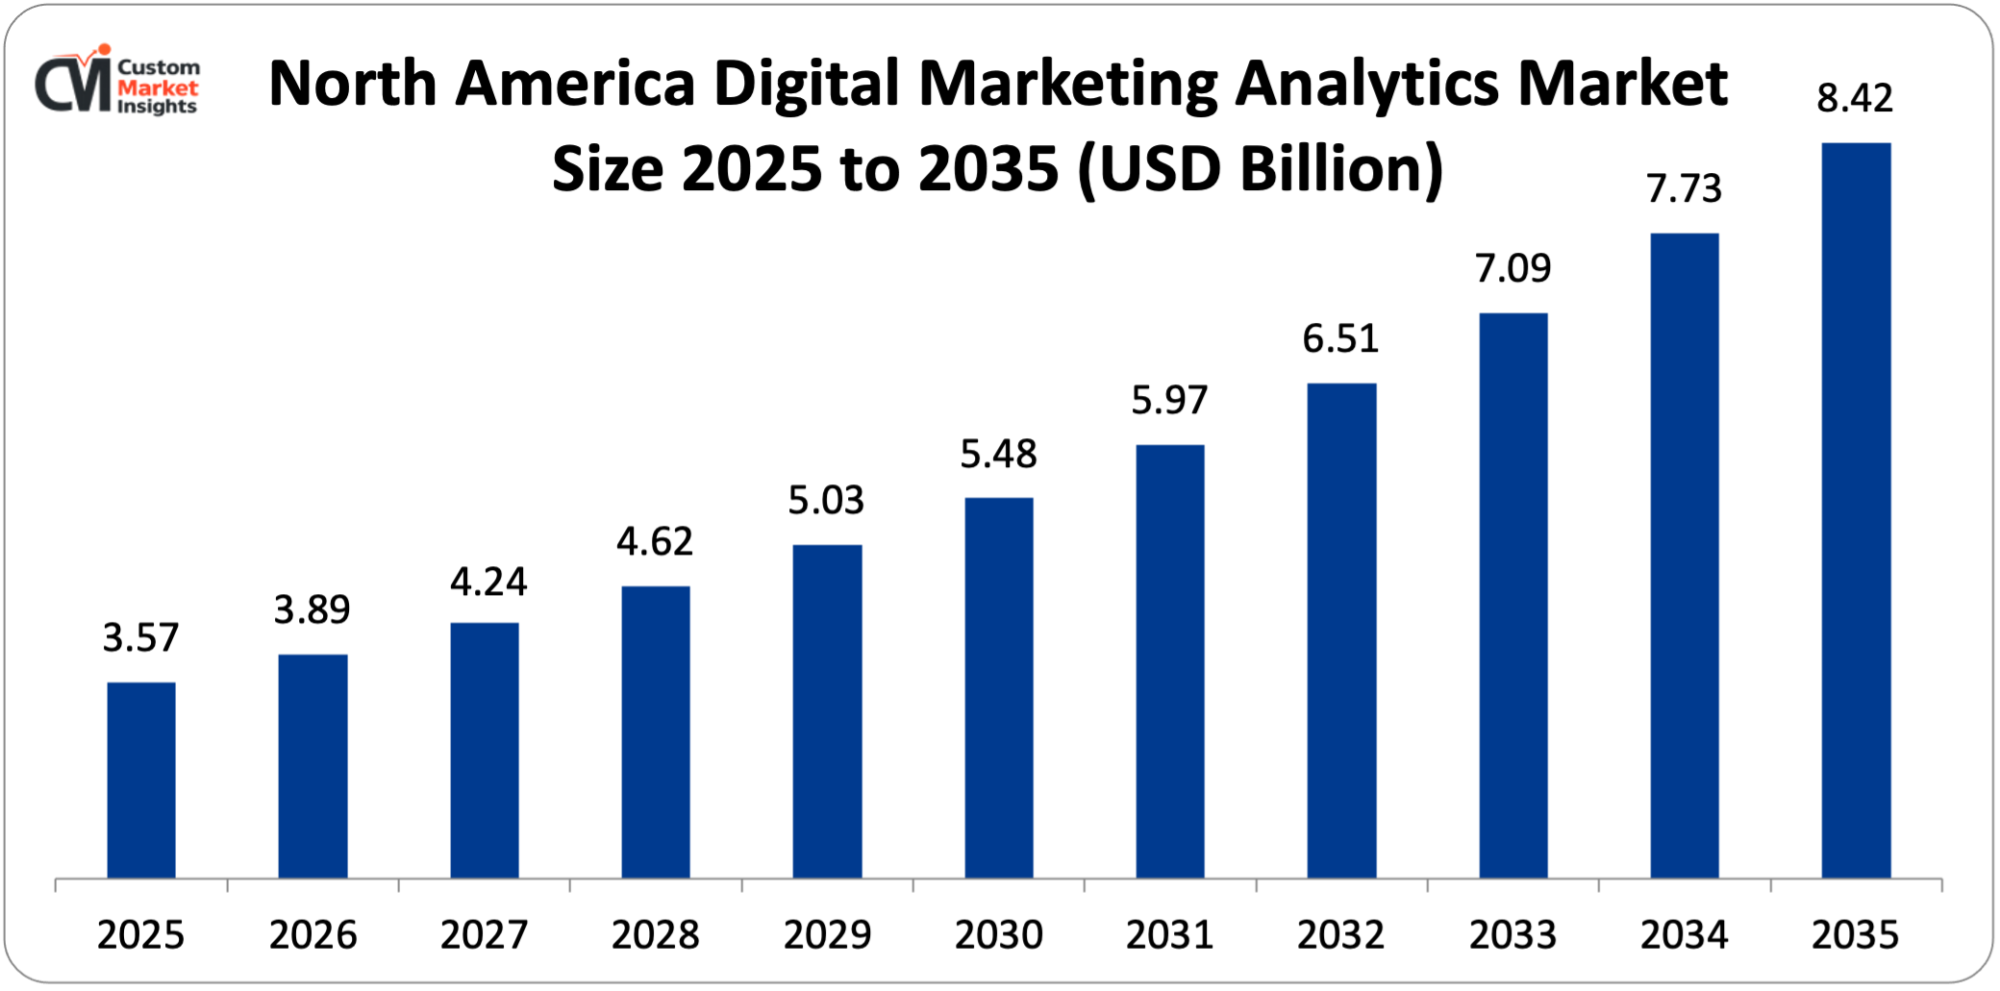
The North America Digital Marketing Analytics market size is estimated at USD 3.57 billion in 2025 and is projected to reach approximately USD 8.42 billion by 2035, with an 11.2% CAGR from 2026 to 2035.
Why did North America Dominate the Market in 2025?
North America plays a key role in the world with an estimated market share of about 40% in 2025, due to various factors including the massive digital advertising market with U.S. spending reaching USD 298 billion in 2024 representing 60.5% of total ad spend, the concentration of major brands including 133 Fortune 500 companies headquartered in the United States with combined marketing budgets exceeding USD 180 billion annually, the mature marketing technology ecosystem with 68% of global martech vendors based in North America, the sophisticated digital-first consumer base with 92% internet penetration and average 7.4 hours daily digital media consumption, and the presence of leading analytics platform providers including Google, Adobe, Salesforce, Oracle, and IBM headquartered in the region. The United States e-commerce market reached USD 1.14 trillion in 2024 with 343 million online shoppers requiring sophisticated analytics infrastructure.
United States Market Trends
The U.S. market is characterised by the massive technology industry housing FAANG companies (Facebook/Meta, Apple, Amazon, Netflix, Google) that spend USD 45+ billion on marketing combined, the sophisticated retail industry with 1.1 million e-commerce businesses and USD 1.14 trillion of online sales, the mature B2B marketing with technology companies that spend 15-25% of their revenue on marketing compared to 10-12% cross-industry, the concentration of marketing agencies with USD 150+ billion combined client advertising spend; and the 2,800+ marketing technology vendors that exist in the United States that generate a competitive ecosystem that leads to continuous innovations.
Why is Asia Pacific Experiencing Rapid Growth?
The growth rate in Asia Pacific is highest with the projected CAGR of 14.2% in 2026-2035, implying rapid digitalization with internet users numbering 2.9 billion (59% of the world population), representing 59%, the viral e-commerce growth with China reaching USD 3.2 trillion in online transactions and Southeast Asia USD 254 billion per annum, the mobile-first consumer preference with 5.3 billion users of smartphones and with 5.4 hours consumption of mobile product daily, the rise In 2024 the Chinese digital advertising market had grown to USD 167b, with India growing to USD 11.8b with a 15-20 rate of growth.
China Market Trends
The Chinese market is dominated by the massive e-commerce ecosystem with USD 3.2 trillion of online sales across Alibaba (1.4 billion annual active consumers), JD.com (588 million), and Pinduoduo (753 million) that necessitate the power of sophisticated analytics infrastructure, the mobile commerce dominance of 85% of e-commerce transactions with 1.05 billion mobile shoppers, the unique digital environment with WeChat integrating messaging, social media, payments, and e-commerce that creates integrated analytics needs, and the local analytics platforms with B The one-day shopping festival of the Singles’ Day causes USD 139 billion in sales in 24 hours, including 1.4 billion shipping orders and enormous real-time analytics infrastructure.
Why is Europe Focusing on Privacy-Compliant Analytics?
The market is stringent in terms of privacy with GDPR influencing 448 million European consumers across 27 EU member states, which place demands on consent management, data minimisation, and the right to be forgotten affecting analytics implementations, the cookie depreciation effect with Safari and Firefox blocking third-party cookies impacting 35% of European online browser usage, sophisticated digital advertising market with USD 142 billion in online sales across diversified markets, and a focus on first-party data strategies and privacy preserving analytics methods. Gartner research shows that European firms spend 25-40% more on privacy-compliant analytics infrastructures than their U.S. counterparts, and server-side tracking, consent management tools and first-party data lakes have become commonplace implementations.
Germany Market Trends
The German market is characterized by the need to have sophisticated analytics to serve the automotive industry with Volkswagen, BMW, Mercedes-Benz, and Audi spending EUR 12+ billion on marketing, the strong e-commerce market with EUR 141 billion in online sales among 87 million internet users, the strong position of Germany as the first country in the European Union to adopt GDPR, and the use of analytics in marketing by the Mittelstand (mid-sized enterprises) sector with 3.7 million companies rapidly deploying digital marketing solutions. German consumers have 17 touchpoints with their brands, which is why they demand detailed journey analytics to make a purchase decision.
Why is Latin America Emerging as Growth Market?
The LAMEA region is now growing because internet penetration is increasing with Latin America at 74% connectivity to 467 million users, e-commerce is rising with the market value of 78% of social media users in Latin America buying products through social networks, and marketing proficiency is increasing as global brands are expanding operations. The marketplace analytics process is required by what WhatsApp has achieved through creating popular messaging-based marketing analytics due to the 530 million users in Latin America and Mercado Libre has with its USD 52 billion gross merchandise value across 18 countries.
Top Players in the Market and Their Offerings
- Google LLC (Google Analytics)
- Adobe Inc.
- Salesforce Inc.
- Oracle Corporation
- IBM Corporation
- SAS Institute Inc.
- Mixpanel
- Amplitude Inc.
- Heap Inc.
- Segment (Twilio)
- Others
Key Developments
The market has undergone significant developments as industry participants seek to expand capabilities and enhance product portfolios.
- In October 2024: Google has introduced the next-generation predictive measures in Google Analytics 4. These metrics have been designed to operate using AI, and they are customer lifetime value prediction, churn probability scoring and purchase propensity modeling. They also allow the marketers to give more emphasis to long-term value rather than being conversion-only, as it demonstrates the shift of the industry to AI-powered predictive analytics.
- In February 2025: Adobe declared the growth of Experience Platform. Privacy-conserving analytics include federated learning and differential privacy, which are introduced in the upgrade. These tools can enable cross-organization insights without breaking GDPR or CCPA, and have fulfilled the increased need for privacy-first analytics solutions.
These strategic activities have allowed companies to strengthen market positions, expand product offerings, enhance technological capabilities, and capitalize on growth opportunities within the expanding market.
The Digital Marketing Analytics (DMA) Market is segmented as follows:
By Solution
- Web Analytics
- Social Media Analytics
- Email Marketing Analytics
- Mobile Analytics
- Marketing Automation Analytics
- Content Marketing Analytics
- SEO and SEM Analytics
- Video Analytics
By Deployment Mode
- Cloud-based
- On-premise
- Hybrid
By Organization Size
- Large Enterprises
- Small and Medium Enterprises
By Application
- Customer Acquisition
- Customer Retention
- Lead Generation
- Campaign Management
- Personalization
- Market Research
- Competitive Intelligence
- Other Applications
By End-User Industry
- Retail and E-commerce
- BFSI (Banking, Financial Services, Insurance)
- Media and Entertainment
- Healthcare
- Technology and Software
- Travel and Hospitality
- Telecommunications
- Automotive
- Other Industries
Regional Coverage:
North America
- U.S.
- Canada
- Mexico
- Rest of North America
Europe
- Germany
- France
- U.K.
- Russia
- Italy
- Spain
- Netherlands
- Rest of Europe
Asia Pacific
- China
- Japan
- India
- New Zealand
- Australia
- South Korea
- Taiwan
- Rest of Asia Pacific
The Middle East & Africa
- Saudi Arabia
- UAE
- Egypt
- Kuwait
- South Africa
- Rest of the Middle East & Africa
Latin America
- Brazil
- Argentina
- Rest of Latin America
Table of Contents
- Chapter 1. Preface
- 1.1 Report Description and Scope
- 1.2 Research scope
- 1.3 Research methodology
- 1.3.1 Market Research Type
- 1.3.2 Market research methodology
- Chapter 2. Executive Summary
- 2.1 Global Digital Marketing Analytics (DMA) Market, (2026 – 2035) (USD Billion)
- 2.2 Global Digital Marketing Analytics (DMA) Market: snapshot
- Chapter 3. Global Digital Marketing Analytics (DMA) Market – Industry Analysis
- 3.1 Digital Marketing Analytics (DMA) Market: Market Dynamics
- 3.2 Market Drivers
- 3.2.1 Explosive Growth in Digital Advertising Investment and Channel Proliferation
- 3.2.2 Artificial Intelligence and Machine Learning Revolution in Marketing
- 3.3 Market Restraints
- 3.4 Market Opportunities
- 3.5 Market Challenges
- 3.6 Porter’s Five Forces Analysis
- 3.7 Market Attractiveness Analysis
- 3.7.1 Market attractiveness analysis By Solution
- 3.7.2 Market attractiveness analysis By Deployment Mode
- 3.7.3 Market attractiveness analysis By Organization Size
- 3.7.4 Market attractiveness analysis By Application
- 3.7.5 Market attractiveness analysis By End-User Industry
- Chapter 4. Global Digital Marketing Analytics (DMA) Market- Competitive Landscape
- 4.1 Company market share analysis
- 4.1.1 Global Digital Marketing Analytics (DMA) Market: company market share, 2025
- 4.2 Strategic development
- 4.2.1 Acquisitions & mergers
- 4.2.2 New Product launches
- 4.2.3 Agreements, partnerships, collaborations, and joint ventures
- 4.2.4 Research and development and Regional expansion
- 4.3 Price trend analysis
- 4.1 Company market share analysis
- Chapter 5. Global Digital Marketing Analytics (DMA) Market – Solution Analysis
- 5.1 Global Digital Marketing Analytics (DMA) Market overview: By Solution
- 5.1.1 Global Digital Marketing Analytics (DMA) Market share, By Solution, 2025 and 2035
- 5.2 Web Analytics
- 5.2.1 Global Digital Marketing Analytics (DMA) Market by Web Analytics, 2026 – 2035 (USD Billion)
- 5.3 Social Media Analytics
- 5.3.1 Global Digital Marketing Analytics (DMA) Market by Social Media Analytics, 2026 – 2035 (USD Billion)
- 5.4 Email Marketing Analytics
- 5.4.1 Global Digital Marketing Analytics (DMA) Market by Email Marketing Analytics, 2026 – 2035 (USD Billion)
- 5.5 Mobile Analytics
- 5.5.1 Global Digital Marketing Analytics (DMA) Market by Mobile Analytics, 2026 – 2035 (USD Billion)
- 5.6 Marketing Automation Analytics
- 5.6.1 Global Digital Marketing Analytics (DMA) Market by Marketing Automation Analytics, 2026 – 2035 (USD Billion)
- 5.7 Content Marketing Analytics
- 5.7.1 Global Digital Marketing Analytics (DMA) Market by Content Marketing Analytics, 2026 – 2035 (USD Billion)
- 5.8 SEO and SEM Analytics
- 5.8.1 Global Digital Marketing Analytics (DMA) Market by SEO and SEM Analytics, 2026 – 2035 (USD Billion)
- 5.9 Video Analytics
- 5.9.1 Global Digital Marketing Analytics (DMA) Market by Video Analytics, 2026 – 2035 (USD Billion)
- 5.1 Global Digital Marketing Analytics (DMA) Market overview: By Solution
- Chapter 6. Global Digital Marketing Analytics (DMA) Market – Deployment Mode Analysis
- 6.1 Global Digital Marketing Analytics (DMA) Market overview: By Deployment Mode
- 6.1.1 Global Digital Marketing Analytics (DMA) Market share, By Deployment Mode, 2025 and 2035
- 6.2 Cloud-based
- 6.2.1 Global Digital Marketing Analytics (DMA) Market by Cloud-based, 2026 – 2035 (USD Billion)
- 6.3 On-premise
- 6.3.1 Global Digital Marketing Analytics (DMA) Market by On-premise, 2026 – 2035 (USD Billion)
- 6.4 Hybrid
- 6.4.1 Global Digital Marketing Analytics (DMA) Market by Hybrid, 2026 – 2035 (USD Billion)
- 6.1 Global Digital Marketing Analytics (DMA) Market overview: By Deployment Mode
- Chapter 7. Global Digital Marketing Analytics (DMA) Market – Organization Size Analysis
- 7.1 Global Digital Marketing Analytics (DMA) Market overview: By Organization Size
- 7.1.1 Global Digital Marketing Analytics (DMA) Market share, By Organization Size, 2025 and 2035
- 7.2 Large Enterprises
- 7.2.1 Global Digital Marketing Analytics (DMA) Market by Large Enterprises, 2026 – 2035 (USD Billion)
- 7.3 Small and Medium Enterprises
- 7.3.1 Global Digital Marketing Analytics (DMA) Market by Small and Medium Enterprises, 2026 – 2035 (USD Billion)
- 7.1 Global Digital Marketing Analytics (DMA) Market overview: By Organization Size
- Chapter 8. Global Digital Marketing Analytics (DMA) Market – Application Analysis
- 8.1 Global Digital Marketing Analytics (DMA) Market overview: By Application
- 8.1.1 Global Digital Marketing Analytics (DMA) Market share, By Application, 2025 and 2035
- 8.2 Customer Acquisition
- 8.2.1 Global Digital Marketing Analytics (DMA) Market by Customer Acquisition, 2026 – 2035 (USD Billion)
- 8.3 Customer Retention
- 8.3.1 Global Digital Marketing Analytics (DMA) Market by Customer Retention, 2026 – 2035 (USD Billion)
- 8.4 Lead Generation
- 8.4.1 Global Digital Marketing Analytics (DMA) Market by Lead Generation, 2026 – 2035 (USD Billion)
- 8.5 Campaign Management
- 8.5.1 Global Digital Marketing Analytics (DMA) Market by Campaign Management, 2026 – 2035 (USD Billion)
- 8.6 Personalization
- 8.6.1 Global Digital Marketing Analytics (DMA) Market by Personalization, 2026 – 2035 (USD Billion)
- 8.7 Market Research
- 8.7.1 Global Digital Marketing Analytics (DMA) Market by Market Research, 2026 – 2035 (USD Billion)
- 8.8 Competitive Intelligence
- 8.8.1 Global Digital Marketing Analytics (DMA) Market by Competitive Intelligence, 2026 – 2035 (USD Billion)
- 8.9 Other Applications
- 8.9.1 Global Digital Marketing Analytics (DMA) Market by Other Applications, 2026 – 2035 (USD Billion)
- 8.1 Global Digital Marketing Analytics (DMA) Market overview: By Application
- Chapter 9. Global Digital Marketing Analytics (DMA) Market – End-User Industry Analysis
- 9.1 Global Digital Marketing Analytics (DMA) Market overview: By End-User Industry
- 9.1.1 Global Digital Marketing Analytics (DMA) Market share, By End-User Industry, 2025 and 2035
- 9.2 Retail and E-commerce
- 9.2.1 Global Digital Marketing Analytics (DMA) Market by Retail and E-commerce, 2026 – 2035 (USD Billion)
- 9.3 BFSI (Banking, Financial Services, Insurance)
- 9.3.1 Global Digital Marketing Analytics (DMA) Market by BFSI (Banking, Financial Services, Insurance), 2026 – 2035 (USD Billion)
- 9.4 Media and Entertainment
- 9.4.1 Global Digital Marketing Analytics (DMA) Market by Media and Entertainment, 2026 – 2035 (USD Billion)
- 9.5 Healthcare
- 9.5.1 Global Digital Marketing Analytics (DMA) Market by Healthcare, 2026 – 2035 (USD Billion)
- 9.6 Technology and Software
- 9.6.1 Global Digital Marketing Analytics (DMA) Market by Technology and Software, 2026 – 2035 (USD Billion)
- 9.7 Travel and Hospitality
- 9.7.1 Global Digital Marketing Analytics (DMA) Market by Travel and Hospitality, 2026 – 2035 (USD Billion)
- 9.8 Telecommunications
- 9.8.1 Global Digital Marketing Analytics (DMA) Market by Telecommunications, 2026 – 2035 (USD Billion)
- 9.9 Automotive
- 9.9.1 Global Digital Marketing Analytics (DMA) Market by Automotive, 2026 – 2035 (USD Billion)
- 9.10 Other Industries
- 9.10.1 Global Digital Marketing Analytics (DMA) Market by Other Industries, 2026 – 2035 (USD Billion)
- 9.1 Global Digital Marketing Analytics (DMA) Market overview: By End-User Industry
- Chapter 10. Digital Marketing Analytics (DMA) Market – Regional Analysis
- 10.1 Global Digital Marketing Analytics (DMA) Market Regional Overview
- 10.2 Global Digital Marketing Analytics (DMA) Market Share, by Region, 2025 & 2035 (USD Billion)
- 10.3. North America
- 10.3.1 North America Digital Marketing Analytics (DMA) Market, 2026 – 2035 (USD Billion)
- 10.3.1.1 North America Digital Marketing Analytics (DMA) Market, by Country, 2026 – 2035 (USD Billion)
- 10.3.1 North America Digital Marketing Analytics (DMA) Market, 2026 – 2035 (USD Billion)
- 10.4 North America Digital Marketing Analytics (DMA) Market, by Solution, 2026 – 2035
- 10.4.1 North America Digital Marketing Analytics (DMA) Market, by Solution, 2026 – 2035 (USD Billion)
- 10.5 North America Digital Marketing Analytics (DMA) Market, by Deployment Mode, 2026 – 2035
- 10.5.1 North America Digital Marketing Analytics (DMA) Market, by Deployment Mode, 2026 – 2035 (USD Billion)
- 10.6 North America Digital Marketing Analytics (DMA) Market, by Organization Size, 2026 – 2035
- 10.6.1 North America Digital Marketing Analytics (DMA) Market, by Organization Size, 2026 – 2035 (USD Billion)
- 10.7 North America Digital Marketing Analytics (DMA) Market, by Application, 2026 – 2035
- 10.7.1 North America Digital Marketing Analytics (DMA) Market, by Application, 2026 – 2035 (USD Billion)
- 10.8 North America Digital Marketing Analytics (DMA) Market, by End-User Industry, 2026 – 2035
- 10.8.1 North America Digital Marketing Analytics (DMA) Market, by End-User Industry, 2026 – 2035 (USD Billion)
- 10.9. Europe
- 10.9.1 Europe Digital Marketing Analytics (DMA) Market, 2026 – 2035 (USD Billion)
- 10.9.1.1 Europe Digital Marketing Analytics (DMA) Market, by Country, 2026 – 2035 (USD Billion)
- 10.9.1 Europe Digital Marketing Analytics (DMA) Market, 2026 – 2035 (USD Billion)
- 10.10 Europe Digital Marketing Analytics (DMA) Market, by Solution, 2026 – 2035
- 10.10.1 Europe Digital Marketing Analytics (DMA) Market, by Solution, 2026 – 2035 (USD Billion)
- 10.11 Europe Digital Marketing Analytics (DMA) Market, by Deployment Mode, 2026 – 2035
- 10.11.1 Europe Digital Marketing Analytics (DMA) Market, by Deployment Mode, 2026 – 2035 (USD Billion)
- 10.12 Europe Digital Marketing Analytics (DMA) Market, by Organization Size, 2026 – 2035
- 10.12.1 Europe Digital Marketing Analytics (DMA) Market, by Organization Size, 2026 – 2035 (USD Billion)
- 10.13 Europe Digital Marketing Analytics (DMA) Market, by Application, 2026 – 2035
- 10.13.1 Europe Digital Marketing Analytics (DMA) Market, by Application, 2026 – 2035 (USD Billion)
- 10.14 Europe Digital Marketing Analytics (DMA) Market, by End-User Industry, 2026 – 2035
- 10.14.1 Europe Digital Marketing Analytics (DMA) Market, by End-User Industry, 2026 – 2035 (USD Billion)
- 10.15. Asia Pacific
- 10.15.1 Asia Pacific Digital Marketing Analytics (DMA) Market, 2026 – 2035 (USD Billion)
- 10.15.1.1 Asia Pacific Digital Marketing Analytics (DMA) Market, by Country, 2026 – 2035 (USD Billion)
- 10.15.1 Asia Pacific Digital Marketing Analytics (DMA) Market, 2026 – 2035 (USD Billion)
- 10.16 Asia Pacific Digital Marketing Analytics (DMA) Market, by Solution, 2026 – 2035
- 10.16.1 Asia Pacific Digital Marketing Analytics (DMA) Market, by Solution, 2026 – 2035 (USD Billion)
- 10.17 Asia Pacific Digital Marketing Analytics (DMA) Market, by Deployment Mode, 2026 – 2035
- 10.17.1 Asia Pacific Digital Marketing Analytics (DMA) Market, by Deployment Mode, 2026 – 2035 (USD Billion)
- 10.18 Asia Pacific Digital Marketing Analytics (DMA) Market, by Organization Size, 2026 – 2035
- 10.18.1 Asia Pacific Digital Marketing Analytics (DMA) Market, by Organization Size, 2026 – 2035 (USD Billion)
- 10.19 Asia Pacific Digital Marketing Analytics (DMA) Market, by Application, 2026 – 2035
- 10.19.1 Asia Pacific Digital Marketing Analytics (DMA) Market, by Application, 2026 – 2035 (USD Billion)
- 10.20 Asia Pacific Digital Marketing Analytics (DMA) Market, by End-User Industry, 2026 – 2035
- 10.20.1 Asia Pacific Digital Marketing Analytics (DMA) Market, by End-User Industry, 2026 – 2035 (USD Billion)
- 10.21. Latin America
- 10.21.1 Latin America Digital Marketing Analytics (DMA) Market, 2026 – 2035 (USD Billion)
- 10.21.1.1 Latin America Digital Marketing Analytics (DMA) Market, by Country, 2026 – 2035 (USD Billion)
- 10.21.1 Latin America Digital Marketing Analytics (DMA) Market, 2026 – 2035 (USD Billion)
- 10.22 Latin America Digital Marketing Analytics (DMA) Market, by Solution, 2026 – 2035
- 10.22.1 Latin America Digital Marketing Analytics (DMA) Market, by Solution, 2026 – 2035 (USD Billion)
- 10.23 Latin America Digital Marketing Analytics (DMA) Market, by Deployment Mode, 2026 – 2035
- 10.23.1 Latin America Digital Marketing Analytics (DMA) Market, by Deployment Mode, 2026 – 2035 (USD Billion)
- 10.24 Latin America Digital Marketing Analytics (DMA) Market, by Organization Size, 2026 – 2035
- 10.24.1 Latin America Digital Marketing Analytics (DMA) Market, by Organization Size, 2026 – 2035 (USD Billion)
- 10.25 Latin America Digital Marketing Analytics (DMA) Market, by Application, 2026 – 2035
- 10.25.1 Latin America Digital Marketing Analytics (DMA) Market, by Application, 2026 – 2035 (USD Billion)
- 10.26 Latin America Digital Marketing Analytics (DMA) Market, by End-User Industry, 2026 – 2035
- 10.26.1 Latin America Digital Marketing Analytics (DMA) Market, by End-User Industry, 2026 – 2035 (USD Billion)
- 10.27. The Middle-East and Africa
- 10.27.1 The Middle-East and Africa Digital Marketing Analytics (DMA) Market, 2026 – 2035 (USD Billion)
- 10.27.1.1 The Middle-East and Africa Digital Marketing Analytics (DMA) Market, by Country, 2026 – 2035 (USD Billion)
- 10.27.1 The Middle-East and Africa Digital Marketing Analytics (DMA) Market, 2026 – 2035 (USD Billion)
- 10.28 The Middle-East and Africa Digital Marketing Analytics (DMA) Market, by Solution, 2026 – 2035
- 10.28.1 The Middle-East and Africa Digital Marketing Analytics (DMA) Market, by Solution, 2026 – 2035 (USD Billion)
- 10.29 The Middle-East and Africa Digital Marketing Analytics (DMA) Market, by Deployment Mode, 2026 – 2035
- 10.29.1 The Middle-East and Africa Digital Marketing Analytics (DMA) Market, by Deployment Mode, 2026 – 2035 (USD Billion)
- 10.30 The Middle-East and Africa Digital Marketing Analytics (DMA) Market, by Organization Size, 2026 – 2035
- 10.30.1 The Middle-East and Africa Digital Marketing Analytics (DMA) Market, by Organization Size, 2026 – 2035 (USD Billion)
- 10.31 The Middle-East and Africa Digital Marketing Analytics (DMA) Market, by Application, 2026 – 2035
- 10.31.1 The Middle-East and Africa Digital Marketing Analytics (DMA) Market, by Application, 2026 – 2035 (USD Billion)
- 10.32 The Middle-East and Africa Digital Marketing Analytics (DMA) Market, by End-User Industry, 2026 – 2035
- 10.32.1 The Middle-East and Africa Digital Marketing Analytics (DMA) Market, by End-User Industry, 2026 – 2035 (USD Billion)
- Chapter 11. Company Profiles
- 11.1 Google LLC (Google Analytics)
- 11.1.1 Overview
- 11.1.2 Financials
- 11.1.3 Product Portfolio
- 11.1.4 Business Strategy
- 11.1.5 Recent Developments
- 11.2 Adobe Inc.
- 11.2.1 Overview
- 11.2.2 Financials
- 11.2.3 Product Portfolio
- 11.2.4 Business Strategy
- 11.2.5 Recent Developments
- 11.3 Salesforce Inc.
- 11.3.1 Overview
- 11.3.2 Financials
- 11.3.3 Product Portfolio
- 11.3.4 Business Strategy
- 11.3.5 Recent Developments
- 11.4 Oracle Corporation
- 11.4.1 Overview
- 11.4.2 Financials
- 11.4.3 Product Portfolio
- 11.4.4 Business Strategy
- 11.4.5 Recent Developments
- 11.5 IBM Corporation
- 11.5.1 Overview
- 11.5.2 Financials
- 11.5.3 Product Portfolio
- 11.5.4 Business Strategy
- 11.5.5 Recent Developments
- 11.6 SAS Institute Inc.
- 11.6.1 Overview
- 11.6.2 Financials
- 11.6.3 Product Portfolio
- 11.6.4 Business Strategy
- 11.6.5 Recent Developments
- 11.7 Mixpanel
- 11.7.1 Overview
- 11.7.2 Financials
- 11.7.3 Product Portfolio
- 11.7.4 Business Strategy
- 11.7.5 Recent Developments
- 11.8 Amplitude Inc.
- 11.8.1 Overview
- 11.8.2 Financials
- 11.8.3 Product Portfolio
- 11.8.4 Business Strategy
- 11.8.5 Recent Developments
- 11.9 Heap Inc.
- 11.9.1 Overview
- 11.9.2 Financials
- 11.9.3 Product Portfolio
- 11.9.4 Business Strategy
- 11.9.5 Recent Developments
- 11.10 Segment (Twilio)
- 11.10.1 Overview
- 11.10.2 Financials
- 11.10.3 Product Portfolio
- 11.10.4 Business Strategy
- 11.10.5 Recent Developments
- 11.11 Others.
- 11.11.1 Overview
- 11.11.2 Financials
- 11.11.3 Product Portfolio
- 11.11.4 Business Strategy
- 11.11.5 Recent Developments
- 11.1 Google LLC (Google Analytics)
List Of Figures
Figures No 1 to 50
List Of Tables
Tables No 1 to 127
FAQs
The key players in the market are Google LLC (Google Analytics), Adobe Inc., Salesforce Inc., Oracle Corporation, IBM Corporation, SAS Institute Inc., Mixpanel, Amplitude Inc., Heap Inc., Segment (Twilio), Others.
The government has a significant influence on the market through creating compliance requirements that restructure analytics implementation such as the General Data Protection Regulation (GDPR) with effects on 448 million consumers in the EU on explicit consent for tracking, data minimization rules, right to erasure, and fines of up to EUR 20 million or 4% of global revenue with total fines exceeding EUR 4.5 billion since 2018, the California Consumer Privacy Act (CCPA) and California Privacy Rights Act (CPRA) with comprehensive privacy rights of 39 million California residents including The use of cookies is governed by noticeable consent warnings that impact the user experience of a website, and the ePrivacy Directive and future ePrivacy Regulation in the EU introduce other tracking limits than those of GDPR. The rules push the market to privacy-sensitive analytics using server-side tracking, a first-party data approach, consent management platforms worth USD 1.2 billion with 25% CAGR, and privacy-enhancing solutions such as differential privacy, federated learning, and secure multi-party computation, which will become the norm. Government spending on digital marketing also influences market growth, as public sector organizations spending USD 15.8 billion on digital advertising in 2024 will demand analytics solutions that comply with regulations, and new rules, such as laws like SB 262 in Florida, prohibiting the use of TikTok by the government, present platform-specific analytics issues to public sector marketers.
Digital Marketing Analytics solutions are available in a variety of pricing situations based on the mode of deployment, features, volumes of data, and size of organization. Free versions such as Google Analytics 4 are offering 30 million websites a free basic analytics service, making analytics more accessible and affordable to SMEs and startups with smaller budgets. Lower-end paid services start at USD 500-2,000 per month based on SME-oriented service offerings such as HubSpot Marketing Hub Starter (USD 800/month) and Mixpanel Growth (USD 899/month), which offer additional functionality such as infinity user counts, longer data storage and deeper analysis. Mid-market solutions USD 5,000-20,000 monthly platforms such as Adobe Analytics Select and Salesforce Marketing Cloud USD 100-500 employees, 10-100 million monthly event processing. Enterprise platforms cost USD 50,000-500,000+ per year in solutions such as Adobe Analytics Prime/Ultimate, Google Analytics 360 (USD 150,000 a year minimum), and Salesforce Marketing Cloud Advanced to large organizations with billions of monthly events to serve hundreds of users. The usage-based pricing models can be based on price per event tracked or price for each MTU (month tracks user) or price per API call, commonly USD 0.0001-0.001 per event based on volume, and provide the flexibility to vary costs with business expansion. The ROI is attractive where analytics that are appropriately applied will produce 15-30% increases in marketing effectiveness based on Forrester research, 20-35% cost reduction in customer acquisition through optimization and 25-40% growth in customer lifetime value because of enhanced targeting and personalization. Switch to cloud-based SaaS models will save implementation expenses by 60-80% of previous on-premise deployment costs of USD 500,000-2 million+ in software, hardware and implementation services and increase market accessibility to mid-size organizations.
The market is projected to reach USD 24.67B in 2035 based on current analysis, with a robust growth rate of 11.89% between 2026 and 2035, as the digital advertising keeps growing and gets to over USD 1 trillion annually by 2035, new channels are being added to the market such as metaverse advertising, voice commerce, and augmented reality drive adaptation needs, AI technologies are becoming increasingly sophisticated and autonomous in campaign optimization and personalization, and size capabilities, as the privacy-first analytics addresses the need maturation with federated learning and differential privacy becoming standard capabilities, the integration of marketing analytics with revenue operations connecting marketing activities to business outcomes, the expansion in emerging markets with internet penetration reaching 80%+ globally affecting 7+ billion users, and the democratization of sophisticated analytics with cloud platforms making enterprise capabilities accessible to SMEs at USD 500-5,000 monthly price points.
North America will also have the largest revenue share of an estimated 40% of world-wide market largely due to the huge digital advertising ecosystem with U.S. spending USD 298 billion being 60.5% of the collective ad spend, the concentration of 133 Fortune 500 companies and total enterprise marketing budgets of USD 180 billion annually, the advanced martech-environment with 2,800 martech vendors and 68% of the world-martech firms headquartered in region, the complex consumer base with 92% internet penetration and 7.4 hours daily digital media consumption, the USD 1.14 trillion e-commerce market with 343 million online shoppers, the presence of analytics platform leaders including Google, Adobe, Salesforce, Oracle, and IBM, and the innovation ecosystem with venture capital investment exceeding USD 12 billion in martech startups driving continuous advancement.
Asia-Pacific region shows the highest growth rate with 14.2% CAGR due to rapid digital transformation with 2.9 billion internet users representing 59% of global internet population, the explosive e-commerce growth with China reaching USD 3.2 trillion and Southeast Asia USD 254 billion in annual online sales, the mobile-first behavior with 5.3 billion smartphone users averaging 5.4 hours daily mobile usage, the super-app ecosystems with WeChat (1.3B users), Alipay (1.2B), and Grab (187M) creating unique analytics needs, the emerging marketing sophistication with brands shifting to data-driven approaches, the live-streaming commerce generating USD 512 billion in China alone, and the untapped SME market with millions of businesses beginning digital marketing adoption requiring accessible analytics solutions.
The Global Digital Marketing Analytics Market is projected to record impressive growth owing to the digital advertising boom projected to reach USD 667 billion by the year 2024 rising to USD 870 billion by the year 2027; the proliferation of channels with brands having 15-20 touchpoints and consumers having 20 touchpoints on average before making purchase decisions; the sophistication of the customer journeys with the AI and machine learning revolution transforming privacy with the depreciation of third-party cookies; and the accountability imperative, with 72% of CMOs.