Europe Medical Waste Management Market Size, Trends and Insights By Waste Type (Infectious Waste, Hazardous Waste, Pharmaceutical Waste, Chemical Waste, Cytotoxic Waste, Radioactive Waste, General Waste, Others), By Treatment Method (Incineration, Autoclaving, Chemical Disinfection, Microwave Treatment, Irradiation, Others), By Service Type (Collection & Transportation, Treatment & Disposal, Recycling & Recovery, Consulting & Training, Others), By Source (Hospitals, Clinics & Physician Offices, Diagnostic Laboratories, Pharmaceutical & Biotechnology Companies, Research Institutes, Long-term Care Facilities, Others), and By Region - Industry Overview, Statistical Data, Competitive Analysis, Share, Outlook, and Forecast 2026 – 2035
Report Snapshot
CAGR: 7.3%
| Study Period: | 2026-2035 |
| Fastest Growing Market: | Europe |
| Largest Market: | Europe |
Major Players
- Veolia Environnement S.A.
- SUEZ
- Stericycle International LLC
- Sharpsmart Europe
- Others
Reports Description
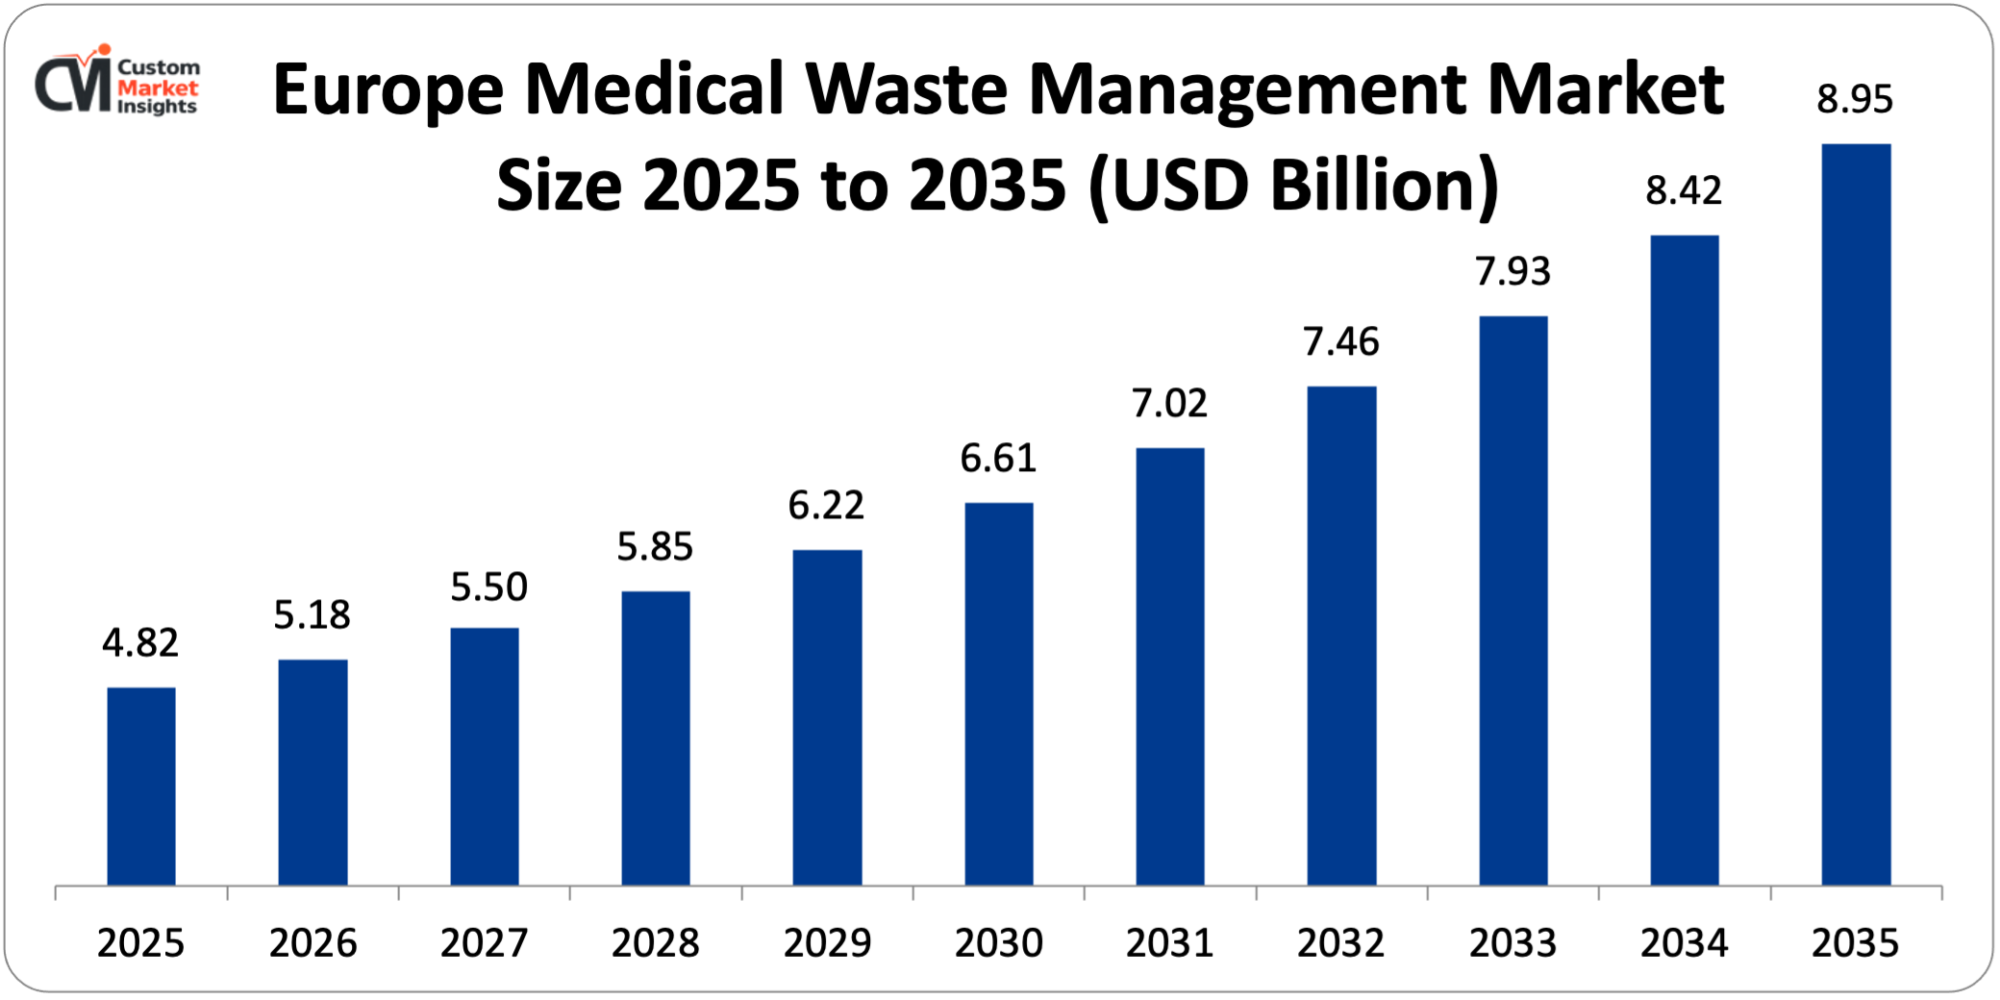
It is estimated that the market size of the Europe medical waste management market will be USD 4.82 billion in 2025, and is estimated to increase to USD 5.18 billion in 2026, and approximately USD 8.95 billion in 2035, with the annual CAGR of the market size being 7.3% between the period 2026 and 2035.
This market is expanding due to the tough European Union laws on disposal of medical waste, increase in medical activities and aging population, growth in generation of infectious and hazardous medical waste, growing focus on adopting sustainable waste management systems, and development of healthcare infrastructure in Central and Eastern Europe.
Market Highlight
- Germany had a 24% market share as the market leader in the segment of the Europe medical waste management market in 2025.
- Eastern Europe will be expanding by 9.8% in 2026-2035.
- The infectious garbage section had consumed more than 42% of the waste type market share by 2025.
- Using the treatment method, the autoclaving segment will have the greatest CAGR in the period 2026 to 2035 of 8.6%.
- Service type-wise, the segment of collection and transportation will be estimated to have a 39% market share in 2025.
- By origin, 58% of the market share was carried by hospitals in 2025.
- Among other things, in 2024 the health care waste in Europe will add up to 8.5 million tons a year, with 52% of the total volume produced in Germany, France, and the UK.
Significant Growth Factors
- Stringent EU Regulatory Framework and Compliance Requirements: The holistic nature of the regulatory footprint of the European Union in the area of medical waste management promotes the expansion of markets by ensuring that waste management companies comply with the regulations, harmonize the requirements of member countries, and constantly enhance the policy in line with the sustainability criterion of the environment. The waste hierarchy developed by the EU Waste Framework Directive (2008/98/EC) places waste prevention, waste reuse, waste recycling, waste recovery and waste disposal as the last option and medical waste is classified under the hazardous waste groups and needs special treatment. The Landfill Directive (1999/31/EC) forbids the placement of the untreated infectious medical waste in the landfills whereby pre-treatment by incineration, autoclaving, or chemical disinfection is mandatory prior to any disposal. The European Environment Agency estimated that the healthcare facilities within the EU-27 produced 8.5 million tons of waste in 2024 of which 2.8 million tons was hazardous waste that needed a special management system incurring an average cost of USD 800-1200 per ton compared to USD 80-150 for general waste. The Hospital Waste Directive and its amendments require source segregation, using color-coded bins (yellow (infectious), black (general), and red (pathological)) and tracking systems, and recording the waste product development process to the ultimate disposal. Member states have different national regulations with Germany being the best example with the AvV waste catalog that has 850 waste codes including 15 medical waste categories; France with the DASRI regulations that have established packaging standards and training requirements; and the UK with the Environmental Protection Act that has given the duty of care requirements. The penalties imposed on non-compliance are USD 10,000-500,000 per violation, and an example of such violations is the BAuA in Germany reporting 2,840 cases of medical waste violations and imposing USD 18.4 million of fines in 2024. Recycling of 65% of the municipal waste by 2035 is the target of the Circular Economy Action Plan adopted by the European Commission in 2020 and makes innovations in medical waste recycling and recovery technologies.
- Aging Population and Increasing Healthcare Utilization: The demographic shift in Europe towards the ageing population creates high development in the healthcare services, medical procedures and hence medical waste quantities that demand special handling. According to Eurostat, 21.3% of the EU population was over the age of 65 in 2024 and is expected to be 29.4% in 2050 with the absolute population of elderly residents growing from 94 million to 130 million. The European Commission estimates that healthcare spending will go up to 9.2% of the GDP in 2035 as compared to the 7.8% of GDP in 2024, with the main causes of the increase being the management of chronic diseases related to aging, surgeries, and long-term care. Germany According to the Federal Statistical Office, with 20.8 million hospital admissions each year, the number of hospital admissions has risen 12% in 2015-2024, with an average volume of medical waste (including 0.9 kg of infectious waste) per admission. The incidence of chronic diseases such as diabetes prevalent in 60 million Europeans, cardiovascular diseases prevalent in 85million and cancer prevalent in 4.4 million, creates endless demand for treatments, diagnostics and monitoring that generate medical waste. The home care health service, which is growing fast, with 12.5 million Europeans receiving home care in the year 2024, generates decentralized wastes that need specific collection systems. COVID-19 has irreversibly increased the quantities of medical waste, with the highest generation of 14.2 million tons in 2020-2021 and a minimum generation of 18% of the levels before the pandemic because of ongoing PPE use, testing, and vaccination campaigns. The volume of surgical procedures increased 8.3% between 2019-2024, with minimally invasive surgical procedures involving the use of disposable instruments as a source of waste producing 40% of the perioperative waste compared to surgical procedures performed with reusable instruments.
- Technological Advancements in Treatment Methods: The market is evolving and investing in new technologies of treatment, which are based on better environmental performance, cost-effectiveness, and safety than traditional incineration. The nature of the infectious waste is treated using advanced systems of autoclaving that use vacuum cycles, pre-shredding and sterilizing using steam at temperatures of 134°C with a 6-log reduction of any microbial contamination that is of standard to the EU sterilization requirements and results in non-hazardous waste that can be used as either landfill or energy recovery. According to market data, autoclave installations are on the rise in Europe by 34% in the years 2019-2024, where systems with 500-2000 kg per cycle and a cost per ton of USD 180-320 are being used as compared to USD 450-800 in incineration. Microwave treatment systems, with frequencies of 2.45 GHz, which generate internal heating up to 95-105 o C, offer on-site treatment of facilities with 50-500 kg of daily production, removing transportation expenses and emissions. Liquid and semi-solid waste streams are treated using chemical disinfection systems with sodium hypochlorite, peracetic acid, or ozone with closed loop systems recovering and recycling disinfectants, saving 60-75% of chemical usage. In 2024, the non-incineration treatment technology market in Europe had reached USD 780 million, increasing at an average of 12.4%/year as the treatment facilities sought alternative treatment options to avoid incineration that was becoming increasingly constrained and expensive. Medical waste is transformed into synthesis gas using plasma gasification which is active at five plants in Europe and, at 3,000 degrees Celsius, produces energy and at the same time reduces dioxins and furans, which plague conventional incineration. The REMONDIS organization of Germany has the largest network of autoclaves in Europe, comprising 42 units that take in 285,000 tons of waste each year, which proves that alternative technologies can also be scaled.
What are the Major Advances Changing the Europe Medical Waste Management Market Today
- Digital Waste Tracking and Management Platforms: IoT sensors, cloud-based systems, and data analytics used to digitalize medical waste management offer real-time visibility and regulatory compliance as well as optimization opportunities to change the paper-based systems. Smart bins with weight sensors, RFID tags and GPS provide a real-time view of the fill levels, which activate collection when the bins are 80% full compared to the planned routes, which will cut unwarranted collection by 25-40%. SARTORIUS, a digital waste management solution in Germany, was installed in 280 hospitals whose 1.2 million waste flows were monitored each year, decreasing the number of documentation errors from 8.3 to 0.4, and meeting the EU requirements of traceability. Pilots of Waste tracking systems based on blockchains, in the Netherlands and Sweden, have generated immutable records of waste custody chains between generation and end disposal, removing fraud and making them liable with audit trails that can be accessed by regulators. Data analytics systems digest waste generation trends, declaring optimization points, and employments in the French hospital cluster Assistance Publique saved USD 3.2 million per year in waste expenses by optimizing routes, renegotiating contracts based on realized volumes, and applying selective waste reduction solutions. Healthcare workers can scan waste barcodes and verify that segregation is observed as well as report any incidents with the help of mobile applications, and this data will help to improve and continue working on the enhancement of the system continuously, as well as train them effectively. In 2024, the European market of digital waste management is USD 145 million and projected to expand at 18.6% per year as more facilities become digitalized to comply with reporting obligations according to the updated Waste Framework Directive, whereby by 2027, electronic documentation is required.
- Centralized Treatment Facilities and Regional Hubs: When large scale centralized treatment facilities, which serve several healthcare providers over a region, are strategically developed, economies of scale, investment in technology and better environmental performance over small-scale on-site treatment are achieved. Germany has 68 centralized medical waste treatment sites with an average capacity of 4,200 tons of waste per year, which are operated in state-of-the-art incineration with the cleaning of flue gases to below 0.1 ng TEQ/m³ of dioxins compared to the 1.0 ng limit. SUEZ Environment has 15 medical waste treatment plants with an annual capacity of 142,000 tons in France and they include autoclave, microwave, and incineration facilities depending on the nature of the wastes. Centralization makes possible investment in advanced equipment to control pollution that costs USD 8-15 million per plant, which is financially viable at a large scale, cutting emissions by 85-92%, compared to small-scale incinerators that were used in the past. The hub-and-spoke collection networks are the best way to optimize transportation, and REMONDIS Germany uses 89 transfer stations to restart waste collection at 2,400 medical centers before transporting it to the treatment sites, thereby decreasing the number of vehicle kilometers by 35% and the total emissions by 42%. Through the EU Waste Shipment Regulation, cross-border waste shipment allows reaching an optimal treatment capacity in which Austria took 8,400 tons of waste in Slovakia and the Czech Republic, and it was sent to Vienna to be treated in its advanced facility. Economic evaluation indicates that the centralized treatment would save money, from USD 950-1200 of small on-site system treatment to USD 450-650 of facility treatment of over 5000 tons of treatment annually, which is attributed to labor efficiency, energy, and savings in the purchases of consumables.
- Advanced Energy Recovery and Waste-to-Energy Integration: A combination of medical waste treatment with energy recovery systems transforms the waste management into an energy generator and not a cost center, helping to achieve the goals of the circular economy and compensate for the cost of their treatment. Specialized medical waste burners including energy recovery systems, get 35,000 tons of medical waste per year, which in the Veolia Lyon facility generates power amounting to 18 GWh of electricity and/or district heating and serves 4,200 households without using fossil fuel. In cement kiln co-incineration of sterilized medical waste, which is widely practiced in Germany and France, involves the use of waste as an alternative fuel to substitute coal, the cement industry is consuming 420,000 tons per year of the waste as an alternative fuel, saving USD 38 million in fuel costs, and it burns completely at 1,450°C, destroying pathogens and organic compounds. Life cycle analysis research papers illustrate that energy recovery of medical waste generates fewer greenhouse gases than landfilling of untreated waste, which is 650-850 kg CO₂ equivalent per ton, and this can aid the EU climate neutrality goals. Thermal degradation In use at 12 facilities in Europe, pyrolysis and gasification technologies thermally degrade waste at temperatures of 400-800 o C in an oxygen-limited environment to produce synthesis gas with a heating value of 46 MJ/m³ at the feed end with heating value of 28-35% efficiency gas engines to generate electricity. In 2024, the European waste-to-energy of the medical waste market was USD 680 million, with forecasts of growing to over USD 6 billion due to the renewable energy incentive, carbon pricing schemes and the EU Taxonomy of recognizing energy recovery as a sustainable activity upon passing the technical screening requirements.
- Robotic Sorting and Automation Technologies: Robotic automation of waste sorting through artificial intelligence, machine vision, and sophisticated gripping technologies encapsulates waste sorting and enhances segregation precision, safety and efficiency of workers in the workplace. Optical sorting systems with AI techniques that operate on 18 medical waste sites in Europe have the ability to recognize and segregate recyclable plastics, metals and cardboard to non-hazardous waste streams with an accuracy of 92-97 out of 100 compared to 75-85 out of 100 for manual sorting and recover materials worth USD 85-140 per ton. Robots in waste sorting stations in collaboration with people do repetitive work, such as container positioning, waste bag scanning, and packaging, which increase throughput by 30-45% and decrease musculoskeletal injuries by 68%. Autonomous mobile robots (AMRs) move waste bins within the grounds of major hospitals, the introduction at Hamburg University Medical Center reducing labor expenses by USD 118,000 a year, 2,400 fewer waste collection trips per hospital year, and positively impacting the workflow. The vision systems check compliance with segregation at the waste generation sites, alerting employees when the wrong items are disposed of in the wrong containers, with the pilots decreasing segregation errors by 12.4 to 2.8% and processing cost overruns. In Europe, the robotics medical waste market became USD 78 million in 2024, with Germany, the Netherlands, and Scandinavia having the highest concentration, as the labour costs are appropriate to invest in automation and the environmental services do not have enough workers to perform their work.
Category Wise Insights
By Waste Type
Why Infectious Waste Leads the Market?
The highest market share of 42% in 2025 goes to infectious waste because it is the largest type of hazardous waste produced as a result of patient care procedures, stricter regulatory demands of specific treatment, and higher processing costs of USD 850-1,100/ton on average. The average daily production of infectious waste is 1.8-2.4 kg per bed in European hospitals including 850,000 beds in the EU that generate about 2.1 million tons of waste per year. The infectious waste consists of pathological specimens, materials contaminated with blood materials, used sharps, microbiological cultures, and contaminated PPE that needs treatment to a 6-log microbial reduction. Increased generation of infectious waste, due to the use of masks, testing, and the need to control the infection, increased by 15-22% permanently after the COVID-19 pandemic. The cost of the treatment of infectious waste is 8-12 times more than that of general waste, which makes the special infectious waste management services market USD 2.4 billion in Europe.
By Treatment Method
Why Autoclaving Shows Fastest Growth?
Autoclaving is projected to have the highest CAGR of 8.6%age per 2026-2035 due to the nature of environmental benefits such as zero dioxin emissions as compared to incineration, low operation costs of USD 180-320 per ton as compared to USD 450-800 in the case of incineration and the increasing regulations on the capacity of incinerators. The European autoclave market has placed 340+ in the period between 2019-2024 with Germany with 89 systems, France with 52 and the UK with 48. In modern autoclaves, 99.9999% microbial killing rates are attained, 500-2,000 kg of waste is processed per cycle and sterilized waste is produced that can be used in landfills or as energy. Life cycle assessment demonstrates that autoclaving produces fewer greenhouse gas emissions (65-78% of incineration), which is in line with EU climate targets. Market leader GIENT has provided 180 European plants with autoclaves, whose throughputs have reached 12,000 tons per year at central facilities.
By Service Type
Why Collection & Transportation Dominates?
Collection and transportation services have a market share of 39%, as they provide the logistic needs to provide safe transportation services for hazardous medical waste between the generation and treatment factors without violating the regulatory necessities. The service segment brought in USD 1.88 billion in revenue in 2025, with 2,850 specialized collection vehicles provided by the providers in Europe. Collection frequency depends on the size of the hospital; large hospitals producing more than 500 kg are most commonly picked up daily, and small clinics producing less than 50 kg weekly with route optimization cut down on costs by 18-28%. The safe transport is ensured by the use of special containers that fulfill the UN 3291 packaging requirements, GPS tracking devices, and ADR certified trained drivers. Collection fees are between USD 85-165 per pickup, with varying prices depending on the volume, distance, and type of waste, with premium services for radioactive or cytotoxic waste standing at USD 250-450.
Report Scope
| Feature of the Report | Details |
| Market Size in 2026 | USD 5.18 billion |
| Projected Market Size in 2035 | USD 8.95 billion |
| Market Size in 2025 | USD 4.82 billion |
| CAGR Growth Rate | 7.3% CAGR |
| Base Year | 2025 |
| Forecast Period | 2026-2035 |
| Key Segment | By Waste Type, Treatment Method, Service Type, Source and Region |
| Report Coverage | Revenue Estimation and Forecast, Company Profile, Competitive Landscape, Growth Factors and Recent Trends |
| Regional Scope | Europe |
| Buying Options | Request tailored purchasing options to fulfil your requirements for research. |
Country Wise Analysis
Germany Market Dominance
Germany dominates with 24% market share of USD 1.16 billion in the year 2025 due to the largest healthcare system in Europe, which has 1,900 hospitals, 28,000 outpatient clinics, and 21,000 pharmacies that produce 1.8 million tons of medical waste per annum. KrWG (Circular Economy Act) waste regulations enforce thorough waste segregation and tracking; 15 types of waste have to be handled specifically. Germany has 68 centralized treatment plants comprising 42 autoclaves, 18 incinerators, and 8 microwave units, with REMONDIS having 28% market share that handles 285,000 tons per year. Recycling is promoted by the attention paid to the circular economy in the country, where 15% of medical waste is recovered in order to be used as a material or energy source. High environmental standards and labor costs are reflected in the average treatment costs of USD 950 per ton of infectious waste.
United Kingdom Market Trends
The UK market has a target of USD 820 million in 2025 with the transitioning process after the brexit with waste shipment regulations influencing exports to EU treatment plants. In England, 580,000 tons of medical waste and 38% of that is infectious waste is generated in the hospitals of NHS. The nation has 35 treatment facilities that mostly use autoclaving and other technologies, and the incineration capacity has been decreased by 40% since 2015 because of environmental regulations. The new regulation of healthcare waste in 2020 requires a higher level of segregation, including color-coded streams and electronic monitoring. The dominance is in the private sector, where PHS Group, SRCL Limited, and Rentokil control 62% of the market share. The changes mentioned with Brexit also made compliance expenses more expensive by up to USD 45-85 million per year due to documentation and decreased treatment facility choices.
France Market Developments
The market in France with USD 780 million in 2025 has the advantage of centralized healthcare system that coordinates with waste management programs. The total amount of medical waste produced by the French hospitals is 720,000 tons, and 245,000 tons of DASRI (hazardous medical waste) is to be treated using special facilities. Combined market share of SUEZ and Veolia is at 54%, and the two have 27 treatment plants across the country. The first pharmaceutical waste recycling initiative was developed in France by the Cyclamed program, which collected 11200 tons of waste in 2024, with 67 energy recovery and 33 material recycling. The French law requires a waste management plan, an annual report, and certification of the staff of healthcare facilities. Competitive market and effective infrastructure have been reflected in the average treatment expenses of USD 820 per ton. Medical device reprocessing in the country is the most advanced in Europe, and 78 approved plants save USD 68 million a year.
Eastern Europe Growth Markets
The countries with high regional growth are Poland, the Czech Republic, and Romania, with a CAGR of 9.8% due to modernization of healthcare facilities, alignment on EU standards, and foreign investment in waste management. The market in Poland was USD 285 million in 2025 and was increasing at a rate of 11.2% per annum as 940 hospitals transition to waste management to comply with EU directives. The Czech Republic enjoys the advantages of a central location with the ability to cross-border waste flows, and it receives 45,000 tons of waste treatment in its facilities coming from Austria and Germany. The market in Romania increases at a rate of 13.4% with a low base, and the EU structural funds are funding the upgrades of 18 treatment facilities and 5 new constructions since 2020. The average cost of treatment in Eastern Europe is USD 420-680 per ton, 30-45% less than in Western Europe, and will encourage imports of waste in legal markets and domestic growth capacity in the hope of increased domestic generation.
Top Players in the Market and Their Offerings
- REMONDIS SE & Co. KG
- Veolia Environnement S.A.
- SUEZ
- Stericycle International LLC
- Sharpsmart Europe
- PHS Group Limited
- Rentokil Initial plc
- SRCL Limited
- Sanpro Waste Solutions
- Econocom Group
- Others
Key Developments
- In March 2025: SUEZ launched an AI-powered waste tracking platform across a French hospital network covering 180 facilities, reducing documentation time by 65% and achieving 99.8% regulatory compliance through automated reporting.
- In April 2025: European Commission proposed a revised Medical Waste Directive mandating 25% waste reduction targets by 2030, enhanced recycling requirements, and standardized digital tracking systems across all member states by 2028.
These strategic activities have allowed companies to strengthen market positions, expand treatment capacity, enhance technological capabilities, and capitalize on growth opportunities within the evolving European medical waste management market.
The Europe Medical Waste Management Market is segmented as follows:
By Waste Type
- Infectious Waste
- Hazardous Waste
- Pharmaceutical Waste
- Chemical Waste
- Cytotoxic Waste
- Radioactive Waste
- General Waste
- Others
By Treatment Method
- Incineration
- Autoclaving
- Chemical Disinfection
- Microwave Treatment
- Irradiation
- Others
By Service Type
- Collection & Transportation
- Treatment & Disposal
- Recycling & Recovery
- Consulting & Training
- Others
By Source
- Hospitals
- Clinics & Physician Offices
- Diagnostic Laboratories
- Pharmaceutical & Biotechnology Companies
- Research Institutes
- Long-term Care Facilities
- Others
Regional Coverage:
Europe
- Germany
- France
- U.K.
- Russia
- Italy
- Spain
- Netherlands
- Rest of Europe
Table of Contents
- Chapter 1. Report Introduction
- 1.1. Report Description
- 1.1.1. Purpose of the Report
- 1.1.2. USP & Key Offerings
- 1.2. Key Benefits For Stakeholders
- 1.3. Target Audience
- 1.4. Report Scope
- 1.1. Report Description
- Chapter 2. Market Overview
- 2.1. Report Scope (Segments And Key Players)
- 2.1.1. Medical Waste Management by Segments
- 2.1.2. Medical Waste Management by Region
- 2.2. Executive Summary
- 2.2.1. Market Size & Forecast
- 2.2.2. Medical Waste Management Market Attractiveness Analysis, By Waste Type
- 2.2.3. Medical Waste Management Market Attractiveness Analysis, By Treatment Method
- 2.2.4. Medical Waste Management Market Attractiveness Analysis, By Service Type
- 2.2.5. Medical Waste Management Market Attractiveness Analysis, By Source
- 2.1. Report Scope (Segments And Key Players)
- Chapter 3. Market Dynamics (DRO)
- 3.1. Market Drivers
- 3.1.1. Stringent EU Regulatory Framework and Compliance Requirements
- 3.1.2. Aging Population and Increasing Healthcare Utilization
- 3.2. Market Restraints
- 3.3. Market Opportunities
- 3.5. Pestle Analysis
- 3.6. Porter Forces Analysis
- 3.7. Technology Roadmap
- 3.8. Value Chain Analysis
- 3.9. Government Policy Impact Analysis
- 3.10. Pricing Analysis
- 3.1. Market Drivers
- Chapter 4. Medical Waste Management Market – By Waste Type
- 4.1. Waste Type Market Overview, By Waste Type Segment
- 4.1.1. Medical Waste Management Market Revenue Share, By Waste Type, 2026 & 2035
- 4.1.2. Infectious Waste
- 4.1.3. Medical Waste Management Share Forecast, By Region (USD Billion)
- 4.1.4. Comparative Revenue Analysis, By Country, 2026 & 2035
- 4.1.5. Key Market Trends, Growth Factors, & Opportunities
- 4.1.6. Hazardous Waste
- 4.1.7. Medical Waste Management Share Forecast, By Region (USD Billion)
- 4.1.8. Comparative Revenue Analysis, By Country, 2026 & 2035
- 4.1.9. Key Market Trends, Growth Factors, & Opportunities
- 4.1.10. Radioactive Waste
- 4.1.11. Medical Waste Management Share Forecast, By Region (USD Billion)
- 4.1.12. Comparative Revenue Analysis, By Country, 2026 & 2035
- 4.1.13. Key Market Trends, Growth Factors, & Opportunities
- 4.1.14. General Waste
- 4.1.15. Medical Waste Management Share Forecast, By Region (USD Billion)
- 4.1.16. Comparative Revenue Analysis, By Country, 2026 & 2035
- 4.1.17. Key Market Trends, Growth Factors, & Opportunities
- 4.1.18. Others
- 4.1.19. Medical Waste Management Share Forecast, By Region (USD Billion)
- 4.1.20. Comparative Revenue Analysis, By Country, 2026 & 2035
- 4.1.21. Key Market Trends, Growth Factors, & Opportunities
- 4.1. Waste Type Market Overview, By Waste Type Segment
- Chapter 5. Medical Waste Management Market – By Treatment Method
- 5.1. Treatment Method Market Overview, By Treatment Method Segment
- 5.1.1. Medical Waste Management Market Revenue Share, By Treatment Method, 2026 & 2035
- 5.1.2. Incineration
- 5.1.3. Medical Waste Management Share Forecast, By Region (USD Billion)
- 5.1.4. Comparative Revenue Analysis, By Country, 2026 & 2035
- 5.1.5. Key Market Trends, Growth Factors, & Opportunities
- 5.1.6. Autoclaving
- 5.1.7. Medical Waste Management Share Forecast, By Region (USD Billion)
- 5.1.8. Comparative Revenue Analysis, By Country, 2026 & 2035
- 5.1.9. Key Market Trends, Growth Factors, & Opportunities
- 5.1.10. Chemical Disinfection
- 5.1.11. Medical Waste Management Share Forecast, By Region (USD Billion)
- 5.1.12. Comparative Revenue Analysis, By Country, 2026 & 2035
- 5.1.13. Key Market Trends, Growth Factors, & Opportunities
- 5.1.14. Microwave Treatment
- 5.1.15. Medical Waste Management Share Forecast, By Region (USD Billion)
- 5.1.16. Comparative Revenue Analysis, By Country, 2026 & 2035
- 5.1.17. Key Market Trends, Growth Factors, & Opportunities
- 5.1.18. Irradiation
- 5.1.19. Medical Waste Management Share Forecast, By Region (USD Billion)
- 5.1.20. Comparative Revenue Analysis, By Country, 2026 & 2035
- 5.1.21. Key Market Trends, Growth Factors, & Opportunities
- 5.1.22. Others
- 5.1.23. Medical Waste Management Share Forecast, By Region (USD Billion)
- 5.1.24. Comparative Revenue Analysis, By Country, 2026 & 2035
- 5.1.25. Key Market Trends, Growth Factors, & Opportunities
- 5.1. Treatment Method Market Overview, By Treatment Method Segment
- Chapter 6. Medical Waste Management Market – By Service Type
- 6.1. Service Type Market Overview, By Service Type Segment
- 6.1.1. Medical Waste Management Market Revenue Share, By Service Type, 2026 & 2035
- 6.1.2. Collection & Transportation
- 6.1.3. Medical Waste Management Share Forecast, By Region (USD Billion)
- 6.1.4. Comparative Revenue Analysis, By Country, 2026 & 2035
- 6.1.5. Key Market Trends, Growth Factors, & Opportunities
- 6.1.6. Treatment & Disposal
- 6.1.7. Medical Waste Management Share Forecast, By Region (USD Billion)
- 6.1.8. Comparative Revenue Analysis, By Country, 2026 & 2035
- 6.1.9. Key Market Trends, Growth Factors, & Opportunities
- 6.1.10. Recycling & Recovery
- 6.1.11. Medical Waste Management Share Forecast, By Region (USD Billion)
- 6.1.12. Comparative Revenue Analysis, By Country, 2026 & 2035
- 6.1.13. Key Market Trends, Growth Factors, & Opportunities
- 6.1.14. Consulting & Training
- 6.1.15. Medical Waste Management Share Forecast, By Region (USD Billion)
- 6.1.16. Comparative Revenue Analysis, By Country, 2026 & 2035
- 6.1.17. Key Market Trends, Growth Factors, & Opportunities
- 6.1.18. Others
- 6.1.19. Medical Waste Management Share Forecast, By Region (USD Billion)
- 6.1.20. Comparative Revenue Analysis, By Country, 2026 & 2035
- 6.1.21. Key Market Trends, Growth Factors, & Opportunities
- 6.1. Service Type Market Overview, By Service Type Segment
- Chapter 7. Medical Waste Management Market – By Source
- 7.1. Source Market Overview, By Source Segment
- 7.1.1. Medical Waste Management Market Revenue Share, By Source, 2026 & 2035
- 7.1.2. Hospitals
- 7.1.3. Medical Waste Management Share Forecast, By Region (USD Billion)
- 7.1.4. Comparative Revenue Analysis, By Country, 2026 & 2035
- 7.1.5. Key Market Trends, Growth Factors, & Opportunities
- 7.1.6. Clinics & Physician Offices
- 7.1.7. Medical Waste Management Share Forecast, By Region (USD Billion)
- 7.1.8. Comparative Revenue Analysis, By Country, 2026 & 2035
- 7.1.9. Key Market Trends, Growth Factors, & Opportunities
- 7.1.10. Diagnostic Laboratories
- 7.1.11. Medical Waste Management Share Forecast, By Region (USD Billion)
- 7.1.12. Comparative Revenue Analysis, By Country, 2026 & 2035
- 7.1.13. Key Market Trends, Growth Factors, & Opportunities
- 7.1.14. Pharmaceutical & Biotechnology Companies
- 7.1.15. Medical Waste Management Share Forecast, By Region (USD Billion)
- 7.1.16. Comparative Revenue Analysis, By Country, 2026 & 2035
- 7.1.17. Key Market Trends, Growth Factors, & Opportunities
- 7.1.18. Research Institutes
- 7.1.19. Medical Waste Management Share Forecast, By Region (USD Billion)
- 7.1.20. Comparative Revenue Analysis, By Country, 2026 & 2035
- 7.1.21. Key Market Trends, Growth Factors, & Opportunities
- 7.1.22. Long-term Care Facilities
- 7.1.23. Medical Waste Management Share Forecast, By Region (USD Billion)
- 7.1.24. Comparative Revenue Analysis, By Country, 2026 & 2035
- 7.1.25. Key Market Trends, Growth Factors, & Opportunities
- 7.1.26. Others
- 7.1.27. Medical Waste Management Share Forecast, By Region (USD Billion)
- 7.1.28. Comparative Revenue Analysis, By Country, 2026 & 2035
- 7.1.29. Key Market Trends, Growth Factors, & Opportunities
- Medical Waste Management Market – Regional Analysis
- 7.2. Medical Waste Management Market Overview, By Region Segment
- 7.2.1. Europe Medical Waste Management Market Revenue Share, By Region, 2026 & 2035
- 7.2.2. Europe Medical Waste Management Market Revenue, By Region, 2026 – 2035 (USD Billion)
- 7.2.3. Europe Medical Waste Management Market Revenue, By Waste Type, 2026 – 2035
- 7.2.4. Europe Medical Waste Management Market Revenue, By Treatment Method, 2026 – 2035
- 7.2.5. Europe Medical Waste Management Market Revenue, By Service Type, 2026 – 2035
- 7.2.6. Europe Medical Waste Management Market Revenue, By Source, 2026 – 2035
- 7.3. Europe
- 7.3.1. Europe Medical Waste Management Market Revenue, By Country, 2026 – 2035 (USD Billion)
- 7.3.2. Europe Medical Waste Management Market Revenue, By Waste Type, 2026 – 2035
- 7.3.3. Europe Medical Waste Management Market Revenue, By Treatment Method, 2026 – 2035
- 7.3.4. Europe Medical Waste Management Market Revenue, By Service Type, 2026 – 2035
- 7.3.5. Europe Medical Waste Management Market Revenue, By Source, 2026 – 2035
- 7.1. Source Market Overview, By Source Segment
- Chapter 8. Competitive Landscape
- 8.1. Company Market Share Analysis – 2025
- 8.1.1. Europe Medical Waste Management Market: Company Market Share, 2025
- 8.2. Europe Medical Waste Management Market Company Market Share, 2024
- 8.1. Company Market Share Analysis – 2025
- Chapter 9. Company Profiles
- 9.1. REMONDIS SE & Co. KG
- 9.1.1. Company Overview
- 9.1.2. Key Executives
- 9.1.3. Product Portfolio
- 9.1.4. Financial Overview
- 9.1.5. Operating Business Segments
- 9.1.6. Business Performance
- 9.1.7. Recent Developments
- 9.2. Veolia Environnement S.A.
- 9.3. SUEZ
- 9.4. Stericycle International LLC
- 9.5. Sharpsmart Europe
- 9.6. PHS Group Limited
- 9.7. Rentokil Initial plc
- 9.8. SRCL Limited
- 9.9. Sanpro Waste Solutions
- 9.10. Econocom Group
- 9.11. Others
- 9.1. REMONDIS SE & Co. KG
- Chapter 10. Research Methodology
- 10.1. Research Methodology
- 10.2. Secondary Research
- 10.3. Primary Research
- 10.3.1. Analyst Tools and Models
- 10.4. Research Limitations
- 10.5. Assumptions
- 10.6. Insights From Primary Respondents
- 10.7. Why Custom Market Insights
- Chapter 11. Standard Report Commercials & Add-Ons
- 11.1. Customization Options
- 11.2. Subscription Module For Market Research Reports
- 11.3. Client Testimonials
List Of Figures
1 to 37
List Of Tables
1 to 6
Prominent Player
- REMONDIS SE & Co. KG
- Veolia Environnement S.A.
- SUEZ
- Stericycle International LLC
- Sharpsmart Europe
- PHS Group Limited
- Rentokil Initial plc
- SRCL Limited
- Sanpro Waste Solutions
- Econocom Group
- Others
FAQs
The key players in the market are REMONDIS SE & Co. KG, Veolia Environnement S.A., SUEZ, Stericycle International LLC, Sharpsmart Europe, PHS Group Limited, Rentokil Initial plc, SRCL Limited, Sanpro Waste Solutions, Econocom Group, Others.
The regulations have significant influence with the EU Waste Framework Directive, which set waste hierarchy and hazardous waste, the Landfill Directive which has banned disposal of untreated medical waste, the Hospital Waste Directive, which has promoted source segregation and tracking at the point of origin, national regulations of USD 10,000-500,000 as penalties for violations, and the Circular Economy Action Plan encouraging recycling rates and sustainability. The hazardous waste has a compliance cost average that is USD 800-1,200 per ton, as compared to general waste that has USD 80-150, which means this is a big marketplace where the services of specialization are required.
It is projected that the market will reach USD 8.95 billion in 2035 at a CAGR rate of 7.3% between 2026-2035 due to the aging population, which is increasing healthcare demand, the increasing capacity of treatment in Eastern Europe, the adoption of newer technologies such as digital tracking and robotic sorting, the implementation of the circular economy, and the integration of energy recovery that is supporting the utilization of waste to energy.
Germany is a leader with a 24% share worth USD 1.16 billion in 2025 due to the largest healthcare system in Europe that creates 1.8 million tons of medical waste per annum, 68% specialized treatment plants that offer full coverage, strict regulation under KrWG mandating advanced segregation and tracking and a high focus on the circular economy, with a high rate of 15% waste recovery above the EU average of 8%.
The fastest growth is shown in Eastern Europe with a CAGR of 9.8% in 2026-2035 due to healthcare infrastructure modernization with investments in EU structural funds, the alignment of regulations with EU waste directives that demand upgrade of their facilities, lowering treatment costs by 30-45% that attract cross-border waste flows, and increasing utilization of healthcare in the countries due to expansion of hospital capacity in Poland, the Czech Republic, and Romania by 15-25%.
The Europe Medical Waste Management Market has been growing because of the strict EU regulations such as the Waste Framework Directive and Landfill Directive which require special treatment, the aging population, 21.3% of whom are over 65 years old and generate more healthcare consumption; the 8.5 million tons of medical waste every year among which 2.8 million tons are hazardous and will require special treatment and the circular economy which aims at 65% recycling by 2035 and technological advances in autoclaving and alternative treatment solutions that save costs of 30-45%.