Electronic Grade Hydrofluoric Acid Market Size, Trends and Insights By Grade (EL Grade (Electronic Grade), UP Grade (Ultra Pure), UP-S Grade (Ultra Pure Special), UP-SS Grade (Ultra Pure Super Special), SEMI Grade), By Application (Semiconductor Etching, Silicon Dioxide Etching, Native Oxide Removal, Sacrificial Layer Etching, LCD & Display Panel Manufacturing, Solar Cell Fabrication, Wafer Texturing, PSG Removal, HJT Surface Preparation, Printed Circuit Boards, Other Applications), By End Use Industry (Semiconductor & IC Fabrication, Display & Optoelectronics, Photovoltaics, Electronics Manufacturing, Other End Uses), and By Region - Global Industry Overview, Statistical Data, Competitive Analysis, Share, Outlook, and Forecast 2026 – 2035
Report Snapshot
CAGR: 11.4%
| Study Period: | 2026-2035 |
| Fastest Growing Market: | North America |
| Largest Market: | Asia Pacific |
Major Players
- Stella Chemifa Corporation
- Daikin Industries Ltd.
- Solvay S.A.
- Honeywell International Inc.
- Others
Reports Description
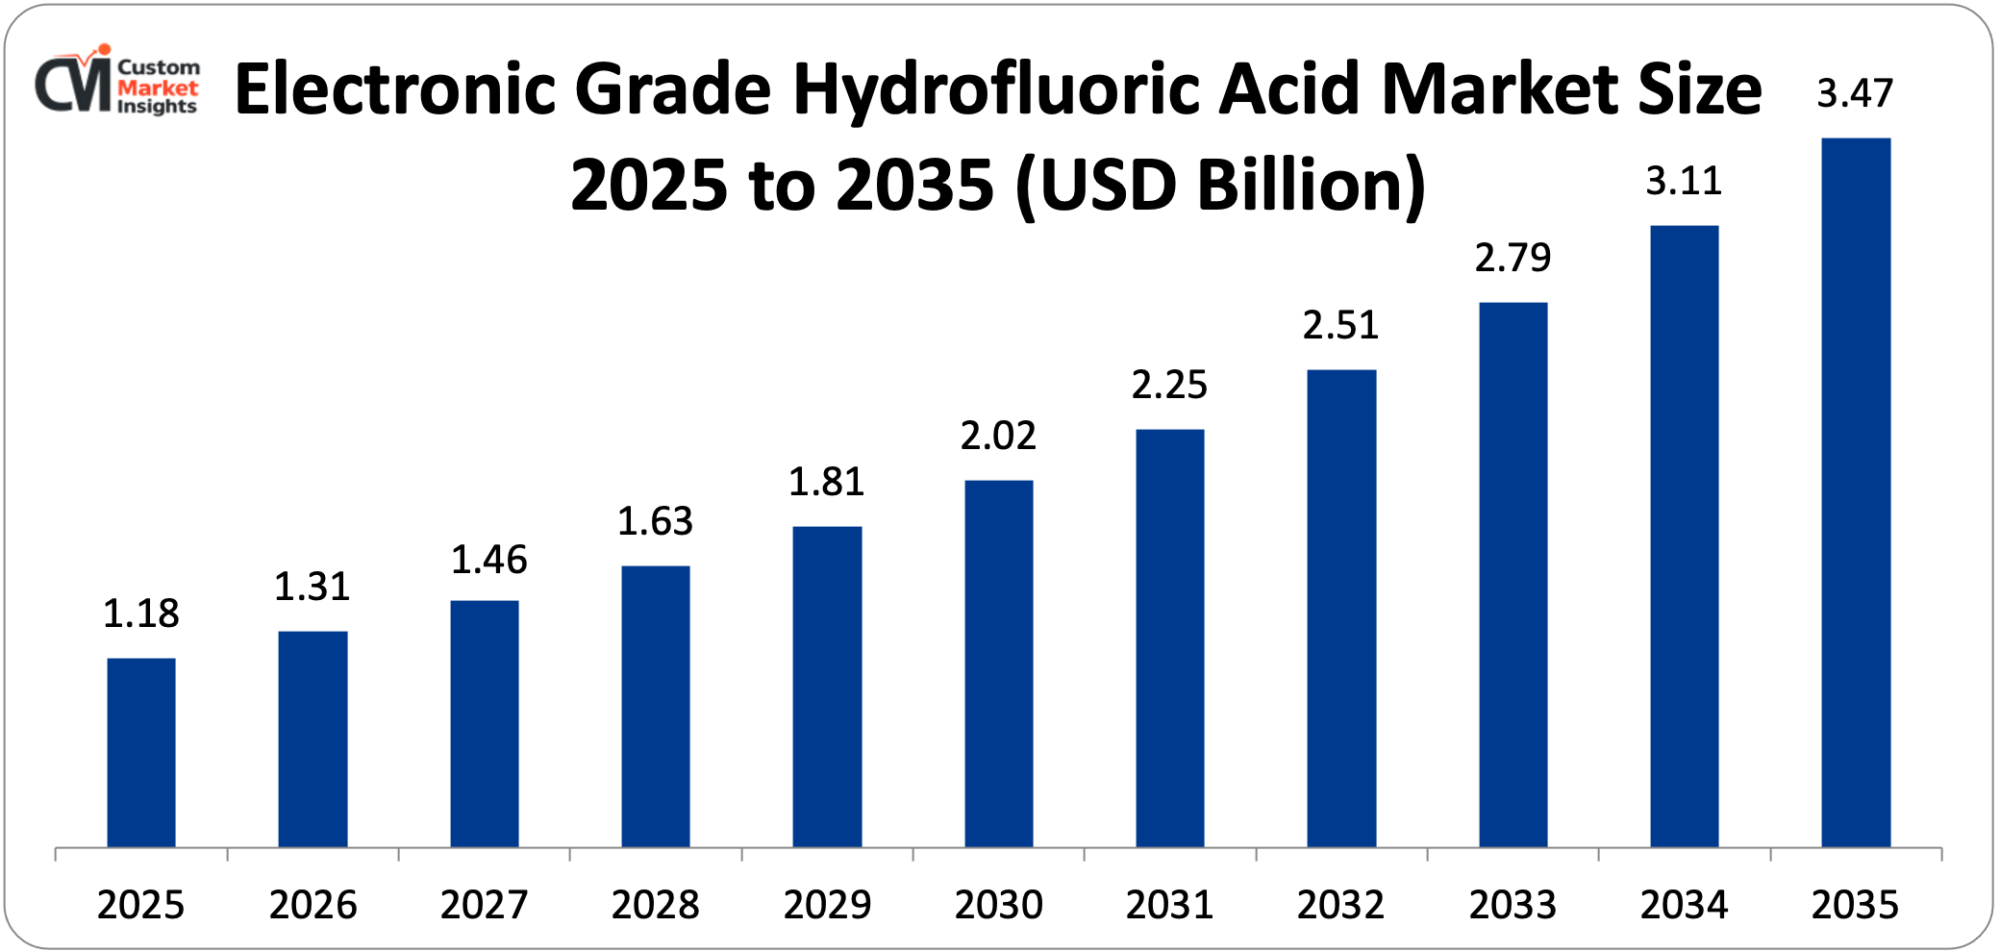
The world market size of the electronic grade hydrofluoric acid will be estimated at USD 1.31 billion in 2026, and is expected to grow to be about USD 3.47 billion in 2035 with a CAGR of 11.4% between 2026 and 2035. The booming global demand in semiconductors in automotive, artificial intelligence, consumer electronics, and industrial automating applications, combined with the rapid development of the capacity to fabricate wafer-based semiconductors in the Asia Pacific, North America, and Europe, the increasing complexity of chip architecture designs, which demand advanced wet etching chemistry, and the emerging development of solar photovoltaic manufacturing that demands silicon wafer surface treatment, are all driving market growth.
Market Highlight
- Asia Pacific was the most successful in the electronic grade hydrofluoric acid market, as it occupied a 67% market share in 2025.
- North America is the fastest-growing of the developed regions, likely to be 13.2% CAGR between 2026 and 2035, with domestic investment in semiconductor fabrication.
- The grade segment of UP-SS that was valued at grade had taken over about 31% of the market share in 2025, owing to demand in leading-edge logic and memory chip fabrication.
- The UP-S grade segment, by grade, is increasing at the quickest CAGR of 14.1% between the years 2026 and 2035.
- By business, in 2025 semiconductor etching provided the largest market share of 48%, and the solar cell fabrication segment is likely to perform at the quickest CAGR of 15.6% during the forecasted period between 2026 and 2035.
- By end use, the semiconductor and IC fabrication industry had a leading 51% market revenue in 2025.
- Electronic grade hydrofluoric acid, representing about 14.3% of worldwide HF usage, is increasing faster in the electronic grade segment by an average of almost four times the amount of the industrial grade HF consumption.
Significant Growth Factors
The Electronic Grade Hydrofluoric Acid Market Trends present significant growth opportunities due to several factors:
- Accelerating Global Semiconductor Fabrication Capacity Expansion:
The largest and structurally sustainable driver of electronic grade hydrofluoric acid demand is the historic wave of semiconductor fabrication capacity investment in progress all over the world, spurred by the COVID-19-era chip scarcity, geopolitical consciousness of supply chain concentration, and the impending demand of artificial intelligence, computing, electric vehicles, 5G infrastructure, and enhanced consumer electronics. The Semiconductor Industry Association (SIA) reported that sales in the worldwide semiconductor industry were USD 627 billion in 2024, and USD 527 billion in 2023 with the industry expected to exceed USD 1 trillion every year by 2030. This growth in revenues is driven by the giant scale capital investment in new wafer fabrication plants (fabs): TSMC alone has committed USD 65 billion to capital spending in 2024, with Samsung, Intel, SK Hynix, Micron, and GlobalFoundries jointly spending hundreds of billions of dollars on new and expanded fabs in Taiwan, South Korea, the United States, Japan, Germany and India through 2030.
In August 2022, the U.S. CHIPS and Science Act offered USD 52.7 billion in domestic semiconductor manufacturing and research, with the CHIPS for America program granting initial agreements to TSMC, Intel, Samsung, Micron, and others, totaling more than USD 30 billion through 2025, stimulating an estimated USD 400 billion of total investment in semiconductor manufacturing in the United States by the private sector. The European Chips Act is also aimed at increasing the European production of semiconductors to 20% of the world by 2030, which would mean a total of more than EUR 43 billion in its public and private investment.
The annual quantities of electronic grade HF required by each new leading-edge logic fab, having an average capital cost of USD 15-25 billion, are large: 300mm wafer fab producing 50,000 wafer starts a month is typically expected to consume 200-400 metric tons of ultra-high purity HF each year, with consumption being more dependent on wafer starts and process complexity of the etching. The sum total effect of fabs already under construction around the world constitutes a structural step change in electronic grade HF demand, which is beginning to be realized over the next decade or so (2026-2030), to produce multi-year demand visibility, which is encouraging chemical suppliers to invest in new purification and distribution capacity.
- Rising Chip Architectural Complexity Driving HF Consumption per Wafer:
In addition to the increase in raw fabrication capacity, progressive scaling of semiconductor node geometries – to 7nm to 5nm to 3nm and below in logic, to 128-layer to 200+-layer 3D NAND in memory – brings about a concomitant increase in the number of process steps per wafer and the volume of electronic grade HF per unit of product. HF is also essential in semiconductor wet processing as a native oxide remover (pre-clean) before critical deposition processes, in MEMS silicon dioxide etching, contact formation, FinFET and Gate-All-Around transistor architectures, and wafer surface preparation before epitaxial growth.
The advanced logic chips produced in 3nm nodes are estimated to undergo 1,200–1,400 discrete process steps, as compared to 600–800 steps in 28nm planar CMOS, essentially doubling the wet chemical exposure per wafer, and 3D NAND flash memory, which uses active layers vertically instead of laterally is in 2019 is estimated to use 64 layers of active material, and in 2024 200 layers of active material, and in 2027 is hoped to have 3 The International Technology Roadmap for Semiconductors (ITRS) analysis shows that the amount of wet chemicals consumed by leading-edge logic processes per wafer grew by about 38% between 2018 and 2024, and electronic grade HF is amongst the most consumed wet chemicals. The aggregate effect of the increased number of fabs, the increased number of wafer starts, and the increasing number of HF-intensive process architectures is an effect of demand multiplier that is bringing the electronic grade HF market growth far above the headline semiconductor unit volume growth rates up to 2035.
What are the Major Advances Changing the Electronic Grade Hydrofluoric Acid Market Today?
- Ultra-High Purity Purification Technologies and Grade Escalation:
The most dramatic technological change in the electronic grade HF industry is the ongoing increase in purity requirements as semiconductor manufacturers move towards smaller nodes, at which even traces of trace metals in parts per trillion (ppt) may affect the yield and reliability of devices. The purity standards of electronic chemicals under the SEMI C30 standard and the international standards equivalent (e.g. IEC standard) describe the purity requirements of electronic chemicals of different grades; the highest grade, UP-SS (Ultra Pure Super Special), has a total metallic content of less than 100 ppt and individual critical impurities such as iron, copper, chromium, nickel, sodium, and potassium of less than 10 ppt each – specifications that are at the limit of the capability of analytical chemistry determinations. To attain such purity, multi-step purification and purification methods that incorporate fractional distillation, sub-boiling distillation, ion exchange purification, and point-of-use filtration using sub-10 nm membrane filters are needed and must be performed under ultra-clean Class 1 conditions using fluoropolymer-lined equipment to eliminate hardware surface contamination of metals.
Major electronic chemical manufacturers, such as Stella Chemifa, Daikin Industries, Solvay and Honeywell have invested heavily in next generation purification platforms that are specifically engineered to produce and reliably maintain levels of UP-SS and next generation, so-called “UP-SSS” grade purity required by TSMC N3, Samsung SF3 and Intel 18A process nodes. The UP-SS grade segment will capture 31% of the market in 2025 and will advance to 38% by 2035 as an increasing fraction of the HF volume is used in leading-edge fabs with 5 nm or less. Ultra-high purity HF packaging and logistics also demand high-purity fluoropolymer packages – small volume HDPE or PFA bottles and bulk-delivery containers with special linings – and cleanroom-compatible handling equipment to preserve purity requirements at least through to the point of use.
- Solar Photovoltaic Manufacturing Expansion Creating New High-Volume Demand:
The solar energy revolution is creating a pyramid of new and increasingly large-scale demand on electronic-grade HF, through operations of saw damage etching and PSG (phosphosilicate glass) removal that are critical to the production of crystalline silicon photovoltaic cells. The International Energy Agency (IEA) estimates the global solar PV capacity additions at a record high of 447 GW in 2024, more than twice the 228 GW of 2022, and estimates the capacity addition at more than 600 GW annually by 2027 in its main case scenario. China is a solar cell and module manufacturing powerhouse with about 80% of all manufacturing capacity worldwide, and its further growth, as giant producers such as LONGi Green Energy, Tongwei, JA Solar, and Trina Solar continue to announce capacity increases, is increasing incremental demand for electronic-grade HF in solar applications.
Top cell architecture designs such as TOPCon (Tunnel Oxide Passivated Contact), HJT (Heterojunction Technology), and perovskite-silicon tandem cells demand more complex wet chemistry than is available to conventional PERC cells, and HJT cells in particular demand an ultra-clean silicon surface preparation with highly pure HF to attain the required surface passivation quality needed to realize the efficiency advantage of these cells. The solar cell manufacturing segment is therefore the most rapidly expanding use, with a CAGR of 15.6% in 2026 to 2035 with the demand likely to constitute 22% of total electronic grade HF consumption in 2035 as compared to about 16% in 2025. Although the HF purity criteria required by solar-grade applications are generally not as demanding as the state-of-the-art semiconductor applications, the volume growth in solar production is generating a significant incremental demand base, and the tendency toward the increased use of more advanced cell architectures is gradually raising the purity level of the HF used in the solar business.
- Geopolitical Supply Chain Restructuring and Domestic Production Investment:
Both production and consumption are undergoing a structural change, brought about by geopolitical tensions, export control policies, and strategic industrial policy, which is rearranging the geography of both production and consumption. Traditionally, Japan has been the leading supplier of electronic grade HF to international semiconductor producers, with Japanese manufacturers such as Stella Chemifa, Daikin Industries, and Morita Chemical Industries owning a large portion of the world supply of ultra-high purity HF. The supply chain vulnerability caused by the geographic concentration of specialty chemical supply was graphically illustrated by Japan’s export controls on fluorine compounds and associated semiconductor chemicals, including restrictions announced in 2019, which impacted South Korean semiconductor manufacturers. Samsung and SK Hynix of South Korea responded by vigorously diversifying their HF supply chains, qualifying other suppliers in China, Europe, and Korea as local producers, and at the same time, intensively speeding up investment in local HF purification capability.
The Inflation Reduction Act in the United States and the CHIPS Act together contain clauses that assist the development of the domestic semiconductor material supply chain, and both Honeywell’s electronics chemicals business and Solvay’s semiconductor materials business are increasing their purification and distribution of the same in the U.S. Concurrently, China is making investments in local electronic grade HF capacity to decrease dependence on Japanese and Western imports, with such manufacturers as Fujian Yong Jing Chemical, Do-Fluoride Chemicals, and Juhua Group Corporation increasing their purification capacity, but higher purification levels than necessary to realize state-of-the-art applications are technically out of reach to newer entrants. This multipolar re-structuring of supply chains is broadening the overall installed base of electronic grade HF production capacity in the world but is also producing competitive dynamics that have slowly reduced the margins of established suppliers and is placing further investment in differentiation in the form of purity, technical service, and reliability in supply.
Category Wise Insights
By Grade
Why UP-SS Grade Leads the Market?
The UP-SS (Ultra Pure Super Special) grade segment is expected to have in 2025 about 31% of the total market share, which is the concentration of HF consumption volume in high-end semiconductor fabs with the highest requirements of purity. This grade is also available to the strictest SEMI C30-compliant specifications, with total metallic contamination of less than 100 ppt and individual metal contamination of less than 10 ppt, and is thus the necessary specification in 5 nm, 3 nm, and new 2 nm logic node manufacturing and in 200+ layer 3D NAND memory manufacturing at TSMC, Samsung Foundry, SMIC, and Intel Foundry Services. The semiconductor manufacturing economic geography of dominance by UP-SS grade is based on the fact that advanced nodes have a comparatively low proportion of the overall unit volume of wafer production but have a disproportionately large portion of HF consumption value due to greater consumption per unit of chemical, greater price per unit of chemical, and greater clustering of new fab investment in advanced nodes with the greatest competitive differentiation and the highest gross margin.
To manufacture the UP-SS grade HF, investment in multi-stage sub-boiling distillation and ion exchange purification hardware that is confined in Class 1 cleanroom facilities is required, and in- process analytical controls in inductively coupled plasma mass spectrometry (ICP-MS) allow constant monitoring to sub-ppt detection limits of critical metallic impurities. Vendors such as Stella Chemifa, who have supplied ultra-high purity HF to major Japanese and Taiwanese semiconductor manufacturers during the last 30 years, have proprietary know-how in purification processes, which is a major competitive moat, and customer qualification processes at advanced foundries often take 12–24 months of qualification runs and analytical correlation work before a new vendor receives approved vendor list status.
The UP-S grade is expanding at the highest CAGR of 14.1% between 2026 and 2035, owing to the extended use of advanced node fabrication by a wider group of manufacturers, such as mature process node fabs, which are increasingly upgrading chemical specifications, memory manufacturers increasing counts of 3D NAND layers; and new vendors in the field of semiconductor manufacturing in the United States, Europe, and India, where government subsidized fabs are under construction and use 5 nm and 3 nm processes.
By Application
Why Semiconductor Etching Dominates Electronic Grade HF Applications?
The largest application segment is Semiconductor etching operating at about 48% of the total market share in 2025. Such dominance is the manifestation of the essential and irreplaceable need of HF in silicon dioxide etching, one of the most commonly repeated process sequences in semiconductor fabrication. It is highly selective and controllable to react with SiO 2 and leave silicon substantially unreacted, which makes it uniquely useful and virtually irreplaceable in the entire chip fabrication process, though not just in native oxide removal, sacrificial oxide etching, gate oxide removal, formation of contacts, and inter-layer dielectric processing. In a state-of-the-art logic process, now doing 1,200+ steps, HF-based wet etching or vapor HF processing will be done on dozens of steps each, and the cumulative HF usage per wafer increases per new device architecture. The semiconductor etching market use is expected to be the biggest segment over the entire forecast period, increasing at a CAGR of 10.8% between the years 2026 and 2035, with the increased factory capacity to build wafer fabrication worldwide increasing the consumption of etch chemistry in line with it.
The second-largest use will be in LCD and display panel production at an estimated 19% of the market share in 2025 where electronic grade HF is used in glass substrate etching, thin-film transistor (TFT) layer processing, and panel thinning processes in the large-area display manufacturing. The segment demand is focused on China, South Korea, Japan, and Taiwan, where most of the manufacturing capacity of flat panel displays across the world is situated. Most of the display HF consumption is made up of BOE Technology, LG Display, Samsung Display, Sharp, and Japan Display. Solar cell fabrication, which is the subject of growth drivers, is the quickest-expanding application with the 15.6% CAGR, and the development of more advanced cell designs necessitates more complex HF-based surface treatment methods.
By End Use Industry
Why Semiconductor & IC Fabrication Dominates End Use?
The semiconductor and IC fabrication segment is leading in total, ninety-five percent of total electronic grade HF market revenue in 2025, because the segment has the highest needs for the highest purity grades at the highest volumes and thus its over-representative share of the market value per unit volume. This is where logic foundries, DRAM manufacturers, NAND flash manufacturers, analog and mixed-signal fabs, power semiconductor fabs, and compound semiconductor manufacturers fall, with very similar but strictly defined HF purity criteria. The capital expenditure cycle of the global semiconductor industry is one of the leading determinants of near-term electronic grade HF demand, as fab construction and tooling are among the periods of the highest HF consumption as new process lines are qualified and ramped. The World Semiconductor Trade Statistics (WSTS) organization reports that global semiconductor capex will reach about USD 185 billion in 2024, USD 210 billion in 2025 and remain above USD 200 billion per year until 2030, which will ensure a strong demand base of electronic grade HF and other wet chemistry materials.
The second-largest end use is the display and optoelectronics segment at about 22% of market revenue rate with the growing demand closely following the shipments of flat panel displays all over the globe and the progressive shift towards OLED display technology. Although in most cases OLED panel manufacture is not HF-intensive compared to LCD TFT processing on a unit area basis, manufacturing of indium tin oxide (ITO) electrodes and fine metal mask fabrication processes require high-purity HF.
Report Scope
| Feature of the Report | Details |
| Market Size in 2026 | USD 1.31 billion |
| Projected Market Size in 2035 | USD 3.47 billion |
| Market Size in 2025 | USD 1.18 billion |
| CAGR Growth Rate | 11.4% CAGR |
| Base Year | 2025 |
| Forecast Period | 2026-2035 |
| Key Segment | By Grade, Application, End Use Industry and Region |
| Report Coverage | Revenue Estimation and Forecast, Company Profile, Competitive Landscape, Growth Factors and Recent Trends |
| Regional Scope | North America, Europe, Asia Pacific, Middle East & Africa, and South & Central America |
| Buying Options | Request tailored purchasing options to fulfil your requirements for research. |
Regional Analysis
How Big is the Asia Pacific Market Size?
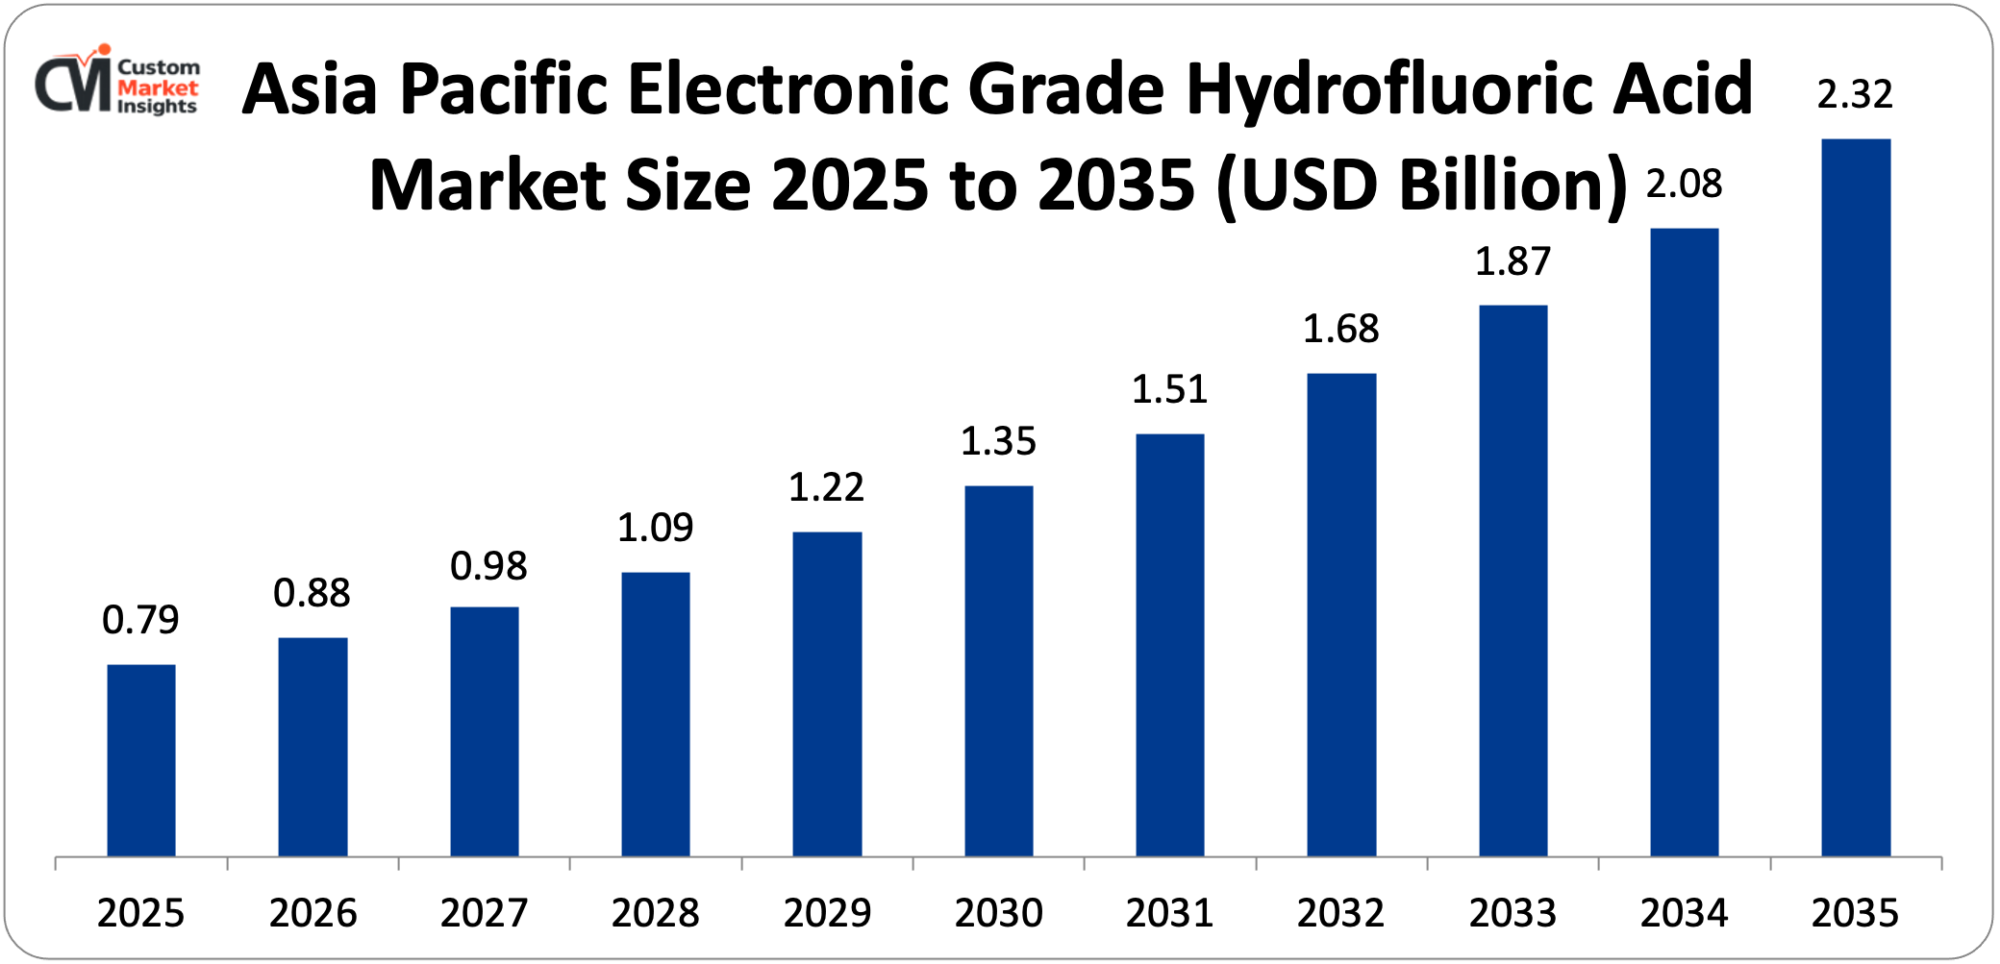
The Asia Pacific electronic grade hydrofluoric acid market size is estimated at USD 791 million in 2025 and is projected to reach approximately USD 2.32 billion by 2035, with a CAGR of 11.4% from 2026 to 2035.
Why did Asia Pacific Dominate the Market in 2025?
In 2025, Asia Pacific has the HF market revenue of the electronic grade market of about 67%, a market share that is a direct result of the concentration of semiconductor, display manufacturing and solar production facilities in the region. The total semiconductor wafer fabrication capacity of Taiwan, South Korea, Japan, and China has been the overwhelming majority of the global semiconductor sector, and TSMC alone has a greater share in the world of the most advanced logic chip production than 90%, with Samsung and SK Hynix having a combined share of more than 60% of the global DRAM capacity. The role of China is complex: on the one hand, it is the largest consumer of electronic grade HF in the whole world with its large display, solar and growing domestic semiconductor manufacturing capacity; on the other hand, it is becoming the largest domestic producer with growing purification capacity of Fujian Yong Jing, Do-Fluoride, and other manufacturers. South Korea is also remarkably unique with its highly advanced domestic electronic chemicals supply chain, with domestic manufacturers like Solvay Korea and OCI Company able to compete with Japanese suppliers to supply electronic grade HF to Samsung and leading-edge memory fabs of SK Hynix. Although its contribution to world semiconductor output has sharply fallen, Japan is an important supplier of ultra-high degree of purity HF, worldwide, via Stella Chemifa and Daikin, with the Japanese export regulation policy having shown potential to cause major supply shocks to its reliant manufacturers in South Korea and elsewhere.
Why is North America Experiencing the Fastest Growth Among Developed Regions?
Among developed regions, North America is growing its CAGR at the fastest rate of 13.2% between 2026 and 2035 due to the semiconductor fab boom building per the CHIPS Act across the United States, which is generating new domestic demand for electronic-grade HF where none existed on a meaningful scale. New TSMC plants in Phoenix, Arizona; Intel plants in Ohio and Arizona; Samsung plants in Taylor, Texas; and Micron plants in upstate New York constitute a structural addition to the electronic grade HF consumption in North America that is proving to attract chemical suppliers to develop local distribution, purification, and logistics services to satisfy such plants. The U.S. electronic grade HF market is projected to grow to USD 138 million in 2025 with a projected growth of about USD 498 million in 2035, the best growth of any single country market out of Asia Pacific.
Why is Europe Investing in Electronic Grade HF Capabilities?
Europe constitutes about 7% of the electronic grade HF market revenue of the world in 2025, worth about USD 83 million, yet the objective of the European Chips Act to increase Europe’s share of global semiconductor production to 20% of the worldwide production by 2030 is likely to precipitate high demand growth. In 2027, TSMC intends to start production at its Dresden fab, its first European wafer fabrication plant, which is developed with the German government and local industrial partners; in 2027, Intel is planning its Magdeburg megafab, and Infineon is expanding its Dresden facility, among other things, to increase European wafer fabrication capacity. European chemical manufacturers such as Solvay (Belgium) and Derivados del Fluor (Spain) have developed electronic-grade fluorine chemistry competencies that would allow them to supply regional fabs, and European semiconductor manufacturers have traditionally qualified European supply chains where technically possible in order to decrease the geopolitical risk of supply concentration.
Why is the Middle East & Africa Region an Emerging Opportunity?
The LAMEA zone is a developing, though strategically forming, trend, and the United Arab Emirates and Saudi Arabia are investing in semiconductor and electronics production as part of their economic diversification plans. Electronics manufacturing components are part of the newly developed semiconductor strategy of the UAE and Saudi Arabia’s plans of industrial development through its Vision 2030 plans. The most significant near-term growth market in the wider LAMEA picture is India, where Tata Electronics, Foxconn, and Micron plan to commence semiconductor and display manufacturing operations in Gujarat and Karnataka, with the India Semiconductor Mission investing USD 10 billion to incentivize local chip fabrication, assembly, and testing capabilities.
Top Players in the Market and Their Offerings
- Stella Chemifa Corporation
- Daikin Industries Ltd.
- Solvay S.A.
- Honeywell International Inc.
- Morita Chemical Industries Co. Ltd.
- Do-Fluoride Chemicals Co. Ltd.
- Fujian Yong Jing Chemical Co. Ltd.
- Juhua Group Corporation
- Mexichem Fluor (Orbia)
- Air Products and Chemicals Inc.
- Others
Key Developments
The market has undergone significant developments as industry participants seek to expand capabilities and enhance product portfolios.
- In February 2025: Stella Chemifa Corporation announced an upgrade of its ultra-high purity HF purification capacity at its Osaka Prefecture plant due to the growing demand in the TSMC North America business and expected demand in the new European fabs, with the expanded capacity targeting UP-SS and emerging next-generation purity grades required for 2 nm and below process nodes.
- In January 2025: Do-Fluoride Chemicals Co., Ltd. is involved in the successful qualification of its UP-S grade electronic HF product on a 200 or more layer process line at a major Chinese NAND flash manufacturer, a major progress in the local Chinese electronic grade HF supply chain capability, and a decreased reliance on Japanese imports in the advanced memory manufacturing processes.
These strategic activities have allowed companies to strengthen market positions, expand geographic supply reach, enhance purity grade capabilities, and capitalize on the structural demand growth being created by the global semiconductor fab construction wave and the accelerating solar energy transition.
The Electronic Grade Hydrofluoric Acid Market is segmented as follows:
By Grade
- EL Grade (Electronic Grade)
- UP Grade (Ultra Pure)
- UP-S Grade (Ultra Pure Special)
- UP-SS Grade (Ultra Pure Super Special)
- SEMI Grade
By Application
- Semiconductor Etching
- Silicon Dioxide Etching
- Native Oxide Removal
- Sacrificial Layer Etching
- LCD & Display Panel Manufacturing
- Solar Cell Fabrication
- Wafer Texturing
- PSG Removal
- HJT Surface Preparation
- Printed Circuit Boards
- Other Applications
By End Use Industry
- Semiconductor & IC Fabrication
- Display & Optoelectronics
- Photovoltaics
- Electronics Manufacturing
- Other End Uses
Regional Coverage:
North America
- U.S.
- Canada
- Mexico
- Rest of North America
Europe
- Germany
- France
- U.K.
- Russia
- Italy
- Spain
- Netherlands
- Rest of Europe
Asia Pacific
- China
- Japan
- India
- New Zealand
- Australia
- South Korea
- Taiwan
- Rest of Asia Pacific
The Middle East & Africa
- Saudi Arabia
- UAE
- Egypt
- Kuwait
- South Africa
- Rest of the Middle East & Africa
Latin America
- Brazil
- Argentina
- Rest of Latin America
Table of Contents
- Chapter 1. Report Introduction
- 1.1. Report Description
- 1.1.1. Purpose of the Report
- 1.1.2. USP & Key Offerings
- 1.2. Key Benefits For Stakeholders
- 1.3. Target Audience
- 1.4. Report Scope
- 1.1. Report Description
- Chapter 2. Market Overview
- 2.1. Report Scope (Segments And Key Players)
- 2.1.1. Electronic Grade Hydrofluoric Acid by Segments
- 2.1.2. Electronic Grade Hydrofluoric Acid by Region
- 2.2. Executive Summary
- 2.2.1. Market Size & Forecast
- 2.2.2. Electronic Grade Hydrofluoric Acid Market Attractiveness Analysis, By Grade
- 2.2.3. Electronic Grade Hydrofluoric Acid Market Attractiveness Analysis, By Application
- 2.2.4. Electronic Grade Hydrofluoric Acid Market Attractiveness Analysis, By End Use Industry
- 2.1. Report Scope (Segments And Key Players)
- Chapter 3. Market Dynamics (DRO)
- 3.1. Market Drivers
- 3.1.1. Accelerating Global Semiconductor Fabrication Capacity Expansion
- 3.1.2. Rising Chip Architectural Complexity Driving HF Consumption per Wafer
- 3.2. Market Restraints
- 3.3. Market Opportunities
- 3.5. Pestle Analysis
- 3.6. Porter Forces Analysis
- 3.7. Technology Roadmap
- 3.8. Value Chain Analysis
- 3.9. Government Policy Impact Analysis
- 3.10. Pricing Analysis
- 3.1. Market Drivers
- Chapter 4. Electronic Grade Hydrofluoric Acid Market – By Grade
- 4.1. Grade Market Overview, By Grade Segment
- 4.1.1. Electronic Grade Hydrofluoric Acid Market Revenue Share, By Grade, 2025 & 2035
- 4.1.2. EL Grade (Electronic Grade)
- 4.1.3. Electronic Grade Hydrofluoric Acid Share Forecast, By Region (USD Billion)
- 4.1.4. Comparative Revenue Analysis, By Country, 2025 & 2035
- 4.1.5. Key Market Trends, Growth Factors, & Opportunities
- 4.1.6. UP Grade (Ultra Pure)
- 4.1.7. Electronic Grade Hydrofluoric Acid Share Forecast, By Region (USD Billion)
- 4.1.8. Comparative Revenue Analysis, By Country, 2025 & 2035
- 4.1.9. Key Market Trends, Growth Factors, & Opportunities
- 4.1.10. UP-S Grade (Ultra Pure Special)
- 4.1.11. Electronic Grade Hydrofluoric Acid Share Forecast, By Region (USD Billion)
- 4.1.12. Comparative Revenue Analysis, By Country, 2025 & 2035
- 4.1.13. Key Market Trends, Growth Factors, & Opportunities
- 4.1.14. UP-SS Grade (Ultra Pure Super Special)
- 4.1.15. Electronic Grade Hydrofluoric Acid Share Forecast, By Region (USD Billion)
- 4.1.16. Comparative Revenue Analysis, By Country, 2025 & 2035
- 4.1.17. Key Market Trends, Growth Factors, & Opportunities
- 4.1.18. SEMI Grade
- 4.1.19. Electronic Grade Hydrofluoric Acid Share Forecast, By Region (USD Billion)
- 4.1.20. Comparative Revenue Analysis, By Country, 2025 & 2035
- 4.1.21. Key Market Trends, Growth Factors, & Opportunities
- 4.1. Grade Market Overview, By Grade Segment
- Chapter 5. Electronic Grade Hydrofluoric Acid Market – By Application
- 5.1. Application Market Overview, By Application Segment
- 5.1.1. Electronic Grade Hydrofluoric Acid Market Revenue Share, By Application, 2025 & 2035
- 5.1.2. Semiconductor Etching
- 5.1.2.1. Silicon Dioxide Etching
- 5.1.2.2. Native Oxide Removal
- 5.1.2.3. Sacrificial Layer Etching
- 5.1.3. Electronic Grade Hydrofluoric Acid Share Forecast, By Region (USD Billion)
- 5.1.4. Comparative Revenue Analysis, By Country, 2025 & 2035
- 5.1.5. Key Market Trends, Growth Factors, & Opportunities
- 5.1.6. LCD & Display Panel Manufacturing
- 5.1.7. Electronic Grade Hydrofluoric Acid Share Forecast, By Region (USD Billion)
- 5.1.8. Comparative Revenue Analysis, By Country, 2025 & 2035
- 5.1.9. Key Market Trends, Growth Factors, & Opportunities
- 5.1.10. Solar Cell Fabrication
- 5.1.10.1. Wafer Texturing
- 5.1.10.2. PSG Removal
- 5.1.10.3. HJT Surface Preparation
- 5.1.11. Electronic Grade Hydrofluoric Acid Share Forecast, By Region (USD Billion)
- 5.1.12. Comparative Revenue Analysis, By Country, 2025 & 2035
- 5.1.13. Key Market Trends, Growth Factors, & Opportunities
- 5.1.14. Printed Circuit Boards
- 5.1.15. Electronic Grade Hydrofluoric Acid Share Forecast, By Region (USD Billion)
- 5.1.16. Comparative Revenue Analysis, By Country, 2025 & 2035
- 5.1.17. Key Market Trends, Growth Factors, & Opportunities
- 5.1.18. Other Applications
- 5.1.19. Electronic Grade Hydrofluoric Acid Share Forecast, By Region (USD Billion)
- 5.1.20. Comparative Revenue Analysis, By Country, 2025 & 2035
- 5.1.21. Key Market Trends, Growth Factors, & Opportunities
- 5.1. Application Market Overview, By Application Segment
- Chapter 6. Electronic Grade Hydrofluoric Acid Market – By End Use Industry
- 6.1. End Use Industry Market Overview, By End Use Industry Segment
- 6.1.1. Electronic Grade Hydrofluoric Acid Market Revenue Share, By End Use Industry, 2025 & 2035
- 6.1.2. Semiconductor & IC Fabrication
- 6.1.3. Electronic Grade Hydrofluoric Acid Share Forecast, By Region (USD Billion)
- 6.1.4. Comparative Revenue Analysis, By Country, 2025 & 2035
- 6.1.5. Key Market Trends, Growth Factors, & Opportunities
- 6.1.6. Display & Optoelectronics
- 6.1.7. Electronic Grade Hydrofluoric Acid Share Forecast, By Region (USD Billion)
- 6.1.8. Comparative Revenue Analysis, By Country, 2025 & 2035
- 6.1.9. Key Market Trends, Growth Factors, & Opportunities
- 6.1.10. Photovoltaics
- 6.1.11. Electronic Grade Hydrofluoric Acid Share Forecast, By Region (USD Billion)
- 6.1.12. Comparative Revenue Analysis, By Country, 2025 & 2035
- 6.1.13. Key Market Trends, Growth Factors, & Opportunities
- 6.1.14. Electronics Manufacturing
- 6.1.15. Electronic Grade Hydrofluoric Acid Share Forecast, By Region (USD Billion)
- 6.1.16. Comparative Revenue Analysis, By Country, 2025 & 2035
- 6.1.17. Key Market Trends, Growth Factors, & Opportunities
- 6.1.18. Other End Uses
- 6.1.19. Electronic Grade Hydrofluoric Acid Share Forecast, By Region (USD Billion)
- 6.1.20. Comparative Revenue Analysis, By Country, 2025 & 2035
- 6.1.21. Key Market Trends, Growth Factors, & Opportunities
- 6.1. End Use Industry Market Overview, By End Use Industry Segment
- Chapter 7. Electronic Grade Hydrofluoric Acid Market – Regional Analysis
- 7.1. Electronic Grade Hydrofluoric Acid Market Overview, By Region Segment
- 7.1.1. Global Electronic Grade Hydrofluoric Acid Market Revenue Share, By Region, 2025 & 2035
- 7.1.2. Global Electronic Grade Hydrofluoric Acid Market Revenue, By Region, 2026 – 2035 (USD Billion)
- 7.1.3. Global Electronic Grade Hydrofluoric Acid Market Revenue, By Grade, 2026 – 2035
- 7.1.4. Global Electronic Grade Hydrofluoric Acid Market Revenue, By Application, 2026 – 2035
- 7.1.5. Global Electronic Grade Hydrofluoric Acid Market Revenue, By End Use Industry, 2026 – 2035
- 7.2. North America
- 7.2.1. North America Electronic Grade Hydrofluoric Acid Market Revenue, By Country, 2026 – 2035 (USD Billion)
- 7.2.2. North America Electronic Grade Hydrofluoric Acid Market Revenue, By Grade, 2026 – 2035
- 7.2.3. North America Electronic Grade Hydrofluoric Acid Market Revenue, By Application, 2026 – 2035
- 7.2.4. North America Electronic Grade Hydrofluoric Acid Market Revenue, By End Use Industry, 2026 – 2035
- 7.2.5. U.S. Electronic Grade Hydrofluoric Acid Market Revenue, 2026 – 2035 (USD Billion)
- 7.2.6. Canada Electronic Grade Hydrofluoric Acid Market Revenue, 2026 – 2035 (USD Billion)
- 7.2.7. Mexico Electronic Grade Hydrofluoric Acid Market Revenue, 2026 – 2035 (USD Billion)
- 7.2.8. Rest of North America Electronic Grade Hydrofluoric Acid Market Revenue, 2026 – 2035 (USD Billion)
- 7.3. Europe
- 7.3.1. Europe Electronic Grade Hydrofluoric Acid Market Revenue, By Country, 2026 – 2035 (USD Billion)
- 7.3.2. Europe Electronic Grade Hydrofluoric Acid Market Revenue, By Grade, 2026 – 2035
- 7.3.3. Europe Electronic Grade Hydrofluoric Acid Market Revenue, By Application, 2026 – 2035
- 7.3.4. Europe Electronic Grade Hydrofluoric Acid Market Revenue, By End Use Industry, 2026 – 2035
- 7.3.5. Germany Electronic Grade Hydrofluoric Acid Market Revenue, 2026 – 2035 (USD Billion)
- 7.3.6. France Electronic Grade Hydrofluoric Acid Market Revenue, 2026 – 2035 (USD Billion)
- 7.3.7. U.K. Electronic Grade Hydrofluoric Acid Market Revenue, 2026 – 2035 (USD Billion)
- 7.3.8. Russia Electronic Grade Hydrofluoric Acid Market Revenue, 2026 – 2035 (USD Billion)
- 7.3.9. Italy Electronic Grade Hydrofluoric Acid Market Revenue, 2026 – 2035 (USD Billion)
- 7.3.10. Spain Electronic Grade Hydrofluoric Acid Market Revenue, 2026 – 2035 (USD Billion)
- 7.3.11. Netherlands Electronic Grade Hydrofluoric Acid Market Revenue, 2026 – 2035 (USD Billion)
- 7.3.12. Rest of Europe Electronic Grade Hydrofluoric Acid Market Revenue, 2026 – 2035 (USD Billion)
- 7.4. Asia Pacific
- 7.4.1. Asia Pacific Electronic Grade Hydrofluoric Acid Market Revenue, By Country, 2026 – 2035 (USD Billion)
- 7.4.2. Asia Pacific Electronic Grade Hydrofluoric Acid Market Revenue, By Grade, 2026 – 2035
- 7.4.3. Asia Pacific Electronic Grade Hydrofluoric Acid Market Revenue, By Application, 2026 – 2035
- 7.4.4. Asia Pacific Electronic Grade Hydrofluoric Acid Market Revenue, By End Use Industry, 2026 – 2035
- 7.4.5. China Electronic Grade Hydrofluoric Acid Market Revenue, 2026 – 2035 (USD Billion)
- 7.4.6. Japan Electronic Grade Hydrofluoric Acid Market Revenue, 2026 – 2035 (USD Billion)
- 7.4.7. India Electronic Grade Hydrofluoric Acid Market Revenue, 2026 – 2035 (USD Billion)
- 7.4.8. New Zealand Electronic Grade Hydrofluoric Acid Market Revenue, 2026 – 2035 (USD Billion)
- 7.4.9. Australia Electronic Grade Hydrofluoric Acid Market Revenue, 2026 – 2035 (USD Billion)
- 7.4.10. South Korea Electronic Grade Hydrofluoric Acid Market Revenue, 2026 – 2035 (USD Billion)
- 7.4.11. Taiwan Electronic Grade Hydrofluoric Acid Market Revenue, 2026 – 2035 (USD Billion)
- 7.4.12. Rest of Asia Pacific Electronic Grade Hydrofluoric Acid Market Revenue, 2026 – 2035 (USD Billion)
- 7.5. The Middle-East and Africa
- 7.5.1. The Middle-East and Africa Electronic Grade Hydrofluoric Acid Market Revenue, By Country, 2026 – 2035 (USD Billion)
- 7.5.2. The Middle-East and Africa Electronic Grade Hydrofluoric Acid Market Revenue, By Grade, 2026 – 2035
- 7.5.3. The Middle-East and Africa Electronic Grade Hydrofluoric Acid Market Revenue, By Application, 2026 – 2035
- 7.5.4. The Middle-East and Africa Electronic Grade Hydrofluoric Acid Market Revenue, By End Use Industry, 2026 – 2035
- 7.5.5. Saudi Arabia Electronic Grade Hydrofluoric Acid Market Revenue, 2026 – 2035 (USD Billion)
- 7.5.6. UAE Electronic Grade Hydrofluoric Acid Market Revenue, 2026 – 2035 (USD Billion)
- 7.5.7. Egypt Electronic Grade Hydrofluoric Acid Market Revenue, 2026 – 2035 (USD Billion)
- 7.5.8. Kuwait Electronic Grade Hydrofluoric Acid Market Revenue, 2026 – 2035 (USD Billion)
- 7.5.9. South Africa Electronic Grade Hydrofluoric Acid Market Revenue, 2026 – 2035 (USD Billion)
- 7.5.10. Rest of the Middle East & Africa Electronic Grade Hydrofluoric Acid Market Revenue, 2026 – 2035 (USD Billion)
- 7.6. Latin America
- 7.6.1. Latin America Electronic Grade Hydrofluoric Acid Market Revenue, By Country, 2026 – 2035 (USD Billion)
- 7.6.2. Latin America Electronic Grade Hydrofluoric Acid Market Revenue, By Grade, 2026 – 2035
- 7.6.3. Latin America Electronic Grade Hydrofluoric Acid Market Revenue, By Application, 2026 – 2035
- 7.6.4. Latin America Electronic Grade Hydrofluoric Acid Market Revenue, By End Use Industry, 2026 – 2035
- 7.6.5. Brazil Electronic Grade Hydrofluoric Acid Market Revenue, 2026 – 2035 (USD Billion)
- 7.6.6. Argentina Electronic Grade Hydrofluoric Acid Market Revenue, 2026 – 2035 (USD Billion)
- 7.6.7. Rest of Latin America Electronic Grade Hydrofluoric Acid Market Revenue, 2026 – 2035 (USD Billion)
- 7.1. Electronic Grade Hydrofluoric Acid Market Overview, By Region Segment
- Chapter 8. Competitive Landscape
- 8.1. Company Market Share Analysis – 2025
- 8.1.1. Global Electronic Grade Hydrofluoric Acid Market: Company Market Share, 2025
- 8.2. Global Electronic Grade Hydrofluoric Acid Market Company Market Share, 2024
- 8.1. Company Market Share Analysis – 2025
- Chapter 9. Company Profiles
- 9.1. Stella Chemifa Corporation
- 9.1.1. Company Overview
- 9.1.2. Key Executives
- 9.1.3. Product Portfolio
- 9.1.4. Financial Overview
- 9.1.5. Operating Business Segments
- 9.1.6. Business Performance
- 9.1.7. Recent Developments
- 9.2. Daikin Industries Ltd.
- 9.3. Solvay S.A.
- 9.4. Honeywell International Inc.
- 9.5. Morita Chemical Industries Co. Ltd.
- 9.6. Do-Fluoride Chemicals Co. Ltd.
- 9.7. Fujian Yong Jing Chemical Co. Ltd.
- 9.8. Juhua Group Corporation
- 9.9. Mexichem Fluor (Orbia)
- 9.10. Air Products and Chemicals Inc.
- 9.11. Others.
- 9.1. Stella Chemifa Corporation
- Chapter 10. Research Methodology
- 10.1. Research Methodology
- 10.2. Secondary Research
- 10.3. Primary Research
- 10.3.1. Analyst Tools and Models
- 10.4. Research Limitations
- 10.5. Assumptions
- 10.6. Insights From Primary Respondents
- 10.7. Why Custom Market Insights
- Chapter 11. Standard Report Commercials & Add-Ons
- 11.1. Customization Options
- 11.2. Subscription Module For Market Research Reports
- 11.3. Client Testimonials
List Of Figures
Figures No 1 to 37
List Of Tables
Tables No 1 to 46
FAQs
The key players in the market are Stella Chemifa Corporation, Daikin Industries Ltd., Solvay S.A., Honeywell International Inc., Morita Chemical Industries Co. Ltd., Do-Fluoride Chemicals Co. Ltd., Fujian Yong Jing Chemical Co. Ltd., Juhua Group Corporation, Mexichem Fluor (Orbia), Air Products and Chemicals Inc., Others.
A special bipolar force in the electronic grade HF market is government policy, which can both stimulate demand by the use of semiconductor manufacturing incentive programs and influence supply chains by the use of export control measures. The 2019 tightening of export controls on fluorine-based semiconductor chemicals in South Korea by Japan, triggered by an illustrative diplomatic dispute, showed that electronic grade chemical supply chains are geopolitically vulnerable and can be broken by unilateral policy intervention and led to diversification investment in the industry. The U.S. export control expansion under the label of the EAR Entity List targets Chinese semiconductor manufacturers and has both limited the amount of advanced process technology Chinese fabs could obtain and actually fueled domestic Chinese investment in electronic grade chemical self-sufficiency. The overlapping of incentives of industrial policy (CHIPS Act, European Chips Act, and India Semiconductor Mission) with strategic materials control regimes is redefining the geography of not only HF production but also HF consumption in ways that will structurally increase total global market size but also redistribute supply chain flows and create risk and opportunity for both established and emerging producers by the year 2035.
The markup of electronic grade HF is very high over industrial grade HF, and pricing reflects the extreme amount of purification investment and quality assurance infrastructure necessary to meet semiconductor-grade requirements. UP-SS grade electronic HF costs around USD 815 per kilogram on volume and supply contract conditions versus USD 801.20 per kilogram of industrial grade anhydrous HF and USD 35 per kilogram of standard electronic (EL) grade product. These pricing premiums are based upon the cost of multi-stage purification as well as on the value they bring to semiconductor manufacturers: at CD manufacturing facilities at the leading edge, a single 300mm wafer might be worth USD 5,000-15,000 by the final stage of processing, and impairment of purity may result in loss of yield, so purity performance rather than price becomes the key supplier selection parameter. The standard supply contracts of 3-5 years’ procurement length used by the leading-edge semiconductor manufacturers who buy ultra-high purity chemicals give the producers visibility in revenue, which is invested in specific purification capacity and client-specific qualification.
According to the current analysis, the market will hit USD 3.47 billion as of 2035, owing to increasing global capacity to manufacture wafers; gradual migration to more HF-based chip designs at leading-edge nodes; faster growth in solar PV manufacturing in need of HF-based silicon surface treatment; and growth in electronic grade HF production and consumption geographically in North America, Europe, and India with a CAGR of 11.4% between 2026 and 2035.
Asia Pacific is anticipated to keep the largest share of revenue during the forecast period as it is expected to increase by 67% in 2025 to an estimated 69% in 2035 owing to the fact that Taiwan, South Korea, Japan, China, and the increasing contribution made by India and Southeast Asia continue to concentrate their semiconductor, display, and solar manufacturing capacity. This advantage is inherent to the geography of the global electronics supply chain and will continue to exist in 2035 despite an increase in capacity in North America and Europe, redistributing the HF demand geography.
The fastest CAGR in developed regions is anticipated to be that of North America, 13.2%, between 2026 and 2035, which will be the result of the CHIPS act-driven construction of new TSMC, Intel, Samsung, and Micron fabs, creating a structural step-change in domestic U.S. electronic-grade HF consumption on a hitherto modest base. In the Asia Pacific, India will experience a 14.6% CAGR that is due to the investments by Tata Electronics, Foxconn, and Micron in semiconductor manufacturing with the backing of the USD 10 billion Semiconductor Mission in India. The entire Asia Pacific has a dominant market share of 67% and absolute growth, which is expected to grow more than USD 1.5 billion in annual market revenues between 2025 and 2035.
The Global Electronic Grade Hydrofluoric Acid Market is forecasted to grow significantly due to the global semiconductor fab construction boom fueled by the U.S. CHIPS Act, the European Chips Act, and Asian government investment of hundreds of billions of dollars; the migration of chip architectural complexity towards higher HF consumption per wafer of about 38% in the next 4 years in the leading-edge logic processes; the high additions of solar PV capacity of 447 gigawatts in 2024 and a predicted 600 plus gigawatts/year by 2027 driving silicon wafer texturing and PSG removal HF demand; advanced packaging growth with the advanced semiconductor packaging market projected to reach USD 78.9 billion by 2029; geopolitical supply chain restructuring expanding domestic HF purification investment in the United States, Europe, South Korea, and China; and the progressive escalation of purity requirements at sub-3nm nodes driving volume migration toward higher-value UP-SS grade products.