Zinc Agriculture Micronutrients Market Size, Trends and Insights By Form (Zinc Sulfate (Monohydrate and Heptahydrate), Zinc Oxide, Zinc Chelates (EDTA, DTPA, EDDHA, Amino Acid Chelates), Zinc Chloride, Zinc Nitrate, Zinc Lignosulfonate, Other Forms (Zinc Humate, Zinc EDDHSA)), By Application Method (Soil Application (Broadcast and Band Application), Foliar Spray, Fertigation (Drip and Sprinkler Irrigation), Seed Treatment, Other Methods (Hydroponics, Nursery Dip)), By Crop Type (Cereals & Grains (Rice, Wheat, Maize, Sorghum), Fruits & Vegetables (Citrus, Grapes, Tomatoes, Potatoes), Oilseeds & Pulses (Soybean, Sunflower, Chickpea, Lentil), Turf & Ornamentals, Plantation Crops (Tea, Coffee, Rubber, Sugarcane), Other Crop Types (Forage, Cotton)), By End-User (Farmers & Agricultural Producers, Agrochemical Distributors & Retailers, Government & Cooperative Programs, Contract Farming & Agribusiness Companies, Other End-Users), and By Region - Global Industry Overview, Statistical Data, Competitive Analysis, Share, Outlook, and Forecast 2026 – 2035
Report Snapshot
CAGR: 7.1%
| Study Period: | 2026-2035 |
| Fastest Growing Market: | Asia Pacific |
| Largest Market: | Asia Pacific |
Major Players
- The Mosaic Company
- Haifa Group
- Yara International ASA
- Coromandel International Ltd.
- Others
Reports Description
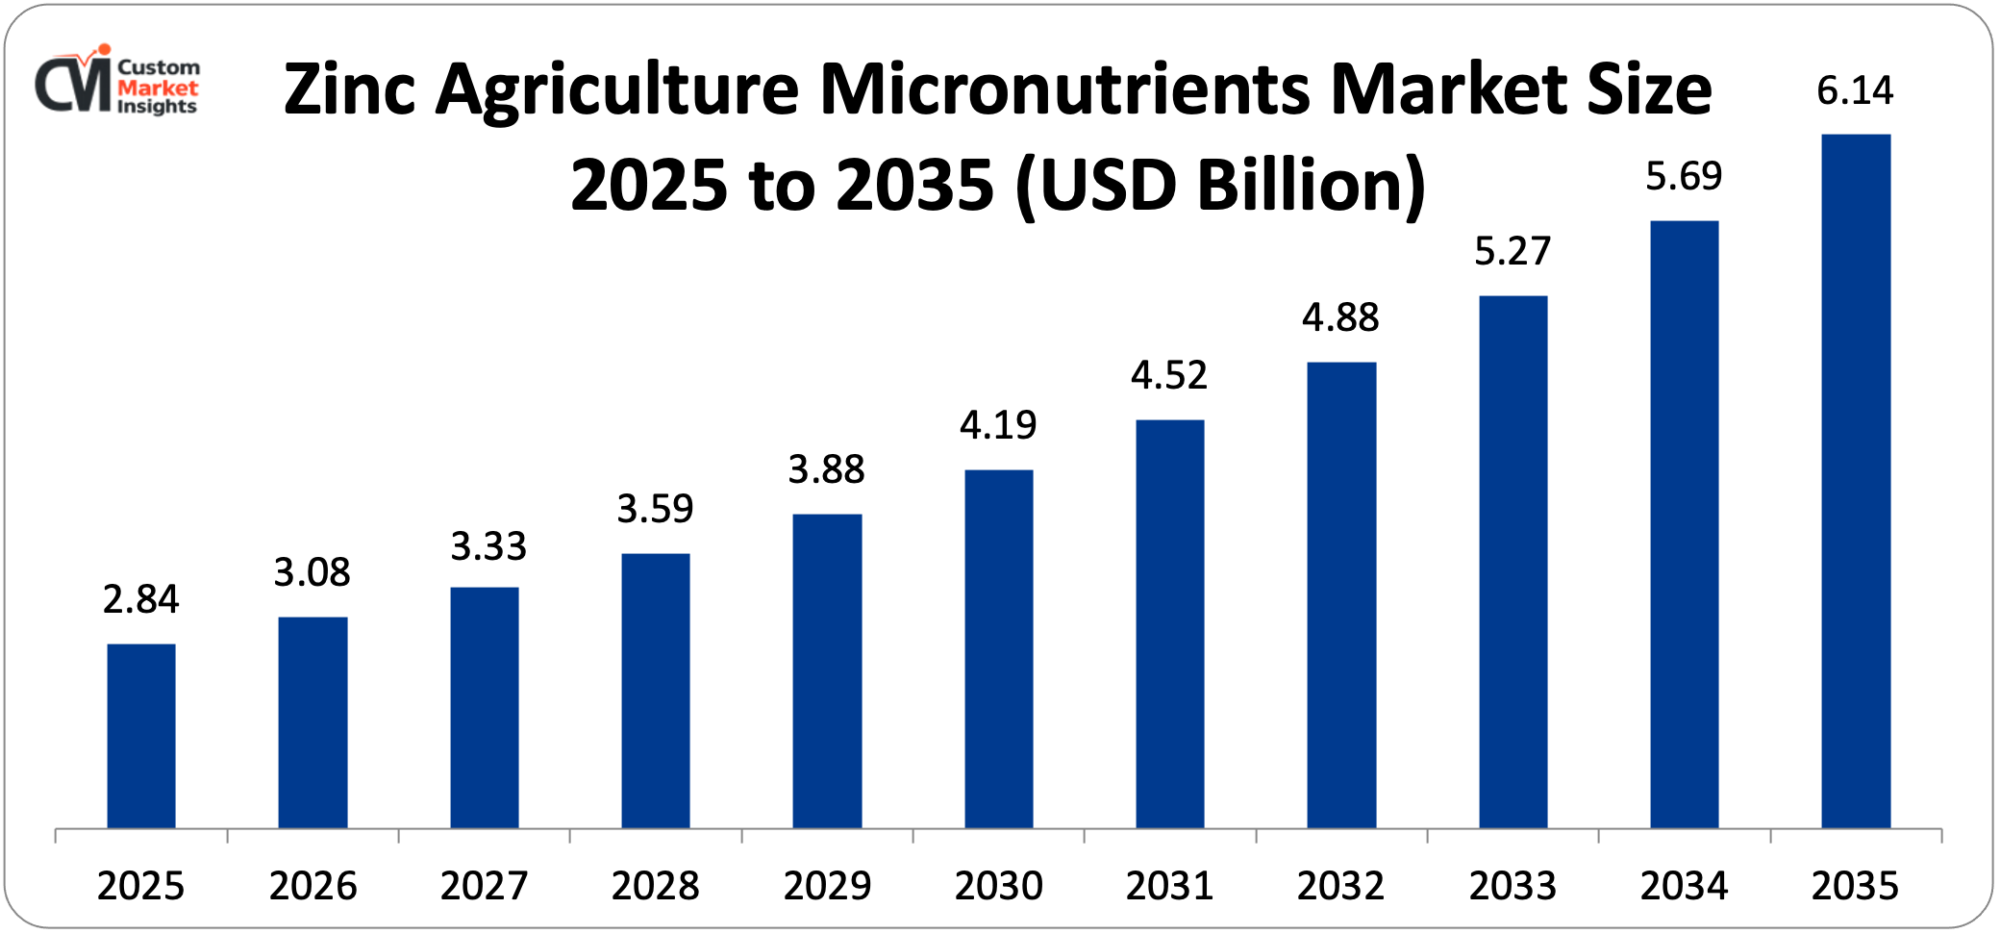
The market size of zinc agriculture micronutrients in the world is estimated to be USD 2.84 billion in 2025 and is expected to grow by USD 3.08 billion in 2026 and reach somewhere near USD 6.14 billion by 2035 with a CAGR of 7.1% between 2026 and 2035.
The accelerating growth in global prevalence of zinc deficiency in agricultural soils – including the effects of affecting an estimated 50% of the currently cultivated world soils, the rising agronomic acceptance that zinc micronutrient supplementation generates quantifiable yield gains and quality improvements in agronomic aspects in staple food crop species such as rice, wheat, and maize, the continuing governmental programs that propose zinc-fortified fertilizer usage in areas of zinc deficiency, the increasing global food security demand driving productivity growth on the already cultivated soils while proportionately increasing chemical input use, and the progressive adoption of precision agriculture practices enabling targeted zinc micronutrient application at the field level collectively drive robust and sustained market growth throughout the forecast period.
Market Highlight
- Asia Pacific had the highest market share of 46% in the zinc agriculture micronutrients market in 2025.
- North America 2026-2035 The market in North America is projected to increase by 6.4%.
- Form – In 2025, the zinc sulfate segment acquired about 41% of the market share.
- By form, the zinc chelates segment is projected to grow at the highest CAGR of 9.8% between the years 2026 and 2035.
- By application method, the soil application segment had the largest market share of 54% in the year 2025, and the foliar spray segment had the highest CAGR of 8.6% in the forecast period of the years 2026–2035.
- By type of crop, the crops and grains segment is set to play the largest market share of 48% in 2025 with the fruits and vegetables segment projected to grow at the highest CAGR of 9.2% between 2026 and 2035.
- By end-user, the farmers and the agricultural producers segment had an end-market share of 62% in 2025.
Significant Growth Factors
The Zinc Agriculture Micronutrients Market Trends present significant growth opportunities due to several factors:
- Pervasive Global Soil Zinc Deficiency and Crop Yield Loss Driving Agronomic Adoption:
The first requirement driver in the zinc agriculture micronutrients market is the extraordinary prevalence of zinc deficiency in soils that are most agricurally productive on Earth, including the Indo-Gangetic Plains of India and Pakistan, the Anatolian plateau of Turkey, the North China Plain, the Cerrado of Brazil and farmed parts of the Sub-Saharan Africa where the yield penalty imposed by zinc deficiency on affected crops gives a direct and measurable economic payoff on zinc supplementation investment that can cause farmers to switch to it once they are aware Zinc is a vital micronutrient that is part of more than 300 enzyme systems in plants, such as carbonic anhydrase, that are required in the fixation of CO 2, auxin biosynthesis enzymes that regulate shoot elongation, and RNA polymerase that are necessary in the process of protein synthesis; zinc deficiency inhibits all of these important processes of metabolism simultaneously, leading to the typical signs of stunting, chlorosis and decreased tillering that halved or more grain yield in severely deficient so The International Rice Research Institute (IRRI) has recorded that some 50% of the soils that grow rice in the world are zinc deficient, and that zinc deficiency during the period of seedling establishment leads to widespread crop failure which has been reported to result in yield losses of 20 40% in deficient soils. The production of rice and wheat in India, which forms the largest cereal cropping system in the world in terms of area, is heavily impacted by zinc deficiency and the Indian Council of Agricultural Research (ICAR) has estimated that about 48% of Indian soils are zinc deficient and that the remediation of such a situation through zinc fertilizer application yields an average of 3-8% wheat and 5-15% rice yield on the deficient soils – yields that represent massive aggregate economic value across the Indian 100 million or more hectares.
The published agronomic studies of CIMMYT (International Maize and Wheat Improvement Center) indicate that the fertilization of wheat with zinc on soils that are deficient in zinc yields an average of 0.5 to 1.5 tonnes per hectare -that is, yield improvements of 10-30%—whereas the concomitant agronomic improvements in grain zinc concentration are 20-40%, which enhance nutritional quality of the produced grain to be consumed by humans. The international food security need and the fact that the United Nations Food and Agriculture Organization estimates that world food production must grow by about 50% by 2050 to nourish a projected world population of 9.7 billion persons present an incentive structure to encourage the development of greater yield productivity out of the already existing cultivated land rather than the reclamation of new land.
- Biofortification Programs and Human Nutrition Linkage Creating Policy-Driven Demand:
The developing scientific acknowledgment of zinc malnutrition, through agricultural soil being a direct causal pathway to human zinc malnutrition, where an estimated 2 billion people in the world are affected by zinc malnutrition in their diets, as determined by the World Health Organization, is creating a strong policy-driven demand driver of agricultural zinc supplementation that links agronomic productivity goals and objectives with public health nutrition goals to the creation of structured and paid-back demand for zinc fertilizer products.
The HarvestPlus biofortification initiative, which is led by the Consultative Group on International Agricultural Research (CGIAR) with the support of the Bill and Melinda Gates Foundation has developed and introduced more than 300 zinc-biofortified varieties of wheat, rice, maize, bean, and cassava, with zinc-biofortified wheat varieties such as BARI Gom-33 in Bangladesh and NW Zinc in Pakistan showing a grain zinc concentration that is 20-30% higher than conventional varieties grown on zinc-supplemented soils. The most vital agronomic understanding that zinc biofortification initiatives rely on is that even zinc-biofortified crop varieties cannot attain their potential grain zinc concentration without a sufficient amount of soil zinc — establishing a mutually reinforcing relationship between the plant breeding and soil fertilization strategies to biofortification, zinc fertilizer application must be a condition to the realization of the nutritional potential of the biofortified varieties and subsequently the need to maintain zinc fertilizer demand when biofortified varieties are introduced.
The national zinc fertilizer promotion program of India, by both the fertilizer policy of the Ministry of Agriculture and the nutrition improvement goals of the Ministry of Health, has made zinc sulfate a recommended and subsidized zinc fertilizer within the government program Soil Health Management, where state governments such as Uttar Pradesh, Punjab and Haryana provide ZnSO₄ at subsidized prices which directly stimulates the demand in the commercial zinc fertilizer market. The national program on zinc-biofortified wheat in Pakistan – a project of HarvestPlus, Pakistan Agricultural Research Council and provincial agriculture departments – has delivered zinc-biofortified wheat seed plus zinc fertilizer recommendations to millions of smallholder farmers in the Punjab province of Pakistan, which has generated a programmatic demand for zinc fertilizer products associated with the biofortified variety adoption which is a government sponsored market development intervention with zinc fertilizer producers operating in Pakistan.
What are the Major Advances Changing the Zinc Agriculture Micronutrients Market Today?
- Zinc Chelate Technology Advancement Improving Bioavailability and Efficiency:
The commercial growth and product development of chelated zinc products which are the zinc ions complexed to organic ligand molecules such as EDTA, DTPA, EDDHA, amino acids, humic acids, and lignosulfonates that shield the zinc ions against soil chemical reactions to limit availability and release zinc more readily to plant root uptake systems is producing a high quality product segment of the zinc micronutrient products market that focuses on the primary drawback of the traditional inorganic zinc sources, namely that they are quickly immobilized in Traditional zinc sulfate, which is the most common product by volume of zinc fertilizers, is an effective product in moderately deficient soils with moderate application efficacy, whereas in calcareous soils (pH over 7.5), which are highly common in the zinc deficient agronomically significant areas of South Asia, Middle East, and Mediterranean Europe zinc sulfate is actively reacted with soil calcium carbonate to precipitate zinc as insoluble zinc carbonate in a few days after application, which radically lowers the proportion of Zinc chelates Zinc chelates, especially EDTA-chelated zinc (Zn-EDTA) and DTPA-chelated zinc (Zn-DTPA), keep zinc in a soluble, plant-available form over a far broader pH range of soils by competing with soil chemical reactions to bind zinc and produce zinc nutrition at application rates 3-5 times less than equivalent zinc sulfate treatments of calcareous soils and give zinc a more even distribution throughout the root zone.
The growing popularity of amino acid-chelated zinc products – where commercially available amino acids, such as glycine, glutamine and methionine, are used as chelating ligands that provide both zinc and organic nitrogen in a single product – is finding commercial momentum as a high-value support system of zinc nutrition in the increasing value horticultural crop, organic production system, and market where consumers appreciate natural input products. Zinc products based on humic acids Humic acid-complexed zinc products, which capitalize on the natural zinc complexation and soil organic matter enhancement capabilities of humic substances, are promoted as soil health-enhancing products capable of enhancing the zinc status of soils both in the short run (by maximizing yield) and in the long run (by improving the status of soil organic matter).
- Precision Agriculture and Soil Health Diagnostics Enabling Targeted Zinc Management:
The combination of accuracy in zinc deficit diagnosis with more targeted and effective zinc micronutrient management techniques at the field scale due to precision agriculture technologies, such as variable rate fertilizer application equipment, field-scale soil sampling and mapping services, satellite and drone-based crop canopy spectral monitoring, and AI-based agronomic decision support platforms is also leading to zinc supplementation being adopted by more precision agriculture practitioners and more effective use of zinc fertilizer by optimizing onsite application rates. Soil zinc assays – offering quantitative determinations of DTPA-extractable zinc that is the most established index of plant obtainable soil zinc – are becoming an expanding part of typical pre-season soil sampling schemes at progressive farm enterprises, and laboratory zinc examination rates of USD 5-USD 15 per sample are making regular zinc following economically accessible to commercial scale farming enterprises.
The establishment of high-speed soil zinc testing systems, such as handheld X-ray fluorescence (XRF) analyzers that can measure the amount of soil zinc directly and easy-to-use colorimetric test kits that can give semi-quantitative information about the presence of plant-available zinc in the soil, are facilitating on-site diagnosis of zinc deficiency at the precision agriculture level without sample laboratory turnaround lag times that slow real-time agronomic decision-making. Variable rate zinc fertilizer application Variable rate zinc fertilizer application is allowing the optimization of zinc application and is also simultaneously enhancing agronomic efficiency through the application of higher application rates to the majority of deficient zones, while undergoing lower application rates when soils are properly zinced. Remote sensing-based detection of zinc deficiency Remote sensing detectors of zinc deficiency Remote sensing-based zinc deficiency detection Remote sensing-based detectors of zinc deficiency Remote sensing-based detectors are still under development Remote sensing-based detectors Remote sensing-based detectors are still under development Remote sensing-based detectors Remote sensing-based detectors Remote sensing-based detectors Remote sensing-based detectors Remote sensing-based detectors Remote sensing-based detectors Remote sensing-based detectors Remote sensing.
- Zinc-Enriched Fertilizer Blends and Integrated Nutrient Products Driving Market Penetration:
- The most strategically significant market development in the zinc agriculture expansion market is the development and commercialization of zinc-enriched product lines of compound fertilizers in which zinc micronutrient is added directly to the NPK compound granular fertilizers in the manufacturing process which deliver zinc and the principal macronutrients simultaneously in one application of fertilizer which is the largest market that can be addressed by zinc agricultural market expansion. The agronomic and commercial rationale of zinc-enriched NPK fertilizers is obvious: farmers who already practice NPK fertilizers as the initial practice in resource-limited agronomic management of their soils can extract the agronomic benefit of zinc micronutrient nutrition through the same application operation with no extra equipment, labor, or agronomic decision-making complexity significantly decreasing the adoption cost that the micronutrient product applications present to resource limited smallholder farmers.
- The Zn4Crops program of the International Fertilizer Association a global industry project that recommends zinc fortification of NPK fertilizers as the most scalable route through which zinc nutrition could be delivered to zinc-deficient smallholder farming systems had involved the NPK fertilizer manufacturers in a series of countries such as India, Turkey, Pakistan, and Egypt with government procurement programs and agrochemical distributors interested in commercially deploying zinc-enriched product forms. The government policy concerning fertilizers in India that regulates the content of NPK fertilizer compositions under the Fertilizer Control Order has provided a framework within which zinc-enriched forms of the mainstream NPK fertilizers are developed by the major Indian producers of fertilizers, including the Indian Farmers Fertiliser Cooperative (IFFCO), Coromandel International and Chambal Fertilisers. Horticultural foliar zinc sprays formulated as highly water soluble zinc sulfate or zinc liquid chelates as direct crop canopy spray applications with tractor sprayers or irrigation systems are a high-growth product package that corrects zinc deficiency symptoms in the crops during the crop growth phase when zinc deficiency symptoms are visibly noticeable, and conventional soil-applied zinc products cannot achieve in weeks or months of time when zinc deficiency symptoms are observable the ability to rapidly correct zinc deficiency symptoms in the crops in 10-14 days of application that conventional soil-applied zinc cannot provide given the weeks to months required for soil zinc to translocate to developing leaves.
Category Wise Insights
By Form
Why Does Zinc Sulfate Lead the Market?
Zinc sulfate is the largest form segment with an estimated 41% of total market share in 2025, as it is essentially the most ubiquitous form of zinc fertilizer in the world, both in volume—it contains 35% zinc in the monohydrate form and 22% zinc in the heptahydrate form—and in versatility; it is completely soluble in water and thus may be applied both to the soil and the plant surface, and foliar spray, band placement, fertilization, and seed Zinc sulfate monohydrate is the most common commercial form of Zinc at the agricultural distribution level due to its increased amount of zinc per unit weight resulting in lower storage and transport costs than heptahydrate. It is produced by the well known and widely distributed industrial process, making it available in varying quantities at competitive prices across the world markets. The market alone of zinc sulfates in India is a representation of one of the largest single national zinc fertilizer markets globally, with India absorbing approximately 250,000-300,000 tonnes of zinc sulfate per annum across its rice, wheat, maize, and cotton production systems a consumption rate that has been fueled by the prevalence of the national soil zinc deficiency, government subsidy programmes, and decades of agricultural extension marketing that has made zinc sulfate the recommended zinc fertilizer rate in Indian production. The price competitiveness of zinc sulfate over chelated alternatives – zinc sulfate monohydrate costing USD 350–USD 600 per tonne of product ( USD 1,000–3700 per tonne of contained zinc ) versus zinc chelates at USD 2,000–5800 per tonne of product – holds its volume market leading role in price sensitive smallholder markets despite its agronomic restriction in calcareous high PH soils where zinc chelates perform significantly better.
By Application Method
Why Does Soil Application Lead the Market?
Soil application is the biggest segment of the methods in the market in 2025 with a market share of about 54% because it is the agronomically foundational zinc supplementation method with deep roots in the industry, which accumulates soil zinc stores to facilitate long-term multi-season zinc nutrition, is compatible with the current agronomic farm mechanization infrastructure needed to apply granular fertilizers, and it also responds to the immediate crop requirement and the fact that soil zinc reserves are progressively depleted to make long-term zinc nutrition across crop rotations.
The most common form of zinc application to large-scale cereal and oilseed producers is broadcast soil application, where granular zinc sulfate or zinc oxide is applied to the field surface uniformly and then incorporated into the soil during tillage, due to its simplicity, compatibility with currently available fertilizer spreading equipment, and its capacity to correct severe cases of zinc deficiency by the option of large-scale application of 1025 kg Zn per hectare of the nutrient, which can provide sufficient zinc nutrition over 3-5 crop seasons before it must be replenished. Efficient zinc nutrition by lower application rates through band application of zinc fertilizer Band application of zinc fertilizer – placing concentrated zinc-containing material in the seed furrow, or in a band with the seed row at planting – has been found to achieve equivalent crop responses to broadcast application of 5 to 10 kg Zn per hectare of zinc fertilizer on moderately deficient soils.
By Crop Type
Why Do Cereals & Grains Lead the Market?
The largest segment of type of crops in the market, at about 48% of total market share in 2025, is cereals and grains as a result of the combination of both the largest global cultivated area of production of any type of crop, i.e., rice, wheat, and maize, all occupying more than 700 million hectares of world soils under cultivation recorded by the FAO, the most intense and widespread occurrence of zinc deficiency in the flooded paddy and intensively cropped calcareous soils of South and East Asia, and The most crucial crop system in which zinc fertilizer is used is rice paddy systems – where flooding develops reducing soil conditions that liberate soluble compounds competing with zinc as the main root uptake, in addition to increasing soil pH to the range of minimum zinc solubility, which produces the zinc-bicarbonate toxicity syndrome which is the typical khaira browning symptoms of zinc deficiency in the production of rice. The second largest cereal zinc fertilizer application market is wheat production in the calcareous soils of the Indo-Gangetic Plain, Anatolian plateau and North China Plain, published data on multi-location agronomic trials conducted at CIMMYT has confirmed significant zinc responses in wheat across Pakistan, India, Turkey and China, and confirmed the economic justification of zinc fertilizer use in these production systems.
By End-User
Why Do Farmers & Agricultural Producers Lead the Market?
The largest segment of end-users is the farmers and agricultural producers at an estimated 62% market share in 2025, where farming operations of all sizes, from smallholder subsistence farmers in the South Asian and Sub-Saharan African village markets to the large commercial grain and oilseed producers in North America, Brazil and Australia purchase through agrochemical dealers, which are the primary commercial channel of distributing the zinc fertilizer products. The entire range of agricultural production levels and levels of sophistication of farmers, from smallholder farmers in India and Bangladesh buying 1-5 kg packets of zinc sulfate in rural input retailers to commercial farming companies in the United States and Brazil buying tonnes of zinc chelate in precision agriculture input programs make up the diversified farmer end-user customer segment. A structurally significant end-user segment in the development of country zinc fertilizer markets, especially in India, Pakistan, Bangladesh and several African countries, has been identified as government and cooperative programs which are programmatic sources of demand, which jointly contribute to a large proportion of total zinc fertilizer use in developing country markets and provide baseline market stability not dependent on the purely commercial forces of demand.
Report Scope
| Feature of the Report | Details |
| Market Size in 2026 | USD 3.08 billion |
| Projected Market Size in 2035 | USD 6.14 billion |
| Market Size in 2025 | USD 2.84 billion |
| CAGR Growth Rate | 7.1% CAGR |
| Base Year | 2025 |
| Forecast Period | 2026-2035 |
| Key Segment | By Form, Application Method, Crop Type, End-User and Region |
| Report Coverage | Revenue Estimation and Forecast, Company Profile, Competitive Landscape, Growth Factors and Recent Trends |
| Regional Scope | North America, Europe, Asia Pacific, Middle East & Africa, and South & Central America |
| Buying Options | Request tailored purchasing options to fulfil your requirements for research. |
Regional Analysis
How Big is the Asia Pacific Market Size?
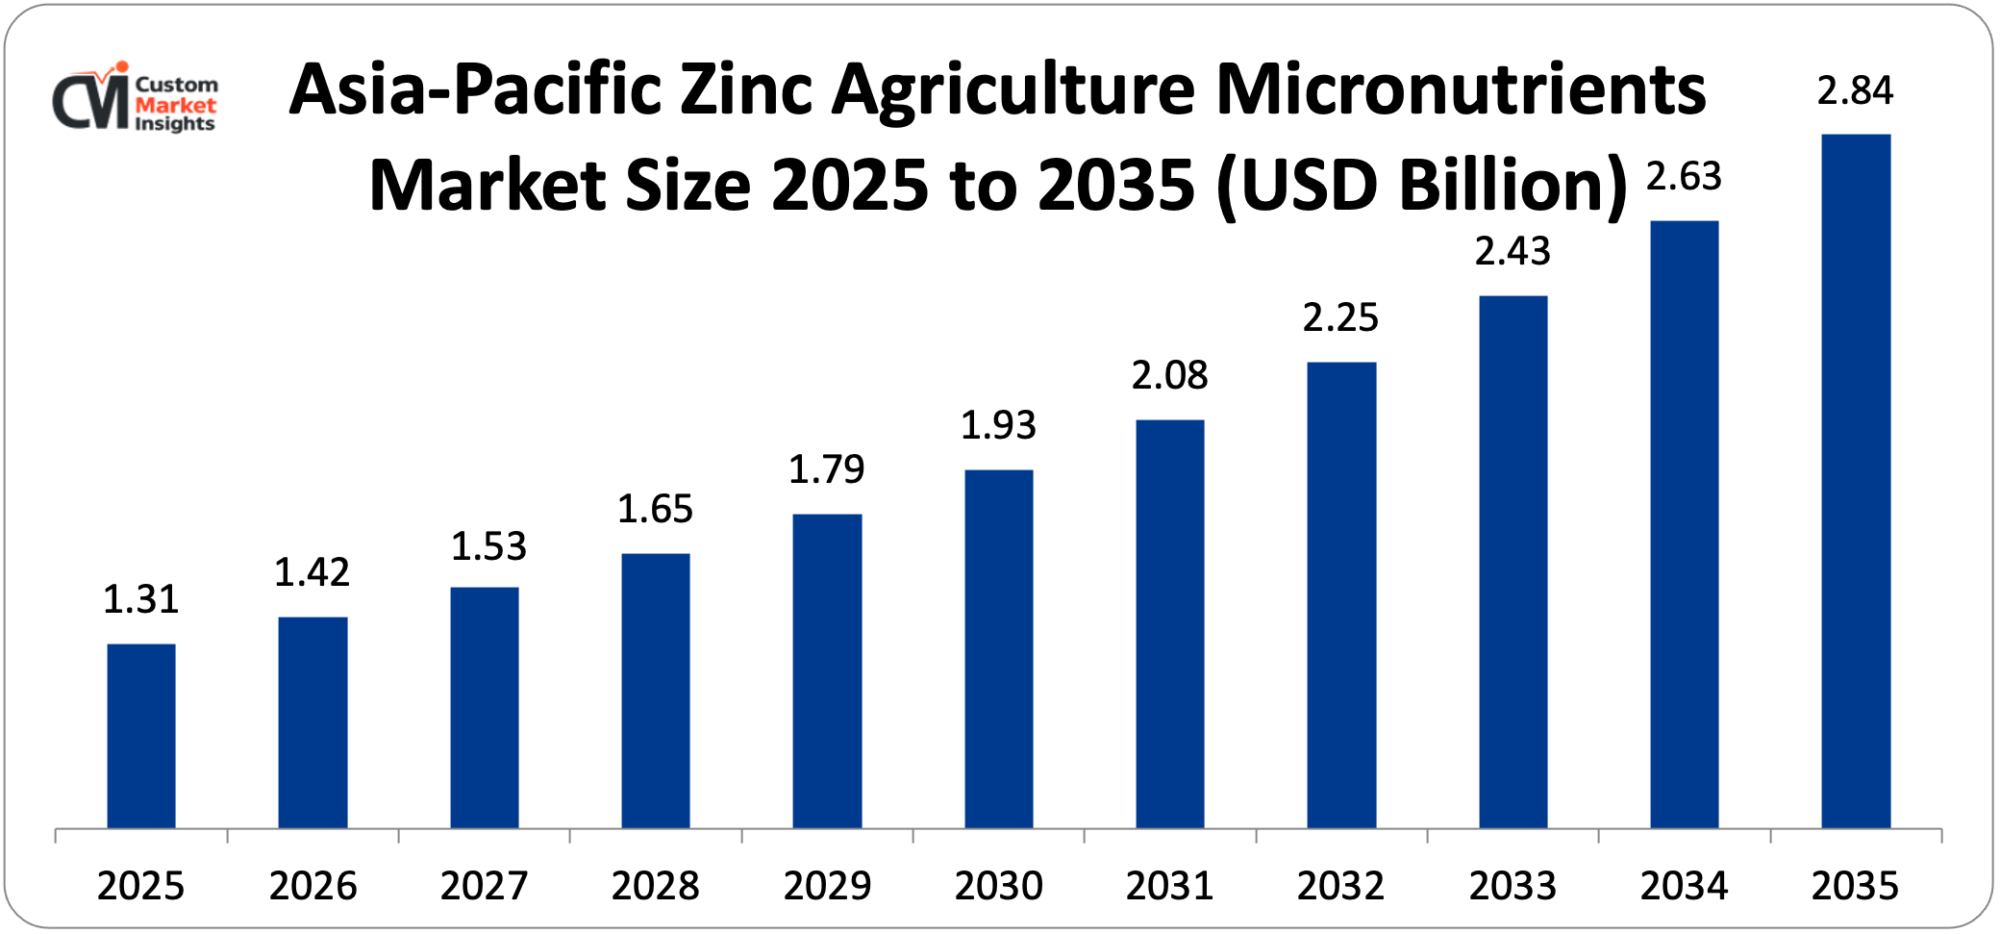
The Asia Pacific zinc agriculture micronutrients market size is estimated at USD 1.31 billion in 2025 and is projected to reach approximately USD 2.84 billion by 2035, with a CAGR of 8.0% from 2026 to 2035.
Why Did Asia Pacific Dominate the Market in 2025?
The region owns about 46% of the world market in 2025, a characteristic of the region that is a combination of the worst and most extensive soil zinc deficiency issue faced anywhere in the world, much of the agricultural area of India, China, Bangladesh, Pakistan and Southeast Asian nations, is the largest agricultural population with the largest absolute numbers of farmers producing distributed zinc fertilizer demand, the most developed government programs of zinc fertilizer promotion, including the national zinc subsidy scheme in India and the soil testing and formula fertilization program in China, and the largest volumes India is the largest national zinc agriculture micronutrients market in the world, and zinc sulfate consumption is estimated at 250,000-300,000 tonnes per year due to the promotion of zinc sulfate as a standard crop nutrition input in India, in its rice, wheat, cotton and maize production systems by the ICAR estimate of between 48 and 50% of Indian soils as being deficient in zinc. The zinc fertilizer market in China, which is caused by soil zinc deficiency in the highly cultivated North China Plain, Yangtze River Valley, and South China rice belts, is facilitated by the national network of soil testing laboratories, via which the government provides zinc-deficient soils with a Soil Testing and Formulated Fertilization program to give soil nutrient analysis and fertilizer recommendation services to farmers, with zinc being among the priority nutrient supplements in test outcomes in the zinc-deficient areas.
Why is North America Experiencing Steady Growth?
North America is undergoing stable growth with a predicted CAGR of 6.4% between 2026 and 2035 due to the large-scale commercial systems of corn and soybean production in the United States where zinc deficiency on the coarse-textured and low-organic matter and high-pH soils in the Midwest corn belt created an agronomic response to zinc fertilization, the adoption of precision agriculture is increasing generating opportunities to map soils designated as zinc-deficient and apply zinc variably, thereby increasing the ROI for commercial producers, the expansion of high-value fruit and vegetable production in California, Florida, and the Pacific Northwest is generating demand for premium chelated zinc products in intensive horticultural production systems, and the growing organic agriculture sector prefers naturally derived zinc inputs including zinc sulfate and amino acid-chelated zinc, that meet organic certification requirements.
Why is Europe a Strategically Important Market?
The European zinc agriculture micronutrients market is estimated to have about USD 512 million in 2025, with a growth rate of 6.7, and is forecasted to have about USD 980 million in 2035. Europe is a strategically important market anchored in the prevalence of the calcareous soils of the Mediterranean region that forms the extensive zinc deficiency in wheat, grapevine, citrus, and olive production, and the EU Regulation 2019/1009 standardising zinc micronutrient qualified fertilizer products putting a market framework and reward structure on product quality and efficacy, and the leadership in precision agriculture in Northern Europe affording high-specification products based on zinc to intensive production systems of vegetables and field crops. Germany and France are the two biggest Northern European markets for zinc micronutrients, and the intensive cereal and oilseed production systems of both countries use zinc micronutrient management as an inseparable element of precision nutrition programs of progressive farm businesses.
Why is the Middle East & Africa Region an Emerging Growth Market?
The LAMEA region boasts increasing market development owing to Turkey as one of the most zinc deficient agricultural nations in the world, with historical soil surveys indicating that 50% of the Turkish cultivated soils are zinc deficient in their production systems; an emerging market development of zinc fertilizers as smallholder formula production programs in Sub-Saharan Africa, which attribute zinc deficiency as a limiting factor that has caused low production yields of maize and legumes; Brazil with large soybean and maize production systems, with tropical Oxisol soils that are often zinc-deficient due to high iron oxide content that strongly adsorbs zinc, and Saudi Arabia’s and the UAE’s intensive greenhouse and hydroponic production systems requiring precisely managed zinc nutrition programs for year-round vegetable production under arid climate conditions.
Top Players in the Market and Their Offerings
- The Mosaic Company
- Nouryon (formerly AkzoNobel Specialty Chemicals)
- Haifa Group
- Yara International ASA
- Coromandel International Ltd.
- Zinc Nacional S.A.
- BASF SE (Agricultural Solutions)
- ICL Group Ltd.
- Aries Agro Limited
- Nutrien Ltd.
- Compo Expert GmbH
- Others
Key Developments
The market has undergone significant developments as industry participants seek to advance chelated zinc product portfolios, expand zinc-enriched NPK fertilizer offerings, and respond to growing government and agronomic demand for zinc micronutrient solutions in zinc-deficient agricultural regions globally.
- In September 2024: Yara International also made the commercial introduction of its YaraVita ZINTRAC 700 concentrated liquid zinc foliar nutrient formulation – developed as a high-load zinc suspension containing 700 g/L zinc in proprietary dispersion technology that allows the foliar spraying crop protection product to be mixed steadily with the crop protection products in tank mix formulations – in the cereal, oil, and vegetable production markets in Europe and the Middle East, where zinc deficiency corrective foliar spraying is an existing agronomic practice.
- In December 2025: Coromandel International has announced a new GromaxZn line of zinc-enriched NPK fertilizers at the India level: the company has introduced a new line of zinc-enriched NPKs, GromaxZn, that includes 0.5% Zn (as zinc sulfate) added consistently throughout the NPK grain during the manufacturing of compound fertilizers: the company is aiming at the large population of smallholders who practice cereal and oilseed farming and seek a convenient source of zinc delivery.
The Zinc Agriculture Micronutrients Market is segmented as follows:
By Form
- Zinc Sulfate (Monohydrate and Heptahydrate)
- Zinc Oxide
- Zinc Chelates (EDTA, DTPA, EDDHA, Amino Acid Chelates)
- Zinc Chloride
- Zinc Nitrate
- Zinc Lignosulfonate
- Other Forms (Zinc Humate, Zinc EDDHSA)
By Application Method
- Soil Application (Broadcast and Band Application)
- Foliar Spray
- Fertigation (Drip and Sprinkler Irrigation)
- Seed Treatment
- Other Methods (Hydroponics, Nursery Dip)
By Crop Type
- Cereals & Grains (Rice, Wheat, Maize, Sorghum)
- Fruits & Vegetables (Citrus, Grapes, Tomatoes, Potatoes)
- Oilseeds & Pulses (Soybean, Sunflower, Chickpea, Lentil)
- Turf & Ornamentals
- Plantation Crops (Tea, Coffee, Rubber, Sugarcane)
- Other Crop Types (Forage, Cotton)
By End-User
- Farmers & Agricultural Producers
- Agrochemical Distributors & Retailers
- Government & Cooperative Programs
- Contract Farming & Agribusiness Companies
- Other End-Users
Regional Coverage:
North America
- U.S.
- Canada
- Mexico
- Rest of North America
Europe
- Germany
- France
- U.K.
- Russia
- Italy
- Spain
- Netherlands
- Rest of Europe
Asia Pacific
- China
- Japan
- India
- New Zealand
- Australia
- South Korea
- Taiwan
- Rest of Asia Pacific
The Middle East & Africa
- Saudi Arabia
- UAE
- Egypt
- Kuwait
- South Africa
- Rest of the Middle East & Africa
Latin America
- Brazil
- Argentina
- Rest of Latin America
Table of Contents
- Chapter 1. Report Introduction
- 1.1. Report Description
- 1.1.1. Purpose of the Report
- 1.1.2. USP & Key Offerings
- 1.2. Key Benefits For Stakeholders
- 1.3. Target Audience
- 1.4. Report Scope
- 1.1. Report Description
- Chapter 2. Market Overview
- 2.1. Report Scope (Segments And Key Players)
- 2.1.1. Zinc Agriculture Micronutrients by Segments
- 2.1.2. Zinc Agriculture Micronutrients by Region
- 2.2. Executive Summary
- 2.2.1. Market Size & Forecast
- 2.2.2. Zinc Agriculture Micronutrients Market Attractiveness Analysis, By Form
- 2.2.3. Zinc Agriculture Micronutrients Market Attractiveness Analysis, By Application Method
- 2.2.4. Zinc Agriculture Micronutrients Market Attractiveness Analysis, By Crop Type
- 2.2.5. Zinc Agriculture Micronutrients Market Attractiveness Analysis, By End-User
- 2.1. Report Scope (Segments And Key Players)
- Chapter 3. Market Dynamics (DRO)
- 3.1. Market Drivers
- 3.1.1. Pervasive Global Soil Zinc Deficiency and Crop Yield Loss Driving Agronomic Adoption
- 3.1.2. Biofortification Programs and Human Nutrition Linkage Creating Policy-Driven Demand
- 3.2. Market Restraints
- 3.3. Market Opportunities
- 3.5. Pestle Analysis
- 3.6. Porter Forces Analysis
- 3.7. Technology Roadmap
- 3.8. Value Chain Analysis
- 3.9. Government Policy Impact Analysis
- 3.10. Pricing Analysis
- 3.1. Market Drivers
- Chapter 4. Zinc Agriculture Micronutrients Market – By Form
- 4.1. Form Market Overview, By Form Segment
- 4.1.1. Zinc Agriculture Micronutrients Market Revenue Share, By Form, 2025 & 2035
- 4.1.2. Zinc Sulfate (Monohydrate and Heptahydrate)
- 4.1.3. Zinc Agriculture Micronutrients Share Forecast, By Region (USD Billion)
- 4.1.4. Comparative Revenue Analysis, By Country, 2025 & 2035
- 4.1.5. Key Market Trends, Growth Factors, & Opportunities
- 4.1.6. Zinc Oxide
- 4.1.7. Zinc Agriculture Micronutrients Share Forecast, By Region (USD Billion)
- 4.1.8. Comparative Revenue Analysis, By Country, 2025 & 2035
- 4.1.9. Key Market Trends, Growth Factors, & Opportunities
- 4.1.10. Zinc Chelates (EDTA, DTPA, EDDHA, Amino Acid Chelates)
- 4.1.11. Zinc Agriculture Micronutrients Share Forecast, By Region (USD Billion)
- 4.1.12. Comparative Revenue Analysis, By Country, 2025 & 2035
- 4.1.13. Key Market Trends, Growth Factors, & Opportunities
- 4.1.14. Zinc Chloride
- 4.1.15. Zinc Agriculture Micronutrients Share Forecast, By Region (USD Billion)
- 4.1.16. Comparative Revenue Analysis, By Country, 2025 & 2035
- 4.1.17. Key Market Trends, Growth Factors, & Opportunities
- 4.1.18. Zinc Nitrate
- 4.1.19. Zinc Agriculture Micronutrients Share Forecast, By Region (USD Billion)
- 4.1.20. Comparative Revenue Analysis, By Country, 2025 & 2035
- 4.1.21. Key Market Trends, Growth Factors, & Opportunities
- 4.1.22. Zinc Lignosulfonate
- 4.1.23. Zinc Agriculture Micronutrients Share Forecast, By Region (USD Billion)
- 4.1.24. Comparative Revenue Analysis, By Country, 2025 & 2035
- 4.1.25. Key Market Trends, Growth Factors, & Opportunities
- 4.1.26. Other Forms (Zinc Humate, Zinc EDDHSA)
- 4.1.27. Zinc Agriculture Micronutrients Share Forecast, By Region (USD Billion)
- 4.1.28. Comparative Revenue Analysis, By Country, 2025 & 2035
- 4.1.29. Key Market Trends, Growth Factors, & Opportunities
- 4.1. Form Market Overview, By Form Segment
- Chapter 5. Zinc Agriculture Micronutrients Market – By Application Method
- 5.1. Application Method Market Overview, By Application Method Segment
- 5.1.1. Zinc Agriculture Micronutrients Market Revenue Share, By Application Method, 2025 & 2035
- 5.1.2. Soil Application (Broadcast and Band Application)
- 5.1.3. Zinc Agriculture Micronutrients Share Forecast, By Region (USD Billion)
- 5.1.4. Comparative Revenue Analysis, By Country, 2025 & 2035
- 5.1.5. Key Market Trends, Growth Factors, & Opportunities
- 5.1.6. Foliar Spray
- 5.1.7. Zinc Agriculture Micronutrients Share Forecast, By Region (USD Billion)
- 5.1.8. Comparative Revenue Analysis, By Country, 2025 & 2035
- 5.1.9. Key Market Trends, Growth Factors, & Opportunities
- 5.1.10. Fertigation (Drip and Sprinkler Irrigation)
- 5.1.11. Zinc Agriculture Micronutrients Share Forecast, By Region (USD Billion)
- 5.1.12. Comparative Revenue Analysis, By Country, 2025 & 2035
- 5.1.13. Key Market Trends, Growth Factors, & Opportunities
- 5.1.14. Seed Treatment
- 5.1.15. Zinc Agriculture Micronutrients Share Forecast, By Region (USD Billion)
- 5.1.16. Comparative Revenue Analysis, By Country, 2025 & 2035
- 5.1.17. Key Market Trends, Growth Factors, & Opportunities
- 5.1.18. Other Methods (Hydroponics, Nursery Dip)
- 5.1.19. Zinc Agriculture Micronutrients Share Forecast, By Region (USD Billion)
- 5.1.20. Comparative Revenue Analysis, By Country, 2025 & 2035
- 5.1.21. Key Market Trends, Growth Factors, & Opportunities
- 5.1. Application Method Market Overview, By Application Method Segment
- Chapter 6. Zinc Agriculture Micronutrients Market – By Crop Type
- 6.1. Crop Type Market Overview, By Crop Type Segment
- 6.1.1. Zinc Agriculture Micronutrients Market Revenue Share, By Crop Type, 2025 & 2035
- 6.1.2. Cereals & Grains (Rice, Wheat, Maize, Sorghum)
- 6.1.3. Zinc Agriculture Micronutrients Share Forecast, By Region (USD Billion)
- 6.1.4. Comparative Revenue Analysis, By Country, 2025 & 2035
- 6.1.5. Key Market Trends, Growth Factors, & Opportunities
- 6.1.6. Fruits & Vegetables (Citrus, Grapes, Tomatoes, Potatoes)
- 6.1.7. Zinc Agriculture Micronutrients Share Forecast, By Region (USD Billion)
- 6.1.8. Comparative Revenue Analysis, By Country, 2025 & 2035
- 6.1.9. Key Market Trends, Growth Factors, & Opportunities
- 6.1.10. Oilseeds & Pulses (Soybean, Sunflower, Chickpea, Lentil)
- 6.1.11. Zinc Agriculture Micronutrients Share Forecast, By Region (USD Billion)
- 6.1.12. Comparative Revenue Analysis, By Country, 2025 & 2035
- 6.1.13. Key Market Trends, Growth Factors, & Opportunities
- 6.1.14. Turf & Ornamentals
- 6.1.15. Zinc Agriculture Micronutrients Share Forecast, By Region (USD Billion)
- 6.1.16. Comparative Revenue Analysis, By Country, 2025 & 2035
- 6.1.17. Key Market Trends, Growth Factors, & Opportunities
- 6.1.18. Plantation Crops (Tea, Coffee, Rubber, Sugarcane)
- 6.1.19. Zinc Agriculture Micronutrients Share Forecast, By Region (USD Billion)
- 6.1.20. Comparative Revenue Analysis, By Country, 2025 & 2035
- 6.1.21. Key Market Trends, Growth Factors, & Opportunities
- 6.1.22. Other Crop Types (Forage, Cotton)
- 6.1.23. Zinc Agriculture Micronutrients Share Forecast, By Region (USD Billion)
- 6.1.24. Comparative Revenue Analysis, By Country, 2025 & 2035
- 6.1.25. Key Market Trends, Growth Factors, & Opportunities
- 6.1. Crop Type Market Overview, By Crop Type Segment
- Chapter 7. Zinc Agriculture Micronutrients Market – By End-User
- 7.1. End-User Market Overview, By End-User Segment
- 7.1.1. Zinc Agriculture Micronutrients Market Revenue Share, By End-User, 2025 & 2035
- 7.1.2. Farmers & Agricultural Producers
- 7.1.3. Zinc Agriculture Micronutrients Share Forecast, By Region (USD Billion)
- 7.1.4. Comparative Revenue Analysis, By Country, 2025 & 2035
- 7.1.5. Key Market Trends, Growth Factors, & Opportunities
- 7.1.6. Agrochemical Distributors & Retailers
- 7.1.7. Zinc Agriculture Micronutrients Share Forecast, By Region (USD Billion)
- 7.1.8. Comparative Revenue Analysis, By Country, 2025 & 2035
- 7.1.9. Key Market Trends, Growth Factors, & Opportunities
- 7.1.10. Government & Cooperative Programs
- 7.1.11. Zinc Agriculture Micronutrients Share Forecast, By Region (USD Billion)
- 7.1.12. Comparative Revenue Analysis, By Country, 2025 & 2035
- 7.1.13. Key Market Trends, Growth Factors, & Opportunities
- 7.1.14. Contract Farming & Agribusiness Companies
- 7.1.15. Zinc Agriculture Micronutrients Share Forecast, By Region (USD Billion)
- 7.1.16. Comparative Revenue Analysis, By Country, 2025 & 2035
- 7.1.17. Key Market Trends, Growth Factors, & Opportunities
- 7.1.18. Other End-Users
- 7.1.19. Zinc Agriculture Micronutrients Share Forecast, By Region (USD Billion)
- 7.1.20. Comparative Revenue Analysis, By Country, 2025 & 2035
- 7.1.21. Key Market Trends, Growth Factors, & Opportunities
- 7.1. End-User Market Overview, By End-User Segment
- Chapter 8. Zinc Agriculture Micronutrients Market – Regional Analysis
- 8.1. Zinc Agriculture Micronutrients Market Overview, By Region Segment
- 8.1.1. Global Zinc Agriculture Micronutrients Market Revenue Share, By Region, 2025 & 2035
- 8.1.2. Global Zinc Agriculture Micronutrients Market Revenue, By Region, 2026 – 2035 (USD Billion)
- 8.1.3. Global Zinc Agriculture Micronutrients Market Revenue, By Form, 2026 – 2035
- 8.1.4. Global Zinc Agriculture Micronutrients Market Revenue, By Application Method, 2026 – 2035
- 8.1.5. Global Zinc Agriculture Micronutrients Market Revenue, By Crop Type, 2026 – 2035
- 8.1.6. Global Zinc Agriculture Micronutrients Market Revenue, By End-User, 2026 – 2035
- 8.2. North America
- 8.2.1. North America Zinc Agriculture Micronutrients Market Revenue, By Country, 2026 – 2035 (USD Billion)
- 8.2.2. North America Zinc Agriculture Micronutrients Market Revenue, By Form, 2026 – 2035
- 8.2.3. North America Zinc Agriculture Micronutrients Market Revenue, By Application Method, 2026 – 2035
- 8.2.4. North America Zinc Agriculture Micronutrients Market Revenue, By Crop Type, 2026 – 2035
- 8.2.5. North America Zinc Agriculture Micronutrients Market Revenue, By End-User, 2026 – 2035
- 8.2.6. U.S. Zinc Agriculture Micronutrients Market Revenue, 2026 – 2035 (USD Billion)
- 8.2.7. Canada Zinc Agriculture Micronutrients Market Revenue, 2026 – 2035 (USD Billion)
- 8.2.8. Mexico Zinc Agriculture Micronutrients Market Revenue, 2026 – 2035 (USD Billion)
- 8.2.9. Rest of North America Zinc Agriculture Micronutrients Market Revenue, 2026 – 2035 (USD Billion)
- 8.3. Europe
- 8.3.1. Europe Zinc Agriculture Micronutrients Market Revenue, By Country, 2026 – 2035 (USD Billion)
- 8.3.2. Europe Zinc Agriculture Micronutrients Market Revenue, By Form, 2026 – 2035
- 8.3.3. Europe Zinc Agriculture Micronutrients Market Revenue, By Application Method, 2026 – 2035
- 8.3.4. Europe Zinc Agriculture Micronutrients Market Revenue, By Crop Type, 2026 – 2035
- 8.3.5. Europe Zinc Agriculture Micronutrients Market Revenue, By End-User, 2026 – 2035
- 8.3.6. Germany Zinc Agriculture Micronutrients Market Revenue, 2026 – 2035 (USD Billion)
- 8.3.7. France Zinc Agriculture Micronutrients Market Revenue, 2026 – 2035 (USD Billion)
- 8.3.8. U.K. Zinc Agriculture Micronutrients Market Revenue, 2026 – 2035 (USD Billion)
- 8.3.9. Russia Zinc Agriculture Micronutrients Market Revenue, 2026 – 2035 (USD Billion)
- 8.3.10. Italy Zinc Agriculture Micronutrients Market Revenue, 2026 – 2035 (USD Billion)
- 8.3.11. Spain Zinc Agriculture Micronutrients Market Revenue, 2026 – 2035 (USD Billion)
- 8.3.12. Netherlands Zinc Agriculture Micronutrients Market Revenue, 2026 – 2035 (USD Billion)
- 8.3.13. Rest of Europe Zinc Agriculture Micronutrients Market Revenue, 2026 – 2035 (USD Billion)
- 8.4. Asia Pacific
- 8.4.1. Asia Pacific Zinc Agriculture Micronutrients Market Revenue, By Country, 2026 – 2035 (USD Billion)
- 8.4.2. Asia Pacific Zinc Agriculture Micronutrients Market Revenue, By Form, 2026 – 2035
- 8.4.3. Asia Pacific Zinc Agriculture Micronutrients Market Revenue, By Application Method, 2026 – 2035
- 8.4.4. Asia Pacific Zinc Agriculture Micronutrients Market Revenue, By Crop Type, 2026 – 2035
- 8.4.5. Asia Pacific Zinc Agriculture Micronutrients Market Revenue, By End-User, 2026 – 2035
- 8.4.6. China Zinc Agriculture Micronutrients Market Revenue, 2026 – 2035 (USD Billion)
- 8.4.7. Japan Zinc Agriculture Micronutrients Market Revenue, 2026 – 2035 (USD Billion)
- 8.4.8. India Zinc Agriculture Micronutrients Market Revenue, 2026 – 2035 (USD Billion)
- 8.4.9. New Zealand Zinc Agriculture Micronutrients Market Revenue, 2026 – 2035 (USD Billion)
- 8.4.10. Australia Zinc Agriculture Micronutrients Market Revenue, 2026 – 2035 (USD Billion)
- 8.4.11. South Korea Zinc Agriculture Micronutrients Market Revenue, 2026 – 2035 (USD Billion)
- 8.4.12. Taiwan Zinc Agriculture Micronutrients Market Revenue, 2026 – 2035 (USD Billion)
- 8.4.13. Rest of Asia Pacific Zinc Agriculture Micronutrients Market Revenue, 2026 – 2035 (USD Billion)
- 8.5. The Middle-East and Africa
- 8.5.1. The Middle-East and Africa Zinc Agriculture Micronutrients Market Revenue, By Country, 2026 – 2035 (USD Billion)
- 8.5.2. The Middle-East and Africa Zinc Agriculture Micronutrients Market Revenue, By Form, 2026 – 2035
- 8.5.3. The Middle-East and Africa Zinc Agriculture Micronutrients Market Revenue, By Application Method, 2026 – 2035
- 8.5.4. The Middle-East and Africa Zinc Agriculture Micronutrients Market Revenue, By Crop Type, 2026 – 2035
- 8.5.5. The Middle-East and Africa Zinc Agriculture Micronutrients Market Revenue, By End-User, 2026 – 2035
- 8.5.6. Saudi Arabia Zinc Agriculture Micronutrients Market Revenue, 2026 – 2035 (USD Billion)
- 8.5.7. UAE Zinc Agriculture Micronutrients Market Revenue, 2026 – 2035 (USD Billion)
- 8.5.8. Egypt Zinc Agriculture Micronutrients Market Revenue, 2026 – 2035 (USD Billion)
- 8.5.9. Kuwait Zinc Agriculture Micronutrients Market Revenue, 2026 – 2035 (USD Billion)
- 8.5.10. South Africa Zinc Agriculture Micronutrients Market Revenue, 2026 – 2035 (USD Billion)
- 8.5.11. Rest of the Middle East & Africa Zinc Agriculture Micronutrients Market Revenue, 2026 – 2035 (USD Billion)
- 8.6. Latin America
- 8.6.1. Latin America Zinc Agriculture Micronutrients Market Revenue, By Country, 2026 – 2035 (USD Billion)
- 8.6.2. Latin America Zinc Agriculture Micronutrients Market Revenue, By Form, 2026 – 2035
- 8.6.3. Latin America Zinc Agriculture Micronutrients Market Revenue, By Application Method, 2026 – 2035
- 8.6.4. Latin America Zinc Agriculture Micronutrients Market Revenue, By Crop Type, 2026 – 2035
- 8.6.5. Latin America Zinc Agriculture Micronutrients Market Revenue, By End-User, 2026 – 2035
- 8.6.6. Brazil Zinc Agriculture Micronutrients Market Revenue, 2026 – 2035 (USD Billion)
- 8.6.7. Argentina Zinc Agriculture Micronutrients Market Revenue, 2026 – 2035 (USD Billion)
- 8.6.8. Rest of Latin America Zinc Agriculture Micronutrients Market Revenue, 2026 – 2035 (USD Billion)
- 8.1. Zinc Agriculture Micronutrients Market Overview, By Region Segment
- Chapter 9. Competitive Landscape
- 9.1. Company Market Share Analysis – 2025
- 9.1.1. Global Zinc Agriculture Micronutrients Market: Company Market Share, 2025
- 9.2. Global Zinc Agriculture Micronutrients Market Company Market Share, 2024
- 9.1. Company Market Share Analysis – 2025
- Chapter 10. Company Profiles
- 10.1. The Mosaic Company
- 10.1.1. Company Overview
- 10.1.2. Key Executives
- 10.1.3. Product Portfolio
- 10.1.4. Financial Overview
- 10.1.5. Operating Business Segments
- 10.1.6. Business Performance
- 10.1.7. Recent Developments
- 10.2. Nouryon (formerly AkzoNobel Specialty Chemicals)
- 10.3. Haifa Group
- 10.4. Yara International ASA
- 10.5. Coromandel International Ltd.
- 10.6. Zinc Nacional S.A.
- 10.7. BASF SE (Agricultural Solutions)
- 10.8. ICL Group Ltd.
- 10.9. Aries Agro Limited
- 10.10. Nutrien Ltd.
- 10.11. Compo Expert GmbH
- 10.12. Others.
- 10.1. The Mosaic Company
- Chapter 11. Research Methodology
- 11.1. Research Methodology
- 11.2. Secondary Research
- 11.3. Primary Research
- 11.3.1. Analyst Tools and Models
- 11.4. Research Limitations
- 11.5. Assumptions
- 11.6. Insights From Primary Respondents
- 11.7. Why Custom Market Insights
- Chapter 12. Standard Report Commercials & Add-Ons
- 12.1. Customization Options
- 12.2. Subscription Module For Market Research Reports
- 12.3. Client Testimonials
List Of Figures
Figures No 1 to 41
List Of Tables
Tables No 1 to 51
Prominent Player
- The Mosaic Company
- Nouryon (formerly AkzoNobel Specialty Chemicals)
- Haifa Group
- Yara International ASA
- Coromandel International Ltd.
- Zinc Nacional S.A.
- BASF SE (Agricultural Solutions)
- ICL Group Ltd.
- Aries Agro Limited
- Nutrien Ltd.
- Compo Expert GmbH
- Others
FAQs
The key players in the market are The Mosaic Company, Nouryon (formerly AkzoNobel Specialty Chemicals), Haifa Group, Yara International ASA, Coromandel International Ltd., Zinc Nacional S.A., BASF SE (Agricultural Solutions), ICL Group Ltd., Aries Agro Limited, Nutrien Ltd., Compo Expert GmbH, Others.
The government regulations have a significant impact on the zinc agriculture micronutrients market in areas including fertilizer registration and quality requirements, subsidy program eligibility requirements, agricultural extension requirements, and food safety regulations on the maximum allowable zinc levels in soil and crops that collectively constitute the business and operational environment of the zinc fertilizer product development, marketing, and distribution. The Fertilizer Control Order, which controls the zinc micronutrient fertilizer products in India, as administered by the Ministry of Agriculture and Farmers Welfare, provides regulation of zinc micronutrient fertilizer products by mandating product registration, minimum zinc content requirements of the zinc forms labelled, prohibiting adulteration with low quality filler foods, and licensing zinc fertilizer manufacturers and distributors on a state level, with the quality control system of the FCO gradually enhancing the average quality of the products in the large zinc fertilizer market The Regulation 2019/1009 on EU Fertilising Products, which became fully operative in July 2022, is an EU regulation on zinc micronutrient fertilizers setting harmonized standards on zinc micronutrient fertilizers in the European Union including minimum zinc content in product category claims, allowed forms of zinc chemical in the CE-marked product, maximum levels of heavy metals such as cadmium (maximum of 150 mg/kg in micronutrient fertilizers), and the validation of product function claims The government fertilizer policy of the Pakistani government, which entails the distribution of fertilizers by government subsidies through the National Fertilizer Development Centre and provincial agriculture departments, affects the market dynamics of zinc fertilizers used by farmers by deciding which zinc fertilizers are part of the government subsidized fertilizer distributions which reach smallholder based consumers through the lower-than-market-price distribution channels. The fertilizer registration system of Ministério da Agricultura, Pecuária e Abastecimento that regulates label claims of zinc fertilizer products in Brazil also demands agronomic efficacy data to support label claims of zinc fertilizer products prior to registration approval, which is why manufacturers are motivated to undertake and publish field trial programs that simultaneously comply with regulatory reporting requirements and offer marketing services. The food contaminant maximum levels set by the Codex Alimentarius Commission – including zinc in various food commodities—limit the establishment of the food safety framework within which agricultural zinc usage should be reduced, and usual levels of food zinc are well less than Codex levels where zinc fertilizer application at agronomically feasible levels achieves the assurance that food safety is not a compromise in agricultural zinc usage.
Zinc agriculture micronutrient product pricing is extensive due to the variety of zinc forms, the product formulations, and the market segments. Zinc sulfate monohydrate – the most common market product in quantity – sells in bulk markets of commodities at USD 350-USD 600 per tonne of product when in bulk, at price levels that translate to USD 8-USD 25 per hectare amounts applied to typical cereal crop zinc defective applications. Zinc oxide in use as a seed treatment is sold at USD 1,200-USD 2,000 per tonne of material and application to seed treatment use rates of 100-500 grams per tonne of seed means very low application rates per hectare that make seed-applied zinc one of the most economically available use methods of zinc that exist. Synthetic chelated zinc products such as Zn-EDTA and Zn-DTPA cost USD 2,000-USD 5,000 per tonne of product, and foliar application rates of 200-500 grams product per hectare translate to USD 0.40-USD 2.50 per hectare of product per-application costs that are very economical with high-value horticultural crops where gross revenues per hectare of USD 5000-USD 50,000 The high-end ones, the amino acid-chelated zinc products, cost USD 4,000-USD 10,000 per tonne of product, with their excellent bioavailability offsetting the lower use rates that partially compensate for the higher product price in per-application economics for the high-end horticultural growers who make up their main market. The large price gap between commodity zinc sulfate and premium chelated zinc products where chelates cost 515 times more per ton, makes high-performance products like zinc sulfate preferred by price-sensitive smallholder markets in developing economies and high-value crop production systems, and high-value crop production systems adopt high-performance products like chelated zinc products based on their performance economics and not on unit price.
According to this analysis, the market is estimated to hit about USD 6.14 billion in 2035 due to the progressive development of zinc micronutrient adoption of the current early-to-mid adoption phase in Asia, Africa, and Latin America to mainstream agricultural practice as agronomic education, demonstration programs, and economic proof points continue to accumulate among communities of farmers in zinc-deficient regions, zinc-enriched NPK fertilizer product penetration rises through the commercial distribution channels of major producers of NPK to reach the hundreds of millions of smallholder farmers currently applying conventional NPK without micronutrient supplementation, the chelated zinc market growing rapidly as high-value horticultural production expands globally and precision agriculture adoption justifies premium product investment through demonstrated efficiency advantages, biofortification program expansion creating structured government-supported demand for zinc fertilization as a prerequisite for zinc-biofortified variety performance realization, precision agriculture adoption enabling field-scale zinc deficiency mapping and variable rate application that improves zinc fertilizer ROI and stimulates adoption at commercial scale farm operations, and Sub-Saharan Africa’s agricultural productivity improvement programs progressively incorporating zinc micronutrient supplementation as a standard component of smallholder crop nutrition packages, at a CAGR of 7.1% from 2026 to 2035.
Asia Pacific has been predicted to control the largest revenue share within the forecast period at about 46% of the global market share in 2025, based on the combination of having the most severe and widespread soil zinc deficiency issue in the world pertaining to the highly prevalent rice and wheat production systems in South and East Asia, the largest agricultural population in the world generating the largest absolute zinc fertilizer consumer group, India, and the largest zinc fertilizer consumer group in China, the world’s largest zinc agriculture micronutrient market, and the gradual increase of zinc-enriched NPK fertilizer products enabling zinc micronutrient delivery through existing fertilizer distribution channels reaching the smallest and most remote smallholder farm operations.
The largest market percentages are forecast to be in Asia Pacific, with a high growth rate in the forecast period of 8.0% CAGR due to the approximately 48% prevalence of soil zinc deficiency in India and 250,000-300,000 tonnes/annum consumption of zinc sulfate as a priority nutrient under the formula fertilization program in China and the continued expansion of newborn screening-linked biofortification programs in Bangladesh, Pakistan, and Nepal that cause zinc-deficient production systems to seek to adopt fertilizer adoption as smallholder incomes and agricultural extension infrastructure develop, and India’s and China’s zinc-enriched NPK fertilizer product launches creating convenient smallholder adoption pathways that accelerate zinc market penetration beyond specialty input channels.
It is projected that the International Zinc Association predicts a high growth rate in the Global Zinc Agriculture Micronutrients Market because of the 300+ zinc-biofortified cereal varieties releases launched by HarvestPlus that establish a direct programmatic market niche to the already established agronomic demand driver, the International Rice Research Institute has documented zinc deficiency in about 50% of the worlds cultivated soils that yield losses of 20-40% on deficient soils under conditions of zinc fertilization of wheat, and the ICAR has estimated that approximately 48% of Indian soils are zinc deficient with zinc fertilizer application producing average wheat yield increases of 3–8% on deficient soils representing compelling economic returns on fertilizer investment, WHO estimating approximately 2 billion people globally affected by dietary zinc deficiency linking agricultural zinc supplementation to human nutrition policy objectives, CIMMYT demonstrating that zinc fertilization of wheat on deficient soils achieves average grain yield responses of 0.5–1.5 tonnes per hectare representing 10–30% yield increases that economically justify fertilizer investment at current grain prices, HarvestPlus’s 300+ zinc-biofortified crop variety releases creating complementary demand for soil zinc supplementation to achieve biofortified variety nutritional potential, and government subsidy programs in India, Pakistan, and Bangladesh directly funding zinc fertilizer purchase by smallholder farmers creating programmatic market demand supplementing commercial adoption.