Water and Wastewater Treatment Market Size, Trends and Insights By Treatment Type (Physical Treatment (Sedimentation, Filtration, Screening, Flotation), Chemical Treatment (Coagulation/Flocculation, Disinfection, pH Adjustment, Advanced Oxidation), Biological Treatment (Activated Sludge, Membrane Bioreactor, MBBR, Anaerobic Digestion), Other Treatment Types (Ion Exchange, Electrochemical, Thermal Treatment)), By Technology (Membrane Filtration (UF, MF, NF), Reverse Osmosis (SWRO, BWRO, NF), UV Disinfection, Activated Sludge & Biological Nutrient Removal, Ion Exchange & Adsorption (GAC, IX Resins), Advanced Oxidation Processes (Ozone, Fenton, UV-H₂O₂), Other Technologies (Electrocoagulation, Constructed Wetlands)), By Application (Municipal Water Treatment (Drinking Water Production), Industrial Water Treatment (Process Water, Cooling Water, Boiler Feed), Municipal Wastewater Treatment (Secondary and Tertiary Treatment), Industrial Wastewater Treatment (Effluent Treatment, ZLD), Agricultural Water Management (Irrigation Water Treatment, Drainage Treatment), Other Applications (Stormwater, Desalination, Water Reuse)), By End-Use (Municipalities & Public Utilities, Power Generation (Thermal, Nuclear, Renewable), Oil & Gas (Produced Water, Process Water), Food & Beverage, Pharmaceuticals & Healthcare, Mining & Metals, Other End-Uses (Textiles, Pulp & Paper, Semiconductors)), and By Region - Global Industry Overview, Statistical Data, Competitive Analysis, Share, Outlook, and Forecast 2026 – 2035
Report Snapshot
CAGR: 5.8%
| Study Period: | 2026-2035 |
| Fastest Growing Market: | Asia Pacific |
| Largest Market: | Asia Pacific |
Major Players
- Veolia Environment S.A.
- Suez S.A.
- Xylem Inc.
- AECOM
- Others
Reports Description
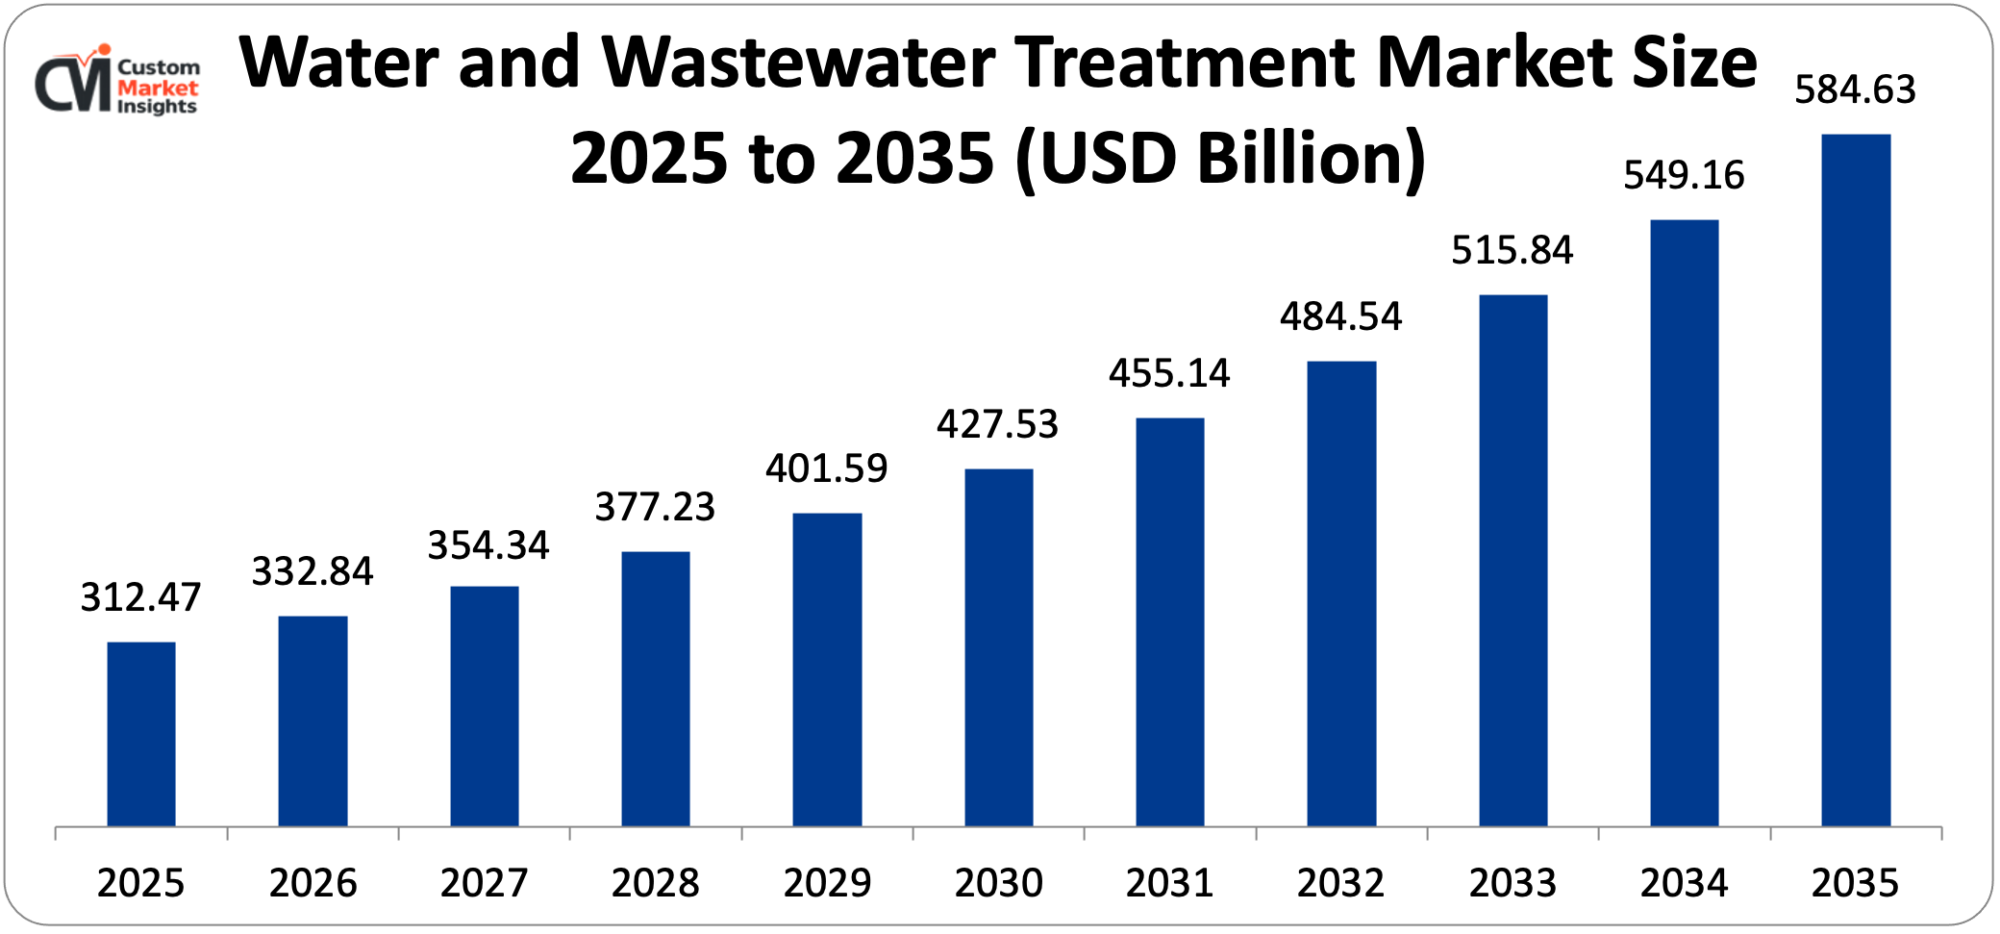
The total market size of the global water and wastewater treatment has been estimated at USD 312.47 billion in 2025 and is expected to grow to between USD 332.84 billion in 2026 and around USD 584.63 billion in 2035 with a CAGR of 5.8% over the period of 2026-2035.
The increasing global water stress due to population increase, urbanization, agricultural intensification, and precipitation pattern changes due to climate change, which together increase the amount of freshwater available and the amount of demand exerted by the municipal, industrial, and agricultural users creating an urgent investment requirement in water treatment plants, the increasing desalination investment in water-scarce Middle Eastern, North African, and coastal developing country markets, expanding the quantity of addressable treatment market beyond the conventional freshwater supply, and the ever-improving treatment technologies such as membrane filtration, advanced oxidation, and biological nutrient removal delivering superior treatment performance at progressively lower lifecycle costs collectively drive robust and sustained market growth throughout the forecast period.
Market Highlight
- Asia Pacific, with the market share of 36% in 2025, was the top market in the water and wastewater treatment market.
- Asia Pacific is also projected to grow by the highest CAGR of 7.2% between 2026 and 2035.
- By type of treatment, the biological treatment section had taken nearly 34% of the market share in 2025.
- By type of treatment, the chemical treatment segment will have the highest CAGR of 6.4% between 2026 and 2035.
- By technology, the membrane filtration segment provided the largest market share of 28% in 2025, and the reverse osmosis segment is likely to increase the CAGR at the highest rate of 8.6% during the forecast period between 2026 and 2035.
- The municipal wastewater treatment market segment has the best market share of 32% in 2025 and the industrial water treatment market segment will increase with the highest CAGR of 7.4% between 2026 and 2035.
- By end-use, the municipalities & public utilities segment will have the highest market share of 48% in 2025, and the oil and gas segment will have the highest rate of 7.8% CAGR between 2026 and 2035.
Significant Growth Factors
The Water and Wastewater Treatment Market Trends present significant growth opportunities due to several factors:
- Global Water Scarcity Crisis and Infrastructure Investment Gap Driving Unprecedented Market Demand:
The ever escalating global water scarcity crisis, comprising of significant drivers of growth in population through the addition of 80 million people to global water demand per year, climate change through shrinking snowpacks and glaciers in their freshwater storage capacity and increasing evapotranspiration and drought frequency and severity, groundwater depletion through unsustainable agricultural extraction to a surpassing natural rate of recharge across the main aquifer systems of India, China, the United States, and the Middle East, and augmented industrial and urban water demand through economic development in water-thirsty developing countries. According to the estimates of the United Nations Environment Programme, the world will face an estimated water shortage of about 40% of the available fresh water supply by 2030 in the world without change in consumption patterns, that is, the supply-demand gap of water will be met by a combination of demand reduction, water reuse and recycling which would need treatment infrastructure and the development of alternative water sources such as desalination and rainwater harvesting that would require treatment technology investment.
According to the estimates by the World Bank, so as to achieve accessibility amongst all populations to safe and managed drinking water and sanitation services (Sustainable Development Goal 6 targets), it is estimated that the amount of USD 114 billion should be invested in worldwide water and sanitation facilities yearly compared with the current annual investment which is estimated to be USD 28 billion which defines the potential market opportunity in front of water treatment equipment manufacturers, technology developers, project developers and service providers. The most critical global water infrastructure shortage is in Sub-Saharan Africa, South Asia, and Southeast Asia, where today’s increasing urban population is exceeding the water and sanitation infrastructure increase but is also of material concern in developed economies as aging water infrastructure is in need of replacement investment, with the American Society of Civil Engineers rating U.S. drinking water infrastructure as having a D+ rating and estimating USD 1 trillion of required investment in 25 years to modernize the U.S. water system.
Climate change is not only exacerbating water shortages but also posing new treatment challenges, as the severity of droughts is decreasing the availability of source water and forcing the development of alternative supplies, the frequency of floods is continuing to increase the pathogen load in the source water and turbidity forcing the treatment to ever-increasing levels, rising seawater temperatures affecting the efficiency of desalination plants, and sea level rise is threatening to salinize coastal freshwater aquifers forcing the development of drinking water treatment that drives the growth of water treatment demand, which is structural, sustained, and intensifying over the forecast period.
- Regulatory Tightening and Emerging Contaminant Treatment Requirements Driving Technology Upgrades:
The increasing effective worldwide standards of the quality of drinking water and the limit of wastewater discharge, which are caused by the increasing analytical detection limits that lower-level chemical pollution can be detected by, the increased epidemiological research about the chronic effects of low-level chemical contamination, and the rising interest of the general public and government in emerging pollutants such as PFAS, microplastics, pharmaceutical residues, and antibiotic-resistant bacteria, are compelling treated drinking water and wastewater treatment plants to upgrade treatment technology requirements, which necessitate large amounts of capital and operating expenses.
The completed maximum contaminant level of six PFAS compounds in drinking water proposed by the U.S. EPA, setting maximum contaminant levels of 4 parts per trillion of PFOA and 4 parts per trillion of PFOS in drinking water, sets compliance treatment requirements on about 66,000 public water systems in the United States that have to install PFAS treatment systems to reduce compliance levels within the regulatory implementation schedule. The new Drinking Water Directive by the European Union, which sets a total PFAS upper limit of 100 nanograms per liter and individual PFAS limits of 10 nanograms per liter, imposes similar PFAS treatment requirements on all European water utilities that will necessitate the extensive treatment infrastructure investment to meet compliance requirements across the thousands of water supply systems in Europe.
The adoption of biological and chemical nutrient removal technology in wastewater treatment plants all over the world is being fueled by nutrient removal regulations, namely, the tightening of total nitrogen and total phosphorus discharge limits at municipal wastewater treatment plants to protect water bodies receiving them against eutrophication, both the Urban Wastewater Treatment Directive revision in the EU and the development of nutrient criteria by the U.S. EPA, creating regulatory conduits to stricter nutrient discharge limits that will lead to investment in upgrading wastewater treatment plants throughout the forecast period. The global convergence of regulation towards more inclusive and strict drinking water quality standards through the periodic updating of its Guidelines on Drinking Water Quality, including new contaminants and lower guideline values as health evidence mounts, gradually impacts the regulatory frameworks in over 120 countries, pushing the treatment technology investment worldwide rather than the regulatory jurisdiction of the EU and the United States.
What are the Major Advances Changing the Water and Wastewater Treatment Market Today?
- Advanced Membrane Technology Innovation Enabling Higher Performance and Lower Energy Consumption:
It is due to the ongoing development of membrane filtration technology, including ultrafiltration, nanofiltration, reverse and forward osmosis membranes, through improvements in the chemistry of membrane materials, module design, fouling resistance, and energy recovery engineering, that water treatment systems are now able to attain progressively improved water quality at reduced energy consumption and extended service life of the membrane, making the membrane treatment less costly than less efficient conventional treatment options and offering an increasing number of demanding source water and industrial process applications where membrane treatment can be economically justified. Advances in polyamide membrane chemistry and interfacial polymerization manufacturing control have improved permeate flux by about 40 and salt rejection by about 0.5%age points over the last decade, in what has become the standard technology, namely, thin film composite reverse osmosis membranes, which have the effect of reducing capital cost and concentrate disposal volume, respectively, in capital cost reduction and sea water recovery process respectively.
The application of aquaporin-coated biomimetic membrane concepts – incorporating natural water channel proteins into membranes formed by thin-film composites to obtain a higher water permeability using the ability of the protein channels to select aqueous molecules as the primary transport mode – has gone past laboratory concept to commercial manufacture with Aquaporin A/S and similar developers developing biomimetic membrane elements with a 3 -10 fold higher water permeability compared to standard polyamide membranes and can maintain salt rejection – the high cost of biomimetic membranes is Low-pressure ultrafiltration membranes – yielding 4-log virus removal, and 6-log Cryptosporidium removal as primary treatment barriers in both direct and membrane bioreactor modes of operation – have achieved energy savings of less than 0.05 kWh per cubic meter of treated water through optimisation of hollow fiber membrane module design, operating pressure minimisation and air scouring system optimisation that together achieve a minimum operating cost of membrane bioreactor operation comparable to that of conventional activated sludge equivalence to justify the high energy cost of membrane treatment.
FILMTEC of DowDuPont, Toray industries, Hydranautics and Koch Separation Solutions are the most popular reverse osmosis and ultrafiltration membrane producers, constantly improving the functioning of membranes and gradually decreasing the cost of manufacturing an element with the help of scale of production and innovation of materials.
- Digital Water Technology and Smart Treatment System Intelligence:
The application of digital water technologies – including advanced sensor networks that enable real-time monitoring of multiple parameters of water quality, treatment optimization algorithms based on artificial intelligence, the design and operation of treatment plants through digital twins and simulators, predictive agent maintenance platforms that forecast equipment failures, as well as integrated supervisory control and data acquisition systems that provide real-time operation intelligence – are changing the process of water and wastewater treatment plants by turning their operations into continuously optimized, data-driven, and continuously sensed treatment processes that achieve higher treatment efficacy, reduced Water quality sensors that can continuously measure the dissolved oxygen, turbidity, UV absorbance, nitrate, phosphate, ammonia, pH, and conductivity are deployed across the treatment trains between source water intake and the terminal point of distribution systems give the measurement infrastructure needed to control automated closed-loop treatment processes to respond to changes in water quality within minutes as opposed to the lag time of hours and days in the manual grab sampling and laboratory analysis processes. Predictive chemical dosing using AI-powered treatment optimization algorithms that consume continuous sensor data streams alongside weather forecasting, influent quality predictions, and correlations between past treatment performance allows the reduction of coagulant, disinfectant, and nutrient removal chemical dosing by 10–30% of the amount of chemical input at the time of digital technology deployment necessary to maintain consistent effluent quality at typical water utility operating cost structures and, at the same time, can save direct operating costs by 12–36 months of operation.
The digital twin technology that develops the computational models of the water treatment plants to simulate the performance of the treatment process under conditions of different functioning of the plant, allowing the virtual testing of the process changes before their physical implementation and providing the operator training environment that replicates the actual plant behavior under a smaller risk of uncertainty in the experimental conditions, is being adopted by the major water utilities such as Thames Water, Veolia Water, and the Singaporean PUB to optimize the current performance of the water treatment plant and to design new treatment facilities with a less significant risk of uncertainty in the experimental conditions. The leading commercial applications of digital water platform technology that are changing the operations of municipal and industrial treatment plants around the world include IBM Water Intelligence Suite, Xylem Vue Smart Analytics, Suez Aquadvanced platform, and Schneider Electric EcoStruxure Water.
- Zero Liquid Discharge and Water Circular Economy Technology Advancement:
The increasing use of zero liquid discharge technology whereby industrial water consumers treat and recycle almost all their process water to be reused, instead of releasing treated effluent into water receivers, is establishing one of the most booming technology segments within the industrial water treatment market due to the water scarcity in the area of industrial operations, ever stricter wastewater discharge permit limits, which in some regulatory jurisdictions have reached zero discharge limits, and corporate water stewardship commitments by large industrial companies that make ZLD implementation of facilities in water-stressed areas a strategic priority — applying reverse osmosis concentration, brine concentrators, crystallizers and evaporators in sequence to concentrate dissolved solids until only water-free solid crystals of salt are left as waste, which is then returned as treated water to the industrial process and dissolved pollutants converted to controllable solid wastes.
The growth in the ZLD market is concentrated in water-intensive sectors in water-stressed geographies, such as textile manufacturing in India, China, and Bangladesh where regulatory implementation of high wastewater discharge limits and water scarcity is driving both ZLD adoption and power plant cooling water treatment in arid regions where consumptive use of cooling water is controlled and semiconductor manufacturing where semiconductor manufacture requires ultrapure water forcing treatment investment irrespective of regulatory requirement. A conceptual shift in how wastewater is viewed, water circular economy thinking, where the wastewater is reimagined as a water resource to be harvested and reshaped, instead of a waste stream, is finding its way into the industrial sector where water expenses are real, and into the municipal sector where water reclamation is serving as a response to augment more traditionally treated freshwater in water-stressed regions to be used as a water resource.
The NEWater program in Singapore, which yields about 40% of local water demand on highly treated reclaimed water through the use of advanced membrane treatment and UV disinfection, and the Orange County Water District Groundwater Replenishment System in California, which yields over 130 million gallons per day of purified reclaimed water using the technology of microfiltration, reverse osmosis and UV-hydrogen peroxide advanced oxidation, are the most advanced municipal water reuse programs in the world that suggest the technical maturity and social acceptance of advanced water recycling technology.
Category Wise Insights
By Treatment Type
Why Does Biological Treatment Lead the Market?
Biological treatment is the largest treatment type segment at about 34% of total market share in 2025, as it is the basis of municipal infrastructure of wastewater treatment systems throughout the world – the core of which is the activated sludge biological treatment processes, which form the core secondary treatment process at about 99% of the world mileage of about 500,000 municipal wastewater treatment plants in the world – and because existing biological treatment infrastructure represents the accumulated investment of decades of municipal wastewater treatment system construction that forms the largest installed base of the water treatment market. With a 10-plus-century history of service as the worldwide standard secondary wastewater treatment technology, the activated sludge process, whereby mixed liquor suspended solids, consisting of aerobic microorganisms, biologically oxidize dissolved and suspended organic material in wastewater under aerated conditions, and then clarification is performed to separate treated effluent and settled biological sludge, has proven to be a reliable, cost-effective means of organic carbon and suspended solids removal in wastewater of nearly inorganic carbon and suspended dissolved organic content, with discharge standards at the secondary treatment level.
The fastest-expanding biological treatment technology has been the membrane bioreactor – integrating a biological treatment process with membrane ultrafiltration to eliminate secondary clarification and yet to achieve consistently higher effluent quality than activated sludge – has become the leading biological treatment process in application due to needs of water reuse to obtain high-quality effluent out, urban plant upgrades where space constraints force vertical MBR installation to give site area benefits, and industrial wastewater treatment where high-quality effluent is needed to proceed to either direct reuse or direct discharge to sensitive receiving water. Overall type of treatment is currently enjoying the fastest growth rate of 6.4% between 2026 and 2035 due to the PFAS treatment compliance tsunami which needs activated carbon adsorption, advanced oxidation process, and electrochemical treatment of contaminants that cannot be degraded by biological processes, coagulation improvement and adoption of alternative disinfectants is driven by the growing industrial advanced wastewater treatment sector, and contaminants that remain recalcitrant to biological degradation.
By Technology
Why Does Membrane Filtration Lead the Market?
Membrane filtration is the largest of the technology segments with a total market share of 28% of the total market share in 2025 which is due to the wide range of uses and applications of the technology in drinking water treatment, wastewater reclamation, industrial process water treatment and desalination applications that make the technology the most widely used approximately across the entire range of water treatment applications.
The commercial pre-eminence of membrane filtration is indicative of several concomitant drivers of adoption: a physical barrier exclusion of pathogens such as Cryptosporidium and Giardia that allows smaller doses of disinfection to be used and fewer disinfection byproducts to be formed, a constant quality of effluent despite variation in feed water that in turn makes management of treatment facilities easier than chemically dosed conventional treatment, its small physical footprint allowing the enhancement of treatment capacity on limited land, and its scalability both to small community-scale systems and large met Reverse osmosis is the fastest expanding market with the highest CAGR of 8.6% between 2026 and 2035 due to the expansion of seawater desalination capacity in the Middle East, North Africa, and developing countries with coastal areas, amplified demand and use of high-pressure RO systems in drinking water utilities, brackish water treatment industrial and agricultural applications in inland water-scarce areas, and zero liquid discharge systems that will use multi-stage RO concentration as the key brine management technology.
The ongoing downward cost curve of RO membrane elements which are further boosted by the growth in the number of applications in which RO can achieve acceptable ROI as compared to traditional methods of treatment that include FILMTEC and Toray steadily increasing the number of applications they are applicable to is additional confirmation of the fact that the RO market continues to grow.
By Application
Why Does Municipal Wastewater Treatment Lead the Market?
The largest application segment is represented by municipal wastewater treatment at around 32% of total market share in 2025 (in light of the massive capital investment in the municipal wastewater treatment infrastructure worldwide), with the US alone having around 16,000 publicly owned treatment works operating under the Clean Water Act permits, Europe operating over 100,000 wastewater treatment plants under the Urban Wastewater Treatment Directive, and developing economies investing growing capital in wastewater collection and treatment systems to deal with the reported public health and environmental impacts of untreated wastewater discharge.
The market size of municipal wastewater treatment indicates the operating cost of the existing treatment plants which is the consistent revenue base based on using energy, chemicals and services consumed in the continuous treatment processes — and the capital investment in the construction, upgrade, and expansion of treatment plants which is the largest element of water sector infrastructure investment in the world. The fastest growing is industrial water treatment with a CAGR of 7.4% between 2026 and 2035 because industrial water scarcity in manufacturing areas is driving water recycling and reuse investment, zero liquid discharge implementation in textile, semiconductor and chemical manufacturing, industrial wastewater discharge permits tightening forcing increased technology of more advanced water treatment and corporate water stewardship commitments are driving voluntary water efficiency investment by major multinational manufacturers beyond regulatory minimums.
By End-Use
Why Do Municipalities & Public Utilities Lead the Market?
The largest end-use is municipalities and public utilities with about 48% of the market share in 2025, a result of the role of public water and wastewater utilities as the main operators of water treatment systems in the world – the treatment of drinking water to an annual population of billions and the treatment of urban water sources of wastewater through the regulated model of public utility that defines water services in developed countries and is also more prevalent in developing countries as urbanization leads to centralization of water services out of the fragmented system of community water supply.
The end-use market in municipal utilities is featured by a long asset life span of 20-40 years; a revenue recovery rate that is regulated and offers revenue security that facilitates infrastructure expenditure, government support of investment in the form of grants and concessional financing, and non-discretionary service demands that make municipal water treatment investment resistant to recession unlike most infrastructure investments. The end-use segment showing the highest growth rate of 7.8% between 2026 and 2035 is the oil and gas segment due to the challenge of managing or treating the unconventional oil and gas production produced water, namely hydraulic fracturing operations resulting in large amounts of highly saline and chemically complex produced water that needs to be treated before reuse or disposal.
Report Scope
| Feature of the Report | Details |
| Market Size in 2026 | USD 332.84 billion |
| Projected Market Size in 2035 | USD 584.63 billion |
| Market Size in 2025 | USD 312.47 billion |
| CAGR Growth Rate | 5.8% CAGR |
| Base Year | 2025 |
| Forecast Period | 2026-2035 |
| Key Segment | By Treatment Type, Technology, Application, End-Use and Region |
| Report Coverage | Revenue Estimation and Forecast, Company Profile, Competitive Landscape, Growth Factors and Recent Trends |
| Regional Scope | North America, Europe, Asia Pacific, Middle East & Africa, and South & Central America |
| Buying Options | Request tailored purchasing options to fulfil your requirements for research. |
Regional Analysis
How Big is the Asia Pacific Market Size?
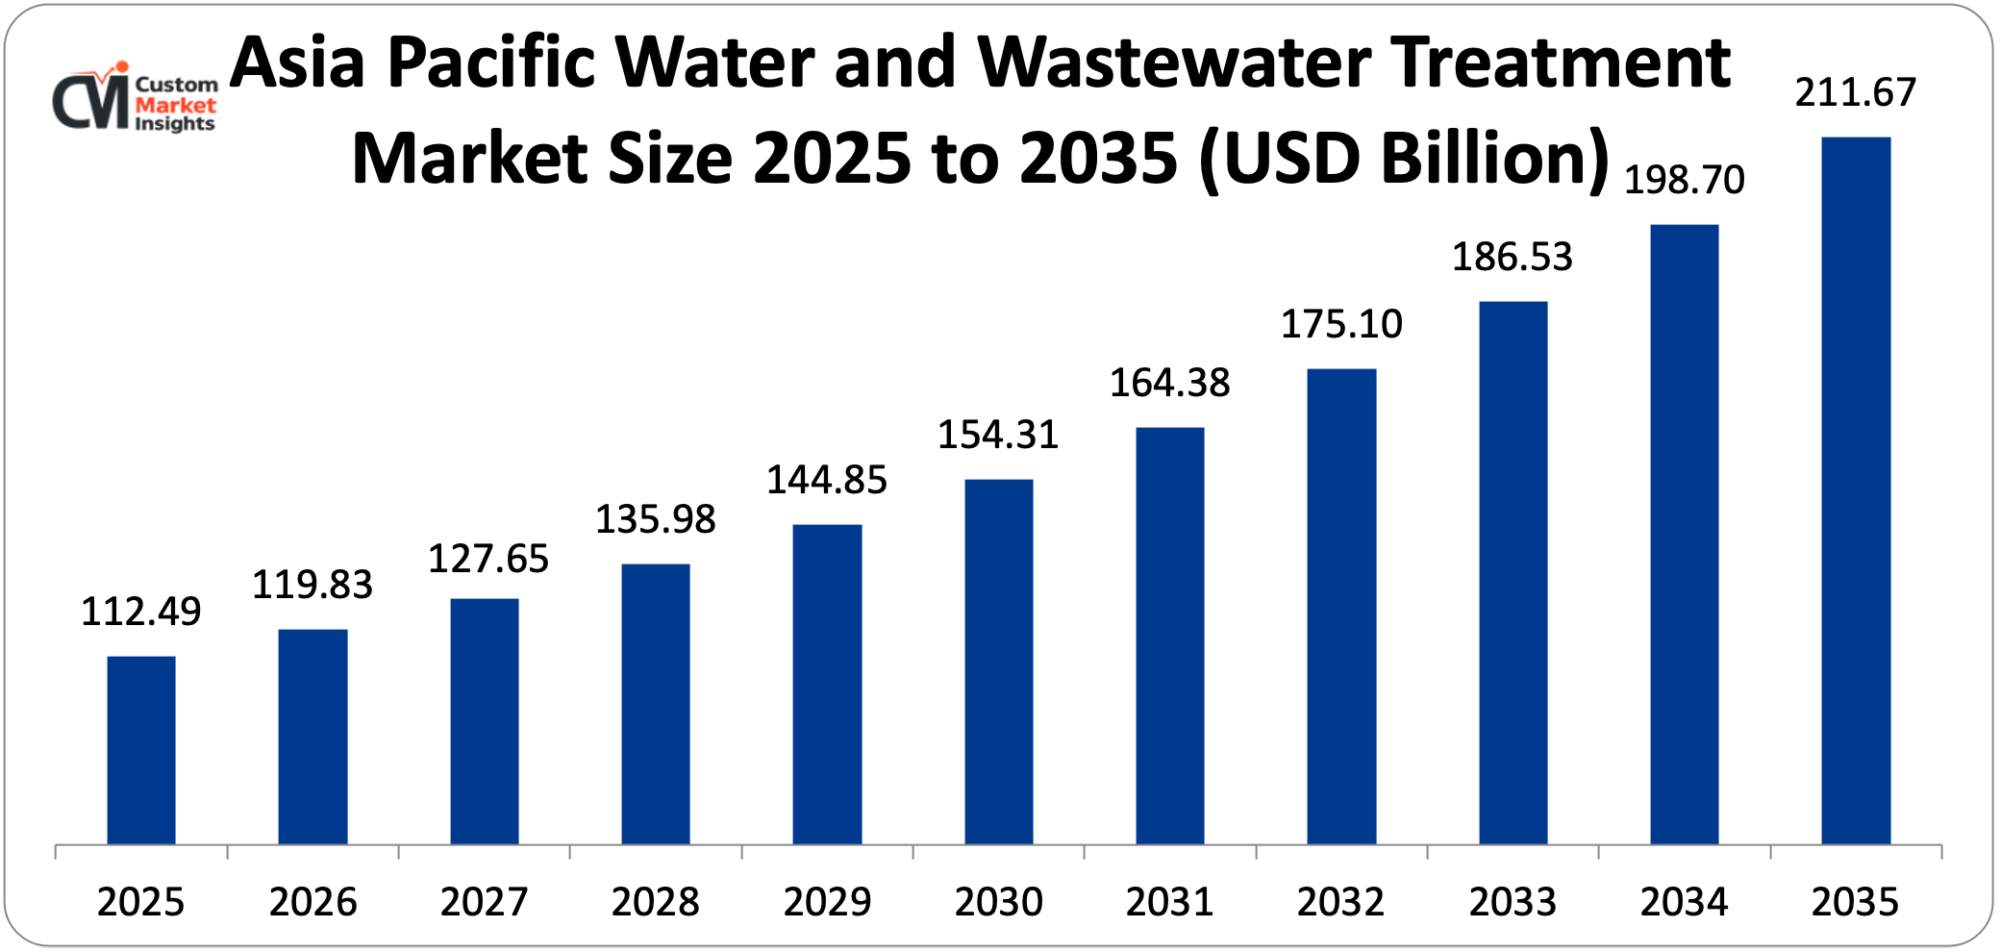
The Asia Pacific water and wastewater treatment market size is estimated at USD 112.49 billion in 2025 and is projected to reach approximately USD 211.67 billion by 2035, with a CAGR of 6.5% from 2026 to 2035.
Why Did Asia Pacific Dominate the Market in 2025?
In 2025, Asia Pacific controls some 36% of the world market share, representing the concentration of the largest water-stressed population globally, 3.6 billion people in Asia with only one month of water per annum estimated in the published water stress assessments, the highest rate of urban population growth, which necessitates municipal water and wastewater infrastructure investment, the largest industrial manufacturing base on the planet, manufacturing the greatest industrial process water and wastewater treatment services, and the governmental level of promotion of water infrastructure in China, India, and Southeast Asian countries due to the policy priorities.
The water treatment market in China, the largest single national market in water treatment in the world, is stimulated by the massive investment of the government in water infrastructure under the 14th and 15th Five-Year Plan, the Water Ten Action Plan for comprehensive improvement in water quality of the major river systems and lakes in China, the Sea of Sponge City program of urban stormwater management, and the increasing enforcement of industrial wastewater treatment that is leading to compliance investments at the industrial plants of China in its manufacturing provinces. The water treatment market in India, the second most populous country in the world, with acute shortages of urban water supply and gaps in regulating the treatment of industrial wastewater, is rapidly increasing investment across the Jal Jeevan Mission of universal household tap water connection, the AMRUT 2.0 of urban water infrastructure modernization initiative, and the National River Conservation Plan of pollution control in the major river systems in India such as Ganga and Yamuna.
Why is North America an Important and Mature Market?
The size of the water and wastewater treatment market in North America is projected to be about USD 87.5 billion in 2025, and is expected to be about USD 148.2 billion in 2035 with a CAGR of 5.4. The North American water treatment is the most capital-intensive market in the world on a per-capita basis in terms of its developed treatment standards, replacement infrastructure demands, and high technological sophistication of the North American water utilities – and is supported by the fact that the United States, on its part, is the second-largest national water treatment market in the world, second only to China. The near-term definition of the U.S. market is being characterized by the PFAS MCL compliance investment wave, which demands water treatment technology upgrades at roughly 66,000 public water systems, the USD 55 billion of water and wastewater investment provided in the Bipartisan Infrastructure Law, the Lead and Copper Rule Improvements which demand lead service line replacement by water utilities in every state of the U.S.; and the expanding use of water reuse programs by the water-scarce western U.S. states. The water treatment market of Canada is propelled by the First Nation community water infrastructure investment within the country in response to long time boil water advisories on the First Nations reserves, the aging infrastructure in the big cities of Canada that necessitates upgrade, and the oil sands generated water treatment market in Alberta which is a major industrial water treatment segment not found anywhere in the Canadian market.
Why is Europe a Strategically Important Market?
The European water and wastewater treatment market has an estimated value of about USD 84.6 and a projected value of about USD 143.8 in the years 2025 and 2035 respectively with a CAGR of 5.5. Europe is a fundamentally strategically important market necessitating the comprehensive and increasingly restrictive regulatory and water quality framework of the EU the Water Framework Directive with its ecological quality goals of European water bodies, the revised Drinking Water Directive featuring limits on PFAS and more extensive microbiological and chemical quality requirements, and the revised Urban Wastewater Treatment Directive mandating the removal of nutrients and treatment of micropollutants in wastewater plants, in aggregate impose recurrent treatment technology investment burdens on the water utilities of the European Union.
The three largest European national water treatment markets are Germany, France, and the United Kingdom which together have about 55% of European market revenue sharing by the fact that they have large municipal water utility sectors, a high level of industrial production that creates process water treatment demand, and that the EU has the most strict implementation of national environmental standards. The escalating water stress in southern Europe (Spain, Portugal, Italy, Greece, and Cyprus), with more frequent and severe droughts increasingly affecting the region, is fueling accelerating investment in desalination and adoption of water reuse that is redefining the traditional infrastructure-replacement led nature of the European water treatment market towards more new capacity investment that resembles water-scarce developing markets.
Why is the Middle East & Africa an Increasingly Critical Market?
The most urgent water treatment investment imperative in the world is seen in the LAMEA region, with the Middle East having the greatest desalination capacity per capita globally as the key response to the fact that the region contains little to no conventional freshwater resources, Sub-Saharan Africa has the greatest absolute water and sanitation infrastructure access deficit, and Latin America is both struggling with water quality issues in rapidly growing megacities and with a lack of wastewater treatment capacity in the large mining, agricultural, and manufacturing sectors.
The National Water Strategy of Saudi Arabia is based on achieving 70% of desalination-based water delivery and 100% of treated wastewater reuse in agricultural activities by the year 2030, which is encouraging increased investment in larger SWRO desalination capacity and increased wastewater reclamation, currently making Saudi Arabia one of the most ambitious national programs of water treatment investment in the world. The water security plan of the UAE, which presupposes the realization of almost 100% of reuse of the treated wastewater through a set of reclaimed water systems supplying landscape irrigation, industrial cooling, and aquifer recharge, offers the world a model of a small, water-scarce, high-income country to achieve water security by the help of technology-intensive water circular economy strategies. The water treatment market in Africa is defined by a giant gap in infrastructure development, i.e. the 400 million Sub-Saharan Africans who have no access to safely managed drinking water which is the largest single market opportunity in terms of water treatment infrastructure development than any other world region of the world.
Top Players in the Market and Their Offerings
- Veolia Environment S.A.
- Suez S.A.
- Xylem Inc.
- Evoqua Water Technologies (Xylem)
- AECOM
- Jacobs Engineering Group Inc.
- Pentair plc
- DuPont de Nemours Inc. (Water Solutions)
- Toray Industries Inc.
- O. Smith Corporation
- Kurita Water Industries Ltd.
- Others
Key Developments
The market has undergone significant developments as industry participants seek to advance PFAS treatment solutions, expand digital water platform capabilities, and respond to the unprecedented global water infrastructure investment wave driven by regulatory requirements, climate change adaptation, and development finance programs.
- In October 2024: Xylem declared the business release of its PFAS360 treatment product group – combining the application of granular activated carbon adsorption, high-pressure nanofiltration membrane treatment, and UV-advanced oxidation procedure technologies in a skid-mounted treatment arrangement specially designed to accommodate the PFAS compliance requirement of the public water systems in the United States – the about 66,000 public water systems in the United States will have to evaluate and invest in PFAS treatment technology under the EPA compliance plan.
- In February 2025: Veolia launched a 25-year design-build-operate contract for a new 600,000 cubic meter per day seawater reverse osmosis desalination plant at Jubail in Saudi Arabia the largest SWRO desalination project contract by capacity to be awarded worldwide in 2025 under a public-private partnership arrangement with the Saudi Water Authority, the largest single water infrastructure announcement made in the global water sector in the period.
The Water and Wastewater Treatment Market is segmented as follows:
By Treatment Type
- Physical Treatment (Sedimentation, Filtration, Screening, Flotation)
- Chemical Treatment (Coagulation/Flocculation, Disinfection, pH Adjustment, Advanced Oxidation)
- Biological Treatment (Activated Sludge, Membrane Bioreactor, MBBR, Anaerobic Digestion)
- Other Treatment Types (Ion Exchange, Electrochemical, Thermal Treatment)
By Technology
- Membrane Filtration (UF, MF, NF)
- Reverse Osmosis (SWRO, BWRO, NF)
- UV Disinfection
- Activated Sludge & Biological Nutrient Removal
- Ion Exchange & Adsorption (GAC, IX Resins)
- Advanced Oxidation Processes (Ozone, Fenton, UV-H₂O₂)
- Other Technologies (Electrocoagulation, Constructed Wetlands)
By Application
- Municipal Water Treatment (Drinking Water Production)
- Industrial Water Treatment (Process Water, Cooling Water, Boiler Feed)
- Municipal Wastewater Treatment (Secondary and Tertiary Treatment)
- Industrial Wastewater Treatment (Effluent Treatment, ZLD)
- Agricultural Water Management (Irrigation Water Treatment, Drainage Treatment)
- Other Applications (Stormwater, Desalination, Water Reuse)
By End-Use
- Municipalities & Public Utilities
- Power Generation (Thermal, Nuclear, Renewable)
- Oil & Gas (Produced Water, Process Water)
- Food & Beverage
- Pharmaceuticals & Healthcare
- Mining & Metals
- Other End-Uses (Textiles, Pulp & Paper, Semiconductors)
Regional Coverage:
North America
- U.S.
- Canada
- Mexico
- Rest of North America
Europe
- Germany
- France
- U.K.
- Russia
- Italy
- Spain
- Netherlands
- Rest of Europe
Asia Pacific
- China
- Japan
- India
- New Zealand
- Australia
- South Korea
- Taiwan
- Rest of Asia Pacific
The Middle East & Africa
- Saudi Arabia
- UAE
- Egypt
- Kuwait
- South Africa
- Rest of the Middle East & Africa
Latin America
- Brazil
- Argentina
- Rest of Latin America
Table of Contents
- Chapter 1. Report Introduction
- 1.1. Report Description
- 1.1.1. Purpose of the Report
- 1.1.2. USP & Key Offerings
- 1.2. Key Benefits For Stakeholders
- 1.3. Target Audience
- 1.4. Report Scope
- 1.1. Report Description
- Chapter 2. Market Overview
- 2.1. Report Scope (Segments And Key Players)
- 2.1.1. Water and Wastewater Treatment by Segments
- 2.1.2. Water and Wastewater Treatment by Region
- 2.2. Executive Summary
- 2.2.1. Market Size & Forecast
- 2.2.2. Water and Wastewater Treatment Market Attractiveness Analysis, By Treatment Type
- 2.2.3. Water and Wastewater Treatment Market Attractiveness Analysis, By Technology
- 2.2.4. Water and Wastewater Treatment Market Attractiveness Analysis, By Application
- 2.2.5. Water and Wastewater Treatment Market Attractiveness Analysis, By End-Use
- 2.1. Report Scope (Segments And Key Players)
- Chapter 3. Market Dynamics (DRO)
- 3.1. Market Drivers
- 3.1.1. Global Water Scarcity Crisis and Infrastructure Investment Gap Driving Unprecedented Market Demand
- 3.1.2. Regulatory Tightening and Emerging Contaminant Treatment Requirements Driving Technology Upgrades
- 3.2. Market Restraints
- 3.3. Market Opportunities
- 3.5. Pestle Analysis
- 3.6. Porter Forces Analysis
- 3.7. Technology Roadmap
- 3.8. Value Chain Analysis
- 3.9. Government Policy Impact Analysis
- 3.10. Pricing Analysis
- 3.1. Market Drivers
- Chapter 4. Water and Wastewater Treatment Market – By Treatment Type
- 4.1. Treatment Type Market Overview, By Treatment Type Segment
- 4.1.1. Water and Wastewater Treatment Market Revenue Share, By Treatment Type, 2025 & 2035
- 4.1.2. Physical Treatment (Sedimentation, Filtration, Screening, Flotation)
- 4.1.3. Water and Wastewater Treatment Share Forecast, By Region (USD Billion)
- 4.1.4. Comparative Revenue Analysis, By Country, 2025 & 2035
- 4.1.5. Key Market Trends, Growth Factors, & Opportunities
- 4.1.6. Chemical Treatment (Coagulation/Flocculation, Disinfection, pH Adjustment, Advanced Oxidation)
- 4.1.7. Water and Wastewater Treatment Share Forecast, By Region (USD Billion)
- 4.1.8. Comparative Revenue Analysis, By Country, 2025 & 2035
- 4.1.9. Key Market Trends, Growth Factors, & Opportunities
- 4.1.10. Biological Treatment (Activated Sludge, Membrane Bioreactor, MBBR, Anaerobic Digestion)
- 4.1.11. Water and Wastewater Treatment Share Forecast, By Region (USD Billion)
- 4.1.12. Comparative Revenue Analysis, By Country, 2025 & 2035
- 4.1.13. Key Market Trends, Growth Factors, & Opportunities
- 4.1.14. Other Treatment Types (Ion Exchange, Electrochemical, Thermal Treatment)
- 4.1.15. Water and Wastewater Treatment Share Forecast, By Region (USD Billion)
- 4.1.16. Comparative Revenue Analysis, By Country, 2025 & 2035
- 4.1.17. Key Market Trends, Growth Factors, & Opportunities
- 4.1. Treatment Type Market Overview, By Treatment Type Segment
- Chapter 5. Water and Wastewater Treatment Market – By Technology
- 5.1. Technology Market Overview, By Technology Segment
- 5.1.1. Water and Wastewater Treatment Market Revenue Share, By Technology, 2025 & 2035
- 5.1.2. Membrane Filtration (UF, MF, NF)
- 5.1.3. Water and Wastewater Treatment Share Forecast, By Region (USD Billion)
- 5.1.4. Comparative Revenue Analysis, By Country, 2025 & 2035
- 5.1.5. Key Market Trends, Growth Factors, & Opportunities
- 5.1.6. Reverse Osmosis (SWRO, BWRO, NF)
- 5.1.7. Water and Wastewater Treatment Share Forecast, By Region (USD Billion)
- 5.1.8. Comparative Revenue Analysis, By Country, 2025 & 2035
- 5.1.9. Key Market Trends, Growth Factors, & Opportunities
- 5.1.10. UV Disinfection
- 5.1.11. Water and Wastewater Treatment Share Forecast, By Region (USD Billion)
- 5.1.12. Comparative Revenue Analysis, By Country, 2025 & 2035
- 5.1.13. Key Market Trends, Growth Factors, & Opportunities
- 5.1.14. Activated Sludge & Biological Nutrient Removal
- 5.1.15. Water and Wastewater Treatment Share Forecast, By Region (USD Billion)
- 5.1.16. Comparative Revenue Analysis, By Country, 2025 & 2035
- 5.1.17. Key Market Trends, Growth Factors, & Opportunities
- 5.1.18. Ion Exchange & Adsorption (GAC, IX Resins)
- 5.1.19. Water and Wastewater Treatment Share Forecast, By Region (USD Billion)
- 5.1.20. Comparative Revenue Analysis, By Country, 2025 & 2035
- 5.1.21. Key Market Trends, Growth Factors, & Opportunities
- 5.1.22. Advanced Oxidation Processes (Ozone, Fenton, UV-H₂O₂)
- 5.1.23. Water and Wastewater Treatment Share Forecast, By Region (USD Billion)
- 5.1.24. Comparative Revenue Analysis, By Country, 2025 & 2035
- 5.1.25. Key Market Trends, Growth Factors, & Opportunities
- 5.1.26. Other Technologies (Electrocoagulation, Constructed Wetlands)
- 5.1.27. Water and Wastewater Treatment Share Forecast, By Region (USD Billion)
- 5.1.28. Comparative Revenue Analysis, By Country, 2025 & 2035
- 5.1.29. Key Market Trends, Growth Factors, & Opportunities
- 5.1. Technology Market Overview, By Technology Segment
- Chapter 6. Water and Wastewater Treatment Market – By Application
- 6.1. Application Market Overview, By Application Segment
- 6.1.1. Water and Wastewater Treatment Market Revenue Share, By Application, 2025 & 2035
- 6.1.2. Municipal Water Treatment (Drinking Water Production)
- 6.1.3. Water and Wastewater Treatment Share Forecast, By Region (USD Billion)
- 6.1.4. Comparative Revenue Analysis, By Country, 2025 & 2035
- 6.1.5. Key Market Trends, Growth Factors, & Opportunities
- 6.1.6. Industrial Water Treatment (Process Water, Cooling Water, Boiler Feed)
- 6.1.7. Water and Wastewater Treatment Share Forecast, By Region (USD Billion)
- 6.1.8. Comparative Revenue Analysis, By Country, 2025 & 2035
- 6.1.9. Key Market Trends, Growth Factors, & Opportunities
- 6.1.10. Municipal Wastewater Treatment (Secondary and Tertiary Treatment)
- 6.1.11. Water and Wastewater Treatment Share Forecast, By Region (USD Billion)
- 6.1.12. Comparative Revenue Analysis, By Country, 2025 & 2035
- 6.1.13. Key Market Trends, Growth Factors, & Opportunities
- 6.1.14. Industrial Wastewater Treatment (Effluent Treatment, ZLD)
- 6.1.15. Water and Wastewater Treatment Share Forecast, By Region (USD Billion)
- 6.1.16. Comparative Revenue Analysis, By Country, 2025 & 2035
- 6.1.17. Key Market Trends, Growth Factors, & Opportunities
- 6.1.18. Agricultural Water Management (Irrigation Water Treatment, Drainage Treatment)
- 6.1.19. Water and Wastewater Treatment Share Forecast, By Region (USD Billion)
- 6.1.20. Comparative Revenue Analysis, By Country, 2025 & 2035
- 6.1.21. Key Market Trends, Growth Factors, & Opportunities
- 6.1.22. Other Applications (Stormwater, Desalination, Water Reuse)
- 6.1.23. Water and Wastewater Treatment Share Forecast, By Region (USD Billion)
- 6.1.24. Comparative Revenue Analysis, By Country, 2025 & 2035
- 6.1.25. Key Market Trends, Growth Factors, & Opportunities
- 6.1. Application Market Overview, By Application Segment
- Chapter 7. Water and Wastewater Treatment Market – By End-Use
- 7.1. End-Use Market Overview, By End-Use Segment
- 7.1.1. Water and Wastewater Treatment Market Revenue Share, By End-Use, 2025 & 2035
- 7.1.2. Municipalities & Public Utilities
- 7.1.3. Water and Wastewater Treatment Share Forecast, By Region (USD Billion)
- 7.1.4. Comparative Revenue Analysis, By Country, 2025 & 2035
- 7.1.5. Key Market Trends, Growth Factors, & Opportunities
- 7.1.6. Power Generation (Thermal, Nuclear, Renewable)
- 7.1.7. Water and Wastewater Treatment Share Forecast, By Region (USD Billion)
- 7.1.8. Comparative Revenue Analysis, By Country, 2025 & 2035
- 7.1.9. Key Market Trends, Growth Factors, & Opportunities
- 7.1.10. Oil & Gas (Produced Water, Process Water)
- 7.1.11. Water and Wastewater Treatment Share Forecast, By Region (USD Billion)
- 7.1.12. Comparative Revenue Analysis, By Country, 2025 & 2035
- 7.1.13. Key Market Trends, Growth Factors, & Opportunities
- 7.1.14. Food & Beverage
- 7.1.15. Water and Wastewater Treatment Share Forecast, By Region (USD Billion)
- 7.1.16. Comparative Revenue Analysis, By Country, 2025 & 2035
- 7.1.17. Key Market Trends, Growth Factors, & Opportunities
- 7.1.18. Pharmaceuticals & Healthcare
- 7.1.19. Water and Wastewater Treatment Share Forecast, By Region (USD Billion)
- 7.1.20. Comparative Revenue Analysis, By Country, 2025 & 2035
- 7.1.21. Key Market Trends, Growth Factors, & Opportunities
- 7.1.22. Mining & Metals
- 7.1.23. Water and Wastewater Treatment Share Forecast, By Region (USD Billion)
- 7.1.24. Comparative Revenue Analysis, By Country, 2025 & 2035
- 7.1.25. Key Market Trends, Growth Factors, & Opportunities
- 7.1.26. Other End-Uses (Textiles, Pulp & Paper, Semiconductors)
- 7.1.27. Water and Wastewater Treatment Share Forecast, By Region (USD Billion)
- 7.1.28. Comparative Revenue Analysis, By Country, 2025 & 2035
- 7.1.29. Key Market Trends, Growth Factors, & Opportunities
- 7.1. End-Use Market Overview, By End-Use Segment
- Chapter 8. Water and Wastewater Treatment Market – Regional Analysis
- 8.1. Water and Wastewater Treatment Market Overview, By Region Segment
- 8.1.1. Global Water and Wastewater Treatment Market Revenue Share, By Region, 2025 & 2035
- 8.1.2. Global Water and Wastewater Treatment Market Revenue, By Region, 2026 – 2035 (USD Billion)
- 8.1.3. Global Water and Wastewater Treatment Market Revenue, By Treatment Type, 2026 – 2035
- 8.1.4. Global Water and Wastewater Treatment Market Revenue, By Technology, 2026 – 2035
- 8.1.5. Global Water and Wastewater Treatment Market Revenue, By Application, 2026 – 2035
- 8.1.6. Global Water and Wastewater Treatment Market Revenue, By End-Use, 2026 – 2035
- 8.2. North America
- 8.2.1. North America Water and Wastewater Treatment Market Revenue, By Country, 2026 – 2035 (USD Billion)
- 8.2.2. North America Water and Wastewater Treatment Market Revenue, By Treatment Type, 2026 – 2035
- 8.2.3. North America Water and Wastewater Treatment Market Revenue, By Technology, 2026 – 2035
- 8.2.4. North America Water and Wastewater Treatment Market Revenue, By Application, 2026 – 2035
- 8.2.5. North America Water and Wastewater Treatment Market Revenue, By End-Use, 2026 – 2035
- 8.2.6. U.S. Water and Wastewater Treatment Market Revenue, 2026 – 2035 (USD Billion)
- 8.2.7. Canada Water and Wastewater Treatment Market Revenue, 2026 – 2035 (USD Billion)
- 8.2.8. Mexico Water and Wastewater Treatment Market Revenue, 2026 – 2035 (USD Billion)
- 8.2.9. Rest of North America Water and Wastewater Treatment Market Revenue, 2026 – 2035 (USD Billion)
- 8.3. Europe
- 8.3.1. Europe Water and Wastewater Treatment Market Revenue, By Country, 2026 – 2035 (USD Billion)
- 8.3.2. Europe Water and Wastewater Treatment Market Revenue, By Treatment Type, 2026 – 2035
- 8.3.3. Europe Water and Wastewater Treatment Market Revenue, By Technology, 2026 – 2035
- 8.3.4. Europe Water and Wastewater Treatment Market Revenue, By Application, 2026 – 2035
- 8.3.5. Europe Water and Wastewater Treatment Market Revenue, By End-Use, 2026 – 2035
- 8.3.6. Germany Water and Wastewater Treatment Market Revenue, 2026 – 2035 (USD Billion)
- 8.3.7. France Water and Wastewater Treatment Market Revenue, 2026 – 2035 (USD Billion)
- 8.3.8. U.K. Water and Wastewater Treatment Market Revenue, 2026 – 2035 (USD Billion)
- 8.3.9. Russia Water and Wastewater Treatment Market Revenue, 2026 – 2035 (USD Billion)
- 8.3.10. Italy Water and Wastewater Treatment Market Revenue, 2026 – 2035 (USD Billion)
- 8.3.11. Spain Water and Wastewater Treatment Market Revenue, 2026 – 2035 (USD Billion)
- 8.3.12. Netherlands Water and Wastewater Treatment Market Revenue, 2026 – 2035 (USD Billion)
- 8.3.13. Rest of Europe Water and Wastewater Treatment Market Revenue, 2026 – 2035 (USD Billion)
- 8.4. Asia Pacific
- 8.4.1. Asia Pacific Water and Wastewater Treatment Market Revenue, By Country, 2026 – 2035 (USD Billion)
- 8.4.2. Asia Pacific Water and Wastewater Treatment Market Revenue, By Treatment Type, 2026 – 2035
- 8.4.3. Asia Pacific Water and Wastewater Treatment Market Revenue, By Technology, 2026 – 2035
- 8.4.4. Asia Pacific Water and Wastewater Treatment Market Revenue, By Application, 2026 – 2035
- 8.4.5. Asia Pacific Water and Wastewater Treatment Market Revenue, By End-Use, 2026 – 2035
- 8.4.6. China Water and Wastewater Treatment Market Revenue, 2026 – 2035 (USD Billion)
- 8.4.7. Japan Water and Wastewater Treatment Market Revenue, 2026 – 2035 (USD Billion)
- 8.4.8. India Water and Wastewater Treatment Market Revenue, 2026 – 2035 (USD Billion)
- 8.4.9. New Zealand Water and Wastewater Treatment Market Revenue, 2026 – 2035 (USD Billion)
- 8.4.10. Australia Water and Wastewater Treatment Market Revenue, 2026 – 2035 (USD Billion)
- 8.4.11. South Korea Water and Wastewater Treatment Market Revenue, 2026 – 2035 (USD Billion)
- 8.4.12. Taiwan Water and Wastewater Treatment Market Revenue, 2026 – 2035 (USD Billion)
- 8.4.13. Rest of Asia Pacific Water and Wastewater Treatment Market Revenue, 2026 – 2035 (USD Billion)
- 8.5. The Middle-East and Africa
- 8.5.1. The Middle-East and Africa Water and Wastewater Treatment Market Revenue, By Country, 2026 – 2035 (USD Billion)
- 8.5.2. The Middle-East and Africa Water and Wastewater Treatment Market Revenue, By Treatment Type, 2026 – 2035
- 8.5.3. The Middle-East and Africa Water and Wastewater Treatment Market Revenue, By Technology, 2026 – 2035
- 8.5.4. The Middle-East and Africa Water and Wastewater Treatment Market Revenue, By Application, 2026 – 2035
- 8.5.5. The Middle-East and Africa Water and Wastewater Treatment Market Revenue, By End-Use, 2026 – 2035
- 8.5.6. Saudi Arabia Water and Wastewater Treatment Market Revenue, 2026 – 2035 (USD Billion)
- 8.5.7. UAE Water and Wastewater Treatment Market Revenue, 2026 – 2035 (USD Billion)
- 8.5.8. Egypt Water and Wastewater Treatment Market Revenue, 2026 – 2035 (USD Billion)
- 8.5.9. Kuwait Water and Wastewater Treatment Market Revenue, 2026 – 2035 (USD Billion)
- 8.5.10. South Africa Water and Wastewater Treatment Market Revenue, 2026 – 2035 (USD Billion)
- 8.5.11. Rest of the Middle East & Africa Water and Wastewater Treatment Market Revenue, 2026 – 2035 (USD Billion)
- 8.6. Latin America
- 8.6.1. Latin America Water and Wastewater Treatment Market Revenue, By Country, 2026 – 2035 (USD Billion)
- 8.6.2. Latin America Water and Wastewater Treatment Market Revenue, By Treatment Type, 2026 – 2035
- 8.6.3. Latin America Water and Wastewater Treatment Market Revenue, By Technology, 2026 – 2035
- 8.6.4. Latin America Water and Wastewater Treatment Market Revenue, By Application, 2026 – 2035
- 8.6.5. Latin America Water and Wastewater Treatment Market Revenue, By End-Use, 2026 – 2035
- 8.6.6. Brazil Water and Wastewater Treatment Market Revenue, 2026 – 2035 (USD Billion)
- 8.6.7. Argentina Water and Wastewater Treatment Market Revenue, 2026 – 2035 (USD Billion)
- 8.6.8. Rest of Latin America Water and Wastewater Treatment Market Revenue, 2026 – 2035 (USD Billion)
- 8.1. Water and Wastewater Treatment Market Overview, By Region Segment
- Chapter 9. Competitive Landscape
- 9.1. Company Market Share Analysis – 2025
- 9.1.1. Global Water and Wastewater Treatment Market: Company Market Share, 2025
- 9.2. Global Water and Wastewater Treatment Market Company Market Share, 2024
- 9.1. Company Market Share Analysis – 2025
- Chapter 10. Company Profiles
- 10.1. Veolia Environment S.A.
- 10.1.1. Company Overview
- 10.1.2. Key Executives
- 10.1.3. Product Portfolio
- 10.1.4. Financial Overview
- 10.1.5. Operating Business Segments
- 10.1.6. Business Performance
- 10.1.7. Recent Developments
- 10.2. Suez S.A.
- 10.3. Xylem Inc.
- 10.4. Evoqua Water Technologies (Xylem)
- 10.5. AECOM
- 10.6. Jacobs Engineering Group Inc.
- 10.7. Pentair plc
- 10.8. DuPont de Nemours Inc. (Water Solutions)
- 10.9. Toray Industries Inc.
- 10.10. A.O. Smith Corporation
- 10.11. Kurita Water Industries Ltd.
- 10.12. Others.
- 10.1. Veolia Environment S.A.
- Chapter 11. Research Methodology
- 11.1. Research Methodology
- 11.2. Secondary Research
- 11.3. Primary Research
- 11.3.1. Analyst Tools and Models
- 11.4. Research Limitations
- 11.5. Assumptions
- 11.6. Insights From Primary Respondents
- 11.7. Why Custom Market Insights
- Chapter 12. Standard Report Commercials & Add-Ons
- 12.1. Customization Options
- 12.2. Subscription Module For Market Research Reports
- 12.3. Client Testimonials
List Of Figures
Figures No 1 to 42
List Of Tables
Tables No 1 to 51
FAQs
The key players in the market are Veolia Environment S.A., Suez S.A., Xylem Inc., Evoqua Water Technologies (Xylem), AECOM, Jacobs Engineering Group Inc., Pentair plc, DuPont de Nemours Inc. (Water Solutions), Toray Industries Inc., A.O. Smith Corporation, Kurita Water Industries Ltd., Others.
The most significant demand driver in the water and wastewater treatment market is government regulations, which exist in the form of drinking water quality standards that determine the level of treatment required, wastewater discharge permits that stipulate the level of treatment required, infrastructure investment requirement and incentive programs that fund the costs to construct the treatment plant, and trade regulations that govern the acquisition of equipment that control the dynamics in the international market. The regulatory bases of U. S. water and wastewater treatment investment are the U.S. Clean Water Act and Safe Drinking Water Act, administered by the EPA, whose maximum contaminant level provisions of the SDWA of more than 90 drinking water contaminants and technology-based effluent discharges and water quality-based standards in the CWA define the treatment requirements that drive most U.S. water utility capital investment. The EU Water Framework Directive – setting ecological quality goals and environmental quality targets on priority substances in the European water bodies – forms the overall framework in which the wastewater treatment discharge standards of its member states are being gradually tightened, the revision of the Urban Wastewater Treatment Directive suggesting quaternary treatment of micropollutant removal at large scale wastewater plants forming a new generation of treatment technology investment requirements, estimated at EUR 3 billion/annum across the utilities of the European Union. Amendments to the Environmental Protection Law and Water Ten Action Plan by the Chinese, which sets binding water quality objectives against the waters of the classified water bodies and gradually increasing the stringency of industrial and municipal discharge standards, is the regulatory framework behind the phenomenal investment in the Chinese water treatment infrastructure which has turned China into the largest water treatment market in the world. No longer legally binding, but the normative framework of international water quality standards set by the WHO in its Guidelines on Drinking Water Quality and the SDG 6 targets of the UN, but still reflected in much bilateral and multilateral development assistance programs, these are the normative frameworks of water quality standards that affect the development of regulatory standards in developing countries to focus on water treatment technologies. Regulations on infrastructure finance, such as the U.S. state revolving funds programs to provide low-cost capital to finance water and wastewater infrastructure, the Cohesion Fund of the EU to finance water infrastructure in less-developed EU member states and the lending programs of the World Bank and regional development banks on water infrastructure financing in developing countries are as commercially significant as environmental regulations in driving the rate and extent of water treatment infrastructure investment, with the availability of financing often being the constraining factor on the rate of water treatment infrastructure investment in developing commercial markets where the regulatory requirements mandate treatment and the financial constraint on limit capital deployment without concessional financing support.
The widest price range of any market in this report series is water and wastewater treatment infrastructure, which is an example of the incredible range of treatment technologies, scale, and application. Small scale water treatment systems such as those serving the 500-5000 population with traditional coagulation-filtration-disinfection are USD 500,000- USD 5,000,000 to install including civil works, which offer simple entry level treatment facilities to small communities in developing countries. Advanced membrane filtration, UV disinfection and chemical treatment using municipal drinking water treatment facilities of medium size cities of 100,000 500,000 people are a capital investment of USD 50 -USD 500 million, depending on design capacity, technology used in the treatment, and local construction costs. Capital investments of USD 500 million to USD 5 billion for new greenfield construction at the largest scale represent the large metropolitan water treatment plants which serve a population of more than 1 million, and employ multi-stage advanced treatment such as membrane filtration, ozone, biological activated carbon, and UV disinfection. The highest capital intensity treatment technology at large scale is seawater reverse osmosis desalination plants, priced USD 1 -USD 3 billion per 100,000-200,000 cubic meters per day capacity plant (with the Veolia Jubail award representing a 600,000 cubic meters per day treatment plant at the high end of the single plant scale and capital value). Industrial zero liquid discharge systems: manufactured either to treat semiconductor or textile or produced water — cost USD 5 USD 50 million to install, and operation costs are dominated by the energy usage to run the thermal evaporation and crystallization, which dictates that ZLD lifecycle economics will be highly energy sensitive. The pricing in the water treatment market can be described as the difference between capital investment that leads to equipment, engineering and construction revenues and operating expense that yields the recurring revenue base that supports the water treatment company revenues between capital project cycles and that whose significance is increasing proportionally with respect to capital sales as the base of installed treatment infrastructure expands.
Based on the analysis given, by 2035, the market is projected to trend to approximately USD 584.63 billion as the global water infrastructure investment gap is expected to steadily narrow as the development finance institution lending, government budget allocation and increase in investment in water infrastructure by the private sector all trend towards the USD 114 billion per year investment goal achieved by SDG 6, PFAS and adherence to new contaminant regulation becomes the global order of the day, with the digital water technology deployment, increasing the treatability of the region by hundreds of millions of people to municipal water and wastewater services requiring treatment infrastructure construction at rates sustaining the region’s dominant market position, desalination capacity expansion in the Middle East, North Africa, India, and coastal developing nations adding high-capital-value treatment plant investment to serve water security objectives, industrial ZLD and water reuse adoption scaling across water-intensive industries in water-stressed manufacturing regions globally, and digital water technology deployment transforming treatment plant operating efficiency while creating recurring technology subscription revenue streams that supplement equipment sales revenue, at a CAGR of 5.8% from 2026 to 2035.
On the one hand, Asia Pacific has the fastest CAGR at 7.2% over the forecast period that has been fuelled by the water treatment market in China estimated to rise to about USD 58.4 billion in 2025 with a 7.1% CAGR, the Jal Jeevan Mission in India aimed at universal household tap water connection that is the largest single drinking water infrastructure initiative in the world, the rapid urbanization underway in the Southeast Asian nations to create municipal water and wastewater infrastructure investment demand and the high-tech industrial water treatment sector in South Korea and Chinese, Indian, and Southeast Asian cities as urban populations grow at rates requiring continuous treatment infrastructure addition beyond the replacement investment that characterizes the mature North American and European markets.
Asia Pacific is projected to stay with the greatest revenue portion throughout the forecast duration, with an apprising 36% of world market share in 2025, based on the combination of the most water-stressed high populace creating no discretionary water treatment infrastructure investment demand, dominating role of China as the largest solitary water treatment market with investment in treatment infrastructure growing at pace such that no other territorial market could match, accelerating urban water and sanitation infrastructure investment in India under government mission programs, the powerful industrial manufacturing foundation in the region that produces the largest absolute industrial water treatment demand globally that is progressively transitioning from once-through to recycle-based water management under intensifying water scarcity and regulatory pressure.
The Global Water and Wastewater Treatment Market is expected to grow significantly since the United Nations Environment Programme estimates that global water demand will exceed available freshwater supply by about 40% by 2030 establishes the basic supply-demand imbalance driving the treatment infrastructure investment, the World Bank estimates annual water and sanitation infrastructure investment requirements of about USD 114 billion against current investment of about USD 28 billion defining the USD 86 billion annual growth opportunity of the market structure, and China through its 14th and 15th Five-Year Plan water infrastructure investment programs driving the world’s largest single-country water treatment market growth.