Highway, Street and Bridge Construction Market Size, Trends and Insights By Construction Type (New Construction (Greenfield Highway, New Bridge, New Urban Street Network), Reconstruction & Rehabilitation (Bridge Deck Replacement, Highway Widening, Major Structural Rehabilitation), Maintenance & Repair (Pavement Resurfacing, Bridge Maintenance, Routine Road Maintenance)), By Infrastructure Type (Highways & Expressways (National Highways, Interstate Corridors, Expressways), Urban Streets & Roads (Arterial Roads, Collector Streets, Local Street Networks), Bridges & Overpasses (Highway Bridges, Urban Viaducts, Pedestrian Bridges), Tunnels (Mountain Road Tunnels, Urban Underpasses, Immersed Tube Tunnels), Other Infrastructure Types (Interchange Structures, Rest Areas, Highway Drainage)), By End-User (Government & Public Sector (Federal/National Agencies, State/Provincial Governments, Municipal Authorities), Private Sector (PPP Concessionaires, Toll Road Operators, Industrial Private Road Networks), Other End-Users (Military, Utility Companies, Real Estate Developers)), and By Region - Global Industry Overview, Statistical Data, Competitive Analysis, Share, Outlook, and Forecast 2026 – 2035
Report Snapshot
CAGR: 4.8%
| Study Period: | 2026-2035 |
| Fastest Growing Market: | Asia Pacific |
| Largest Market: | Asia Pacific |
Major Players
- Vinci SA
- Bouygues Construction
- Bechtel Group Inc.
- Fluor Corporation
- Others
Reports Description
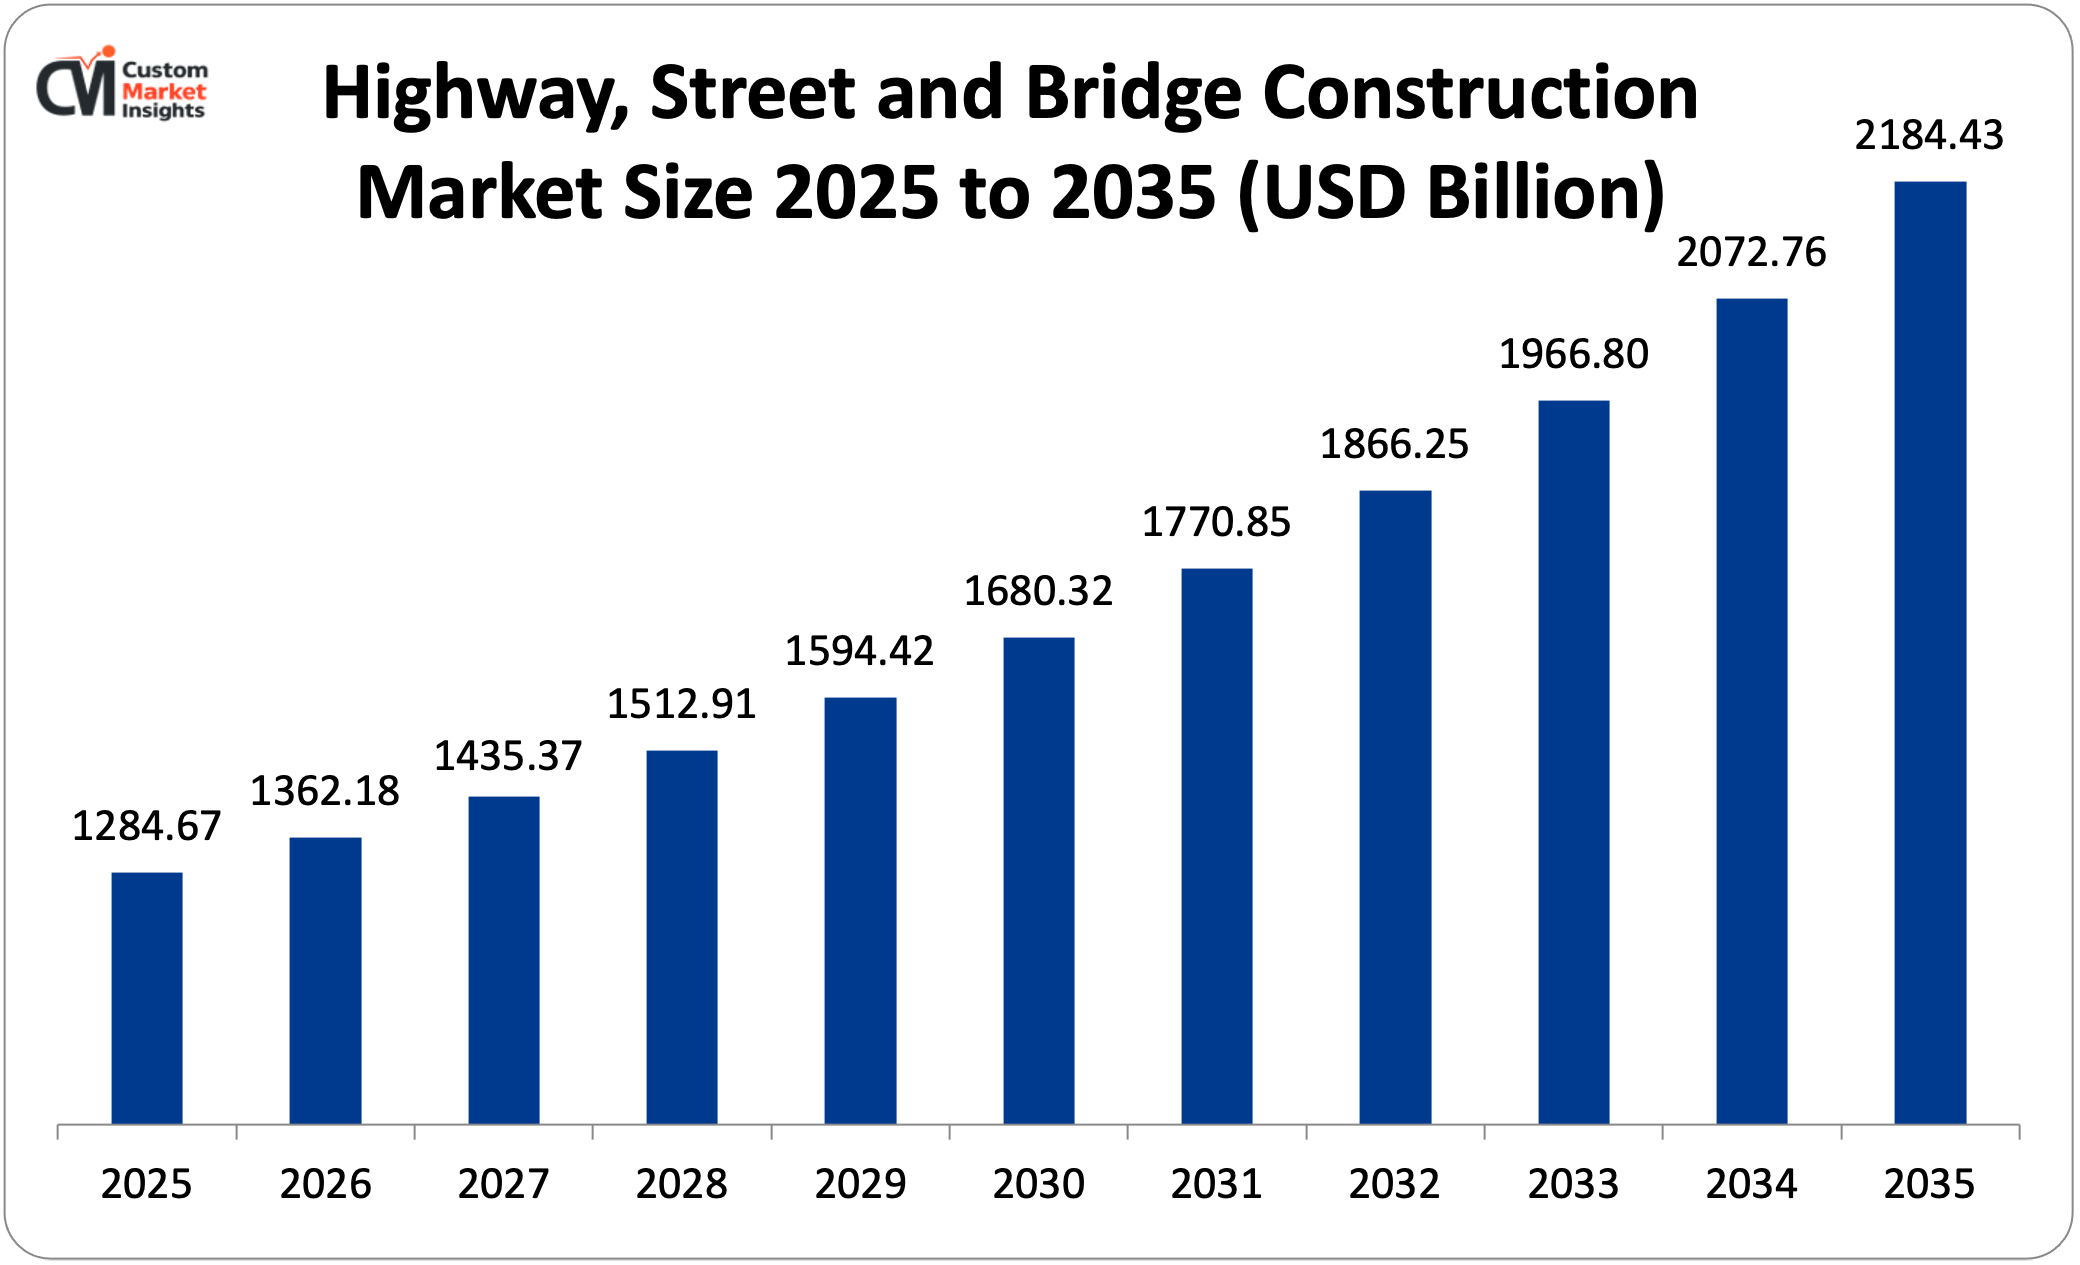
In 2026, the global market for building highways, streets, and bridges will be worth USD 1,362.18 billion. By 2035, it will be worth about USD 2,184.43 billion, growing at a rate of 4.8% per year from 2026 to 2035.
The accelerating global infrastructure investment driven by government stimulus programs, multilateral development bank lending, and private sector participation in public-private partnerships addressing decades of accumulated infrastructure maintenance deficits and capacity expansion requirements, the progressive urbanization of the developing world demanding commensurate expansion of road and bridge connectivity linking rapidly growing cities to economic hinterlands and regional trade corridors, the urgent rehabilitation imperative for aging road and bridge infrastructure in developed economies where structural deterioration creates safety risks and economic productivity losses quantified in billions of dollars annually, the growing adoption of advanced construction materials and digital construction technologies including building information modeling, autonomous equipment, and sensor-embedded smart road infrastructure that are improving construction productivity and asset performance longevity, and the expanding green infrastructure investment agenda requiring sustainable road construction materials, permeable pavement systems, and climate-resilient bridge designs that meet net-zero commitments collectively drive robust and sustained market growth throughout the forecast period.
Market Highlight
- In 2025, Asia Pacific had the biggest share of the market for building highways, streets, and bridges, with 42%.
- Asia Pacific is also expected to grow the fastest, at a rate of 6.2% per year, from 2026 to 2035.
- In 2025, the new construction segment held about 46% of the market share by type of construction.
- The reconstruction and rehabilitation segment is growing the fastest, with a CAGR of 5.6% from 2026 to 2035.
- The highways & expressways segment had the biggest market share in 2025, at 38%. The bridges & overpasses segment is expected to grow the fastest, at a rate of 5.8% per year, from 2026 to 2035.
- The government and public sector segment had the biggest market share in 2025, with 84%. The private sector segment is expected to grow the fastest, at a rate of 6.4% per year from 2026 to 2035.
Significant Growth Factors
- Government Infrastructure Stimulus Programs and Multilateral Development Bank Financing Driving Investment: The extraordinary wave of government infrastructure investment programs enacted across major economies encompassing the U.S. The Bipartisan Infrastructure Law sets aside USD110 billion over five years for roads, bridges, and major road projects. This is the largest federal investment in roads and bridges in U.S. history. The EU’s Connecting Europe Facility is investing €33.7 billion in transport network infrastructure through 2027, and the Cohesion Fund is helping to improve road infrastructure in less-developed member states. China is also continuing to invest in its national expressway network expansion, with the goal of completing 180,000 km by 2035. India’s National Infrastructure Pipeline is allocating about USD1.4 trillion across infrastructure sectors, with roads being the largest single category. This is creating the largest and most sustained wave of road and bridge construction investment since the post-World War II highway construction era that built the foundational road networks of today’s developed economies. The infrastructure investment multiplier logic—economic research shows that every dollar spent on infrastructure creates USD1.50 to USD2.00 in GDP growth through construction jobs, higher productivity from lower transportation costs, and better supply chain efficiency—provides the political economy justification for governments in both developed and developing countries to keep investing in road infrastructure, even when they have other fiscal priorities. The economic return on infrastructure investment makes it a good idea even when budgets are tight. Multilateral development bank lending, such as that from the World Bank, Asian Development Bank, African Development Bank, and Inter-American Development Bank, provides critical financing for developing nation road infrastructure investment that domestic fiscal resources cannot support. These banks lend about USD 80–USD 100 billion each year for infrastructure projects, with road and bridge construction being the largest single lending category. This allows road networks to grow across Sub-Saharan Africa, South Asia, and Southeast Asia at a pace that matches the real need for infrastructure development, rather than the pace that is limited by the ability of domestic governments to borrow money. The Belt and Road Initiative is the most important infrastructure financing program in the developing world. It has built and paid for road and bridge infrastructure in about 140 participating countries, with major road corridor projects in Pakistan (CPEC), East Africa, Central Asia, and Southeast Asia. It has made roads connect in areas where geographic isolation has historically limited economic growth and has encouraged recipient countries to invest in building complementary road networks.
- Urbanization Acceleration and Emerging Market Road Network Expansion: The extraordinary pace of urbanization across the developing world — with the United Nations estimating that the global urban population will increase by approximately 2.5 billion people between 2020 and 2050, with 90% of this growth concentrated in Africa and Asia where existing urban road infrastructure is already critically inadequate — is creating non-negotiable investment requirements for urban street network expansion, bridge construction spanning the rivers and ravines that constrain urban spatial development, and arterial highway construction connecting new urban settlements to existing economic centers that will persist for decades as the world’s most structurally durable road construction market growth driver. India’s urban road construction imperative — with the Smart Cities Mission funding urban street network improvements in 100 selected cities, the AMRUT program supporting urban mobility infrastructure in 500 cities, and the National Highways Authority of India expanding the national highway network at over 10,000 km annually — collectively represents one of the world’s largest single-country road construction programs, with India targeting a national highway network of 200,000 km by 2030 from approximately 145,000 km in 2024 requiring the construction of 55,000 km of new highway over six years. Africa’s road connectivity deficit—only 34% of Africa’s rural population lives within 2 km of an all-season road, and the continent’s road density of 204 km per 1,000 km² is much lower than the global average of over 900 km per 1,000 km²—means that the African Union’s Programme for Infrastructure Development in Africa is working to get several trillion dollars in funding from both African and international sources to fix this problem over the next few decades. Southeast Asia’s road infrastructure investment is making it one of the most active road construction markets in the world. This is because of the ASEAN connectivity agenda, which aims to make road travel across the region as smooth as possible, national development plans in Indonesia, Vietnam, the Philippines, and Thailand that set aside a lot of money for expanding national highways, and the competitive pressures of economic development that make infrastructure quality a key factor in attracting foreign investment.
What are the Major Advances Changing the Highway, Street and Bridge Construction Market Today?
- Building Information Modeling and Digital Construction Technology Adoption: The progressive adoption of building information modeling and digital construction technologies across highway, street and bridge construction — encompassing 3D design and engineering models that coordinate civil, structural, geotechnical, and utility design disciplines in a single integrated digital environment, drone-based surveying and site monitoring providing continuous construction progress documentation, machine control systems enabling GPS-guided grading equipment to achieve design tolerances without conventional staking, and sensor networks embedded in bridge structures providing real-time structural health monitoring — is improving construction productivity, reducing design error-driven rework, enabling construction quality assurance, and extending infrastructure asset service lives through data-driven maintenance interventions that are collectively transforming the economics and performance of highway and bridge construction. The UK has required BIM for major government infrastructure projects since 2016 as part of the Government Construction Strategy Level 2 BIM requirement. Similar requirements have been put in place in Scandinavia, Singapore, and major contracting jurisdictions. BIM is showing measurable construction cost savings of 10–15% by finding clashes that would require expensive field rework, speeding up the schedule by coordinating design disciplines at the same time, and reducing construction waste by improving material take-off accuracy. Machine control GPS grading uses 3D design models sent to cab displays and hydraulic control interfaces to give autonomous or operator-assisted excavators and motor graders real-time grade control guidance. This lets them work with earthwork tolerances of ±25 mm without using traditional survey stakes, which lowers survey costs, cuts down on staking delays, and allows for night-shift earthwork operations that extend productive construction hours on time-sensitive highway projects. Structural health monitoring systems—using fiber optic strain gauges, accelerometers, corrosion sensors, and environmental monitoring equipment built into bridge deck concrete and structural steel during construction—give real-time data on how well a structure is working. This lets maintenance decisions be made based on data rather than periodic manual inspections, which lets structural problems be found before safety-critical conditions develop.
- Advanced Construction Materials Improving Bridge and Pavement Performance: With the utilization of advanced construction material in terms of commercially available UHPC material used for the deck and girder of a bridge, FRP composite material used for the deck as well as rehabilitation, warm mix asphalt additives used to reduce temperatures of paving and enhance compaction, recycled asphalt pavement with the maximum utilization of RAP content in pavement resurfacing, and geosynthetic reinforcement systems used for constructing pavements in weak subgrade layers, the life span of pavements and bridges has increased and maintenance cost has been reduced. Ultra-high-performance concrete (UHPC) has compressive strengths of 150–200 MPa and tensile strengths that are strong enough to replace conventional reinforcing steel in thin bridge deck panels. This means that bridges can be replaced with much lower dead loads, smaller girder sections, and longer service lives of more than 75 years without the deck rehabilitation cycles that conventional concrete bridge decks need every 25–30 years. Even though UHPC costs more at first, it is the most cost-effective structural innovation in bridge construction. Fiber-reinforced polymer bridge deck panels are making it possible to fix structurally sound but corroded steel bridges that would otherwise need to be completely replaced. This is because they provide corrosion-resistant structural decking for bridge rehabilitation projects where replacing the concrete deck would add more weight than the original bridge could handle. Installing FRP decks costs only a fraction of what it would cost to replace the concrete deck, and they don’t need the ongoing corrosion maintenance that steel-reinforced concrete decks do in de-icing salt environments. Recycled asphalt pavement schemes are reducing the consumption of raw aggregates and bitumen used in maintaining highways. Consequently, this will make paving projects environmentally friendly and reduce their life cycle costs by reducing the cost of raw material usage, especially when the price of bitumen is extremely high.
- Advanced Highway Infrastructure and Connectivity Technology Adoption: The systematic deployment of smart highway infrastructure with features such as embedded induction charging technology for electric cars, vehicle-to-infrastructure communication technology providing autonomy and advisory control of car speeds, intelligent traffic management sensor networks optimizing traffic flow along highway sections, weather tracking and preemptive automated ice removal technology using predictive pavement temperature sensors, and LED highway lighting with adaptive illumination depending on traffic sensor presence is revolutionizing the nature of highway infrastructure from static physical infrastructures to interactive connectivity infrastructure capable of offering transportation, efficiency, safety, and electric mobility support services increasingly demanded in advanced economy highway infrastructure procurement specifications. The need for electric vehicle charging integration is pushing pilot programs for inductive wireless charging lanes built into highway pavement that charge EVs while they are driving. Electreon Wireless, Qualcomm Halo, and other similar technology developers have already installed these systems in Sweden, Israel, and the United States. These installations are helping highway authorities write specifications for smart road electrification capability. Intelligent transportation systems, which include highway speed sensors, incident detection cameras, variable message signs, and ramp metering systems that are all controlled by AI-powered traffic management center algorithms, are becoming standard parts of major highway construction and reconstruction projects in developed economy markets. This is adding more technology to each kilometer of highway construction, which increases the market value beyond the physical works content that has historically defined market sizing.
Category Wise Insights
By Construction Type
Why Does New Construction Lead the Market?
New construction is the biggest type of construction, making up about 46% of the total market share in 2025. This is because developing economies are building new highways and urban street networks, mostly in China, India, Southeast Asia, Sub-Saharan Africa, and the Middle East. These areas have a lot of rapid economic growth, urbanization, and infrastructure problems that create a constant need for large-scale new road and bridge construction. This demand is much bigger than the demand for rehabilitation and maintenance in developed economies. China’s national expressway network is growing by thousands of kilometers every year to connect provincial capitals, new industrial zones, and agricultural areas in the interior to coastal manufacturing and export corridors. This is the largest single-country new highway construction program in the world and has contributed the largest share of the global new highway construction market value for more than 20 years. India’s national highway construction acceleration—aiming for 25,000 km of new national highways each year under the Ministry of Road Transport and Highways’ ambitious network expansion program—is creating the second-largest national new highway construction market, which is growing quickly as project pipeline development matures and construction execution capacity scales to meet government goals.
Reconstruction and rehabilitation are growing the fastest, at a rate of 5.6% per year from 2026 to 2035. This is because developed economies are focusing on fixing up their old infrastructure, especially in the U.S. The Bipartisan Infrastructure Law’s USD 16.5 billion Bridge Investment Program and EUR 43.9 billion Trans-European Transport Network investment are both aimed at improving the condition of infrastructure. At the same time, maintenance and rehabilitation investments are starting to build up in developing economies where first-generation highway investments from the 1990s to 2010s are getting close to their first major rehabilitation cycles as their initial design pavement and bridge service lives come to an end.
By Infrastructure Type
Why Do Highways & Expressways Lead the Market?
As of 2025, highways and expressways make up the largest segment of infrastructure, with about 38% of the total market share. This is because they have the highest per-kilometer construction cost of any road infrastructure category. Four-lane divided highways typically cost USD 5–USD 20 million per kilometer, while urban expressways and major interchange structures can cost USD 100–USD 500 million per kilometer, depending on the terrain, urban context, and structure requirements. This is because there is a documented link between highway connectivity and economic growth, which leads to continued global investment in completing national highway networks, expanding capacity on congested corridors, and building expressways that connect major economic centers. The bridges and overpasses segment is growing the fastest, with a CAGR of 5.8% from 2026 to 2035. This is because the developed economy is repairing bridges that are structurally deficient, with about 42,000 of them in the U.S. and similar deterioration profiles in European bridge inventories. At the same time, the developing world needs to build bridges for river crossings, grade-separated interchanges, and urban elevated structures that the expansion of the highway network requires.
By End-User
Why Does the Government & Public Sector Lead the Market?
In 2025, the government sector will remain the largest end user, making up to about 84% of the market share. This is due to the fact that roads are public goods, and their development, maintenance, and operations cost money, which is mostly funded by the government. These funds include capital budget allocations by the government, government bonds, taxes from gasoline used on the roads, and loans from multilateral development banks. This is why the public sector is so dominant in road and bridge construction procurement across almost all national markets, no matter what stage of development they are in. The private sector is growing the fastest, with a CAGR of 6.4% from 2026 to 2035. This is because the global market for public-private partnerships for toll highway and bridge concessions is growing. In India, Southeast Asia, Latin America, and Eastern Europe, private sector investment in PPP toll roads is growing quickly as governments use private capital and risk transfer to build more roads than public funds alone can afford. Additionally, the private industrial road network construction associated with mining, energy, and agricultural development in frontier regions that need road access that public networks do not provide is also growing.
Report Scope
| Feature of the Report | Details |
| Market Size in 2026 | USD 1,362.18 billion |
| Projected Market Size in 2035 | USD 2,184.43 billion |
| Market Size in 2025 | USD 1,284.67 billion |
| CAGR Growth Rate | 4.8% CAGR |
| Base Year | 2025 |
| Forecast Period | 2026-2035 |
| Key Segment | By Construction Type, Infrastructure Type, End-User and Region |
| Report Coverage | Revenue Estimation and Forecast, Company Profile, Competitive Landscape, Growth Factors and Recent Trends |
| Regional Scope | North America, Europe, Asia Pacific, Middle East & Africa, and South & Central America |
| Buying Options | Request tailored purchasing options to fulfil your requirements for research. |
Regional Analysis
How Big is the Asia Pacific Market Size?
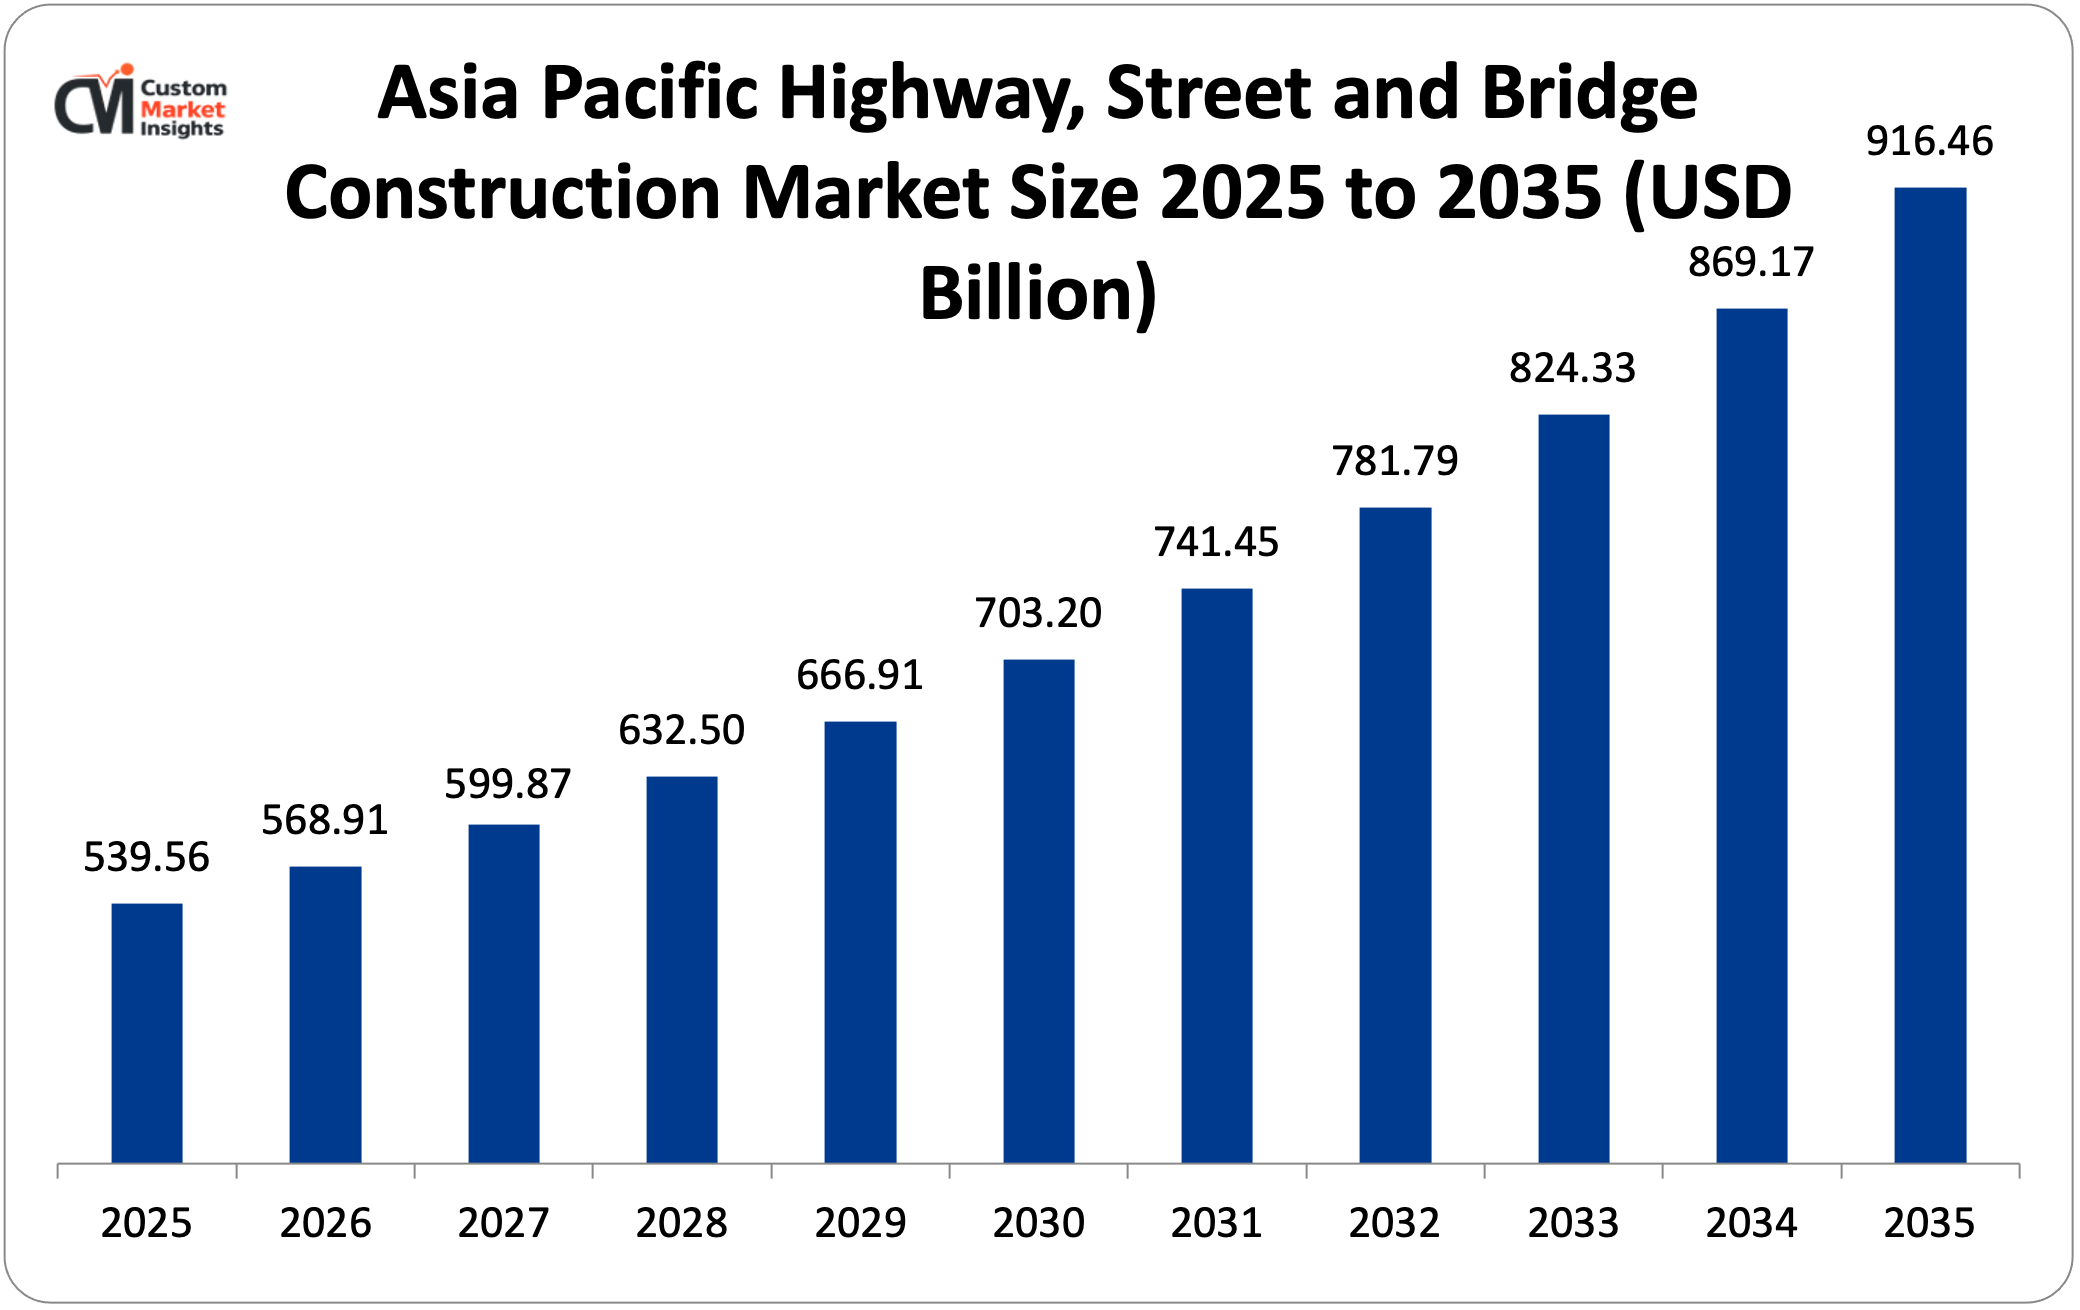
The Asia Pacific highway, street, and bridge construction market is expected to be worth USD 539.56 billion in 2025 and USD 916.46 billion by 2035, with a CAGR of 5.4% from 2026 to 2035.
Why Did Asia Pacific Dominate the Market in 2025?
In 2025, Asia Pacific will have about 42% of the world’s market share. This is because it is home to the world’s two most populous countries, China and India, which are both building the largest national road networks in history. China is finishing its national expressway network and continuing to improve provincial roads, while India is speeding up the construction of national highways toward 200,000 km. At the same time, Southeast Asia is making dynamic investments in road infrastructure across Indonesia, Vietnam, Thailand, the Philippines, and Malaysia. Finally, Asia’s rapidly growing megacities need more urban road networks because their urbanization pace creates continuous demand for new road infrastructure.
China’s highway construction program built about 5,000 km of new expressways each year in recent years, making the world’s largest national expressway network, which is more than 170,000 km long. As the network nears completion in coastal provinces, large-scale construction continues in interior and western provinces, where improving road connectivity is the main way to reduce poverty and boost economic growth. Japan’s highway construction market is smaller than China’s and India’s in terms of land area, but it is still growing. This is because of seismic retrofit programs for highway bridges and tunnels that are vulnerable to earthquakes, the Tokyo 2020 Olympic legacy infrastructure investment, and the Central Government’s ongoing investment in improving the safety and capacity of the aging Expressway network.
Why is North America an Important Market?
The North American market for building highways, streets, and bridges is expected to be worth about USD 282.63 billion in 2025 and grow at a rate of 4.9% per year to reach about USD 456.18 billion by 2035. The U.S. sets the rules for the North American market. The Bipartisan Infrastructure Law’s transformative road and bridge investment, which sets aside USD110 billion for roads and bridges over five years, the American Society of Civil Engineers’ 2021 Infrastructure Report Card, which gave the U.S. highway network a D+, and the structurally deficient bridge rehabilitation program that the BIL’s Bridge Investment Program is addressing. The Investing in Canada Plan is helping provincial highway programs by giving the federal government more money to spend on infrastructure. Mexico’s ambitious highway expansion plan, which aims to build 50,000 km of new national highways by 2030, is also getting a lot of money for construction.
Why is Europe a Strategically Important Market?
The market for building highways, streets, and bridges in Europe is expected to be worth about USD 243.68 billion in 2025 and grow at a rate of 4.9% per year to reach about USD 393.24 billion by 2035. Europe is an important market because of the Trans-European Transport Network investment program, which connects EU member states through better highway corridors; the need to fix up old motorway and national route bridges in Germany, France, and the UK; and the Eastern European highway network development programs in Poland, Romania, Hungary, and the Czech Republic that are paid for by EU Cohesion Funds. Germany’s autobahn rehabilitation is the largest single national road rehabilitation investment program in Europe. The Federal Ministry for Digital and Transport has promised to keep investing in highway maintenance and reconstruction to fix decades of deferred maintenance that has hurt the quality of the autobahn surface.
Why is the Middle East & Africa Region a High-Growth Market?
The LAMEA region has some of the fastest-growing road and bridge construction markets in the world. This is because the Gulf Cooperation Council has made huge investments in highway infrastructure. For example, Saudi Arabia’s Vision 2030 infrastructure programs, the UAE’s continued expansion of its road network, and Qatar’s post-World Cup road infrastructure legacy maintenance investment all represent the highest per-capita road construction spending in the world. Sub-Saharan Africa needs several trillion dollars’ worth of road network development to reach connectivity standards that support economic growth. Brazil’s extensive national highway network needs major rehabilitation investment because the road surfaces across the country’s vast continental road network have been shown to be deteriorating. The King Salman Road network expansion, the integration of the Riyadh Metro surface road network, and NEOM’s planned road infrastructure for the futuristic city development are all examples of large-scale Saudi road construction projects that are generating a lot of market activity within the larger GCC infrastructure investment program.
Top Players in the Market and Their Offerings
- China Communications Construction Company Ltd.
- China State Construction Engineering Corporation
- ACS Group (Actividades de Construcción y Servicios)
- Vinci SA
- Bouygues Construction
- Bechtel Group Inc.
- Fluor Corporation
- Skanska AB
- Balfour Beatty plc
- Strabag SE
- Hochtief AG
- Others
Key Developments
The market has changed a lot as construction companies improve their digital building skills, deal with the unpredictable costs of materials, and respond to the huge government infrastructure investment programs that are happening all over the world.
- In February 2025: Vinci Construction announced the award of a EUR 2.8 billion contract for the construction of the A69 autoroute extension in southern France connecting Toulouse and Castres — the largest single highway construction contract awarded in France in over a decade — encompassing 53 km of new two-lane motorway construction, including 14 viaducts, 8 tunnels, and 42 bridge structures across the hilly terrain of the Tarn department, with construction scheduled to commence in Q2 2025 and complete in 2030.
- In March 2025: India’s National Highways Authority of India (NHAI) announced that it had finished building 10,457 km of national highways during the fiscal year 2024–25. This was the second-highest annual construction achievement in NHAI history, behind the record 10,457 km built in 2020–21. The completed projects included parts of the Delhi-Mumbai Expressway, several parts of the Bharatmala Pariyojana Phase 1 economic corridor program, and urban bypass projects in 23 Tier-2 cities that reduced traffic congestion and made local roads safer.
The Highway, Street and Bridge Construction Market is segmented as follows:
By Construction Type
- New Construction (Greenfield Highway, New Bridge, New Urban Street Network)
- Reconstruction & Rehabilitation (Bridge Deck Replacement, Highway Widening, Major Structural Rehabilitation)
- Maintenance & Repair (Pavement Resurfacing, Bridge Maintenance, Routine Road Maintenance)
By Infrastructure Type
- Highways & Expressways (National Highways, Interstate Corridors, Expressways)
- Urban Streets & Roads (Arterial Roads, Collector Streets, Local Street Networks)
- Bridges & Overpasses (Highway Bridges, Urban Viaducts, Pedestrian Bridges)
- Tunnels (Mountain Road Tunnels, Urban Underpasses, Immersed Tube Tunnels)
- Other Infrastructure Types (Interchange Structures, Rest Areas, Highway Drainage)
By End-User
- Government & Public Sector (Federal/National Agencies, State/Provincial Governments, Municipal Authorities)
- Private Sector (PPP Concessionaires, Toll Road Operators, Industrial Private Road Networks)
- Other End-Users (Military, Utility Companies, Real Estate Developers)
Regional Coverage:
North America
- U.S.
- Canada
- Mexico
- Rest of North America
Europe
- Germany
- France
- U.K.
- Russia
- Italy
- Spain
- Netherlands
- Rest of Europe
Asia Pacific
- China
- Japan
- India
- New Zealand
- Australia
- South Korea
- Taiwan
- Rest of Asia Pacific
The Middle East & Africa
- Saudi Arabia
- UAE
- Egypt
- Kuwait
- South Africa
- Rest of the Middle East & Africa
Latin America
- Brazil
- Argentina
- Rest of Latin America
Table of Contents
- Chapter 1. Report Introduction
- 1.1. Report Description
- 1.1.1. Purpose of the Report
- 1.1.2. USP & Key Offerings
- 1.2. Key Benefits For Stakeholders
- 1.3. Target Audience
- 1.4. Report Scope
- 1.1. Report Description
- Chapter 2. Market Overview
- 2.1. Report Scope (Segments And Key Players)
- 2.1.1. Highway, Street and Bridge Construction by Segments
- 2.1.2. Highway, Street and Bridge Construction by Region
- 2.2. Executive Summary
- 2.2.1. Market Size & Forecast
- 2.2.2. Highway, Street and Bridge Construction Market Attractiveness Analysis, By Construction Type
- 2.2.3. Highway, Street and Bridge Construction Market Attractiveness Analysis, By Infrastructure Type
- 2.2.4. Highway, Street and Bridge Construction Market Attractiveness Analysis, By End-User
- 2.1. Report Scope (Segments And Key Players)
- Chapter 3. Market Dynamics (DRO)
- 3.1. Market Drivers
- 3.1.1. Government Infrastructure Stimulus Programs and Multilateral Development Bank Financing Driving Investment
- 3.1.2. Urbanization Acceleration and Emerging Market Road Network Expansion
- 3.2. Market Restraints
- 3.3. Market Opportunities
- 3.5. Pestle Analysis
- 3.6. Porter Forces Analysis
- 3.7. Technology Roadmap
- 3.8. Value Chain Analysis
- 3.9. Government Policy Impact Analysis
- 3.10. Pricing Analysis
- 3.1. Market Drivers
- Chapter 4. Highway, Street and Bridge Construction Market – By Construction Type
- 4.1. Construction Type Market Overview, By Construction Type Segment
- 4.1.1. Highway, Street and Bridge Construction Market Revenue Share, By Construction Type, 2025 & 2035
- 4.1.2. New Construction (Greenfield Highway, New Bridge, New Urban Street Network)
- 4.1.3. Highway, Street and Bridge Construction Share Forecast, By Region (USD Billion)
- 4.1.4. Comparative Revenue Analysis, By Country, 2025 & 2035
- 4.1.5. Key Market Trends, Growth Factors, & Opportunities
- 4.1.6. Reconstruction & Rehabilitation (Bridge Deck Replacement, Highway Widening, Major Structural Rehabilitation)
- 4.1.7. Highway, Street and Bridge Construction Share Forecast, By Region (USD Billion)
- 4.1.8. Comparative Revenue Analysis, By Country, 2025 & 2035
- 4.1.9. Key Market Trends, Growth Factors, & Opportunities
- 4.1.10. Maintenance & Repair (Pavement Resurfacing, Bridge Maintenance, Routine Road Maintenance)
- 4.1.11. Highway, Street and Bridge Construction Share Forecast, By Region (USD Billion)
- 4.1.12. Comparative Revenue Analysis, By Country, 2025 & 2035
- 4.1.13. Key Market Trends, Growth Factors, & Opportunities
- 4.1. Construction Type Market Overview, By Construction Type Segment
- Chapter 5. Highway, Street and Bridge Construction Market – By Infrastructure Type
- 5.1. Infrastructure Type Market Overview, By Infrastructure Type Segment
- 5.1.1. Highway, Street and Bridge Construction Market Revenue Share, By Infrastructure Type, 2025 & 2035
- 5.1.2. Highways & Expressways (National Highways, Interstate Corridors, Expressways)
- 5.1.3. Highway, Street and Bridge Construction Share Forecast, By Region (USD Billion)
- 5.1.4. Comparative Revenue Analysis, By Country, 2025 & 2035
- 5.1.5. Key Market Trends, Growth Factors, & Opportunities
- 5.1.6. Urban Streets & Roads (Arterial Roads, Collector Streets, Local Street Networks)
- 5.1.7. Highway, Street and Bridge Construction Share Forecast, By Region (USD Billion)
- 5.1.8. Comparative Revenue Analysis, By Country, 2025 & 2035
- 5.1.9. Key Market Trends, Growth Factors, & Opportunities
- 5.1.10. Bridges & Overpasses (Highway Bridges, Urban Viaducts, Pedestrian Bridges)
- 5.1.11. Highway, Street and Bridge Construction Share Forecast, By Region (USD Billion)
- 5.1.12. Comparative Revenue Analysis, By Country, 2025 & 2035
- 5.1.13. Key Market Trends, Growth Factors, & Opportunities
- 5.1.14. Tunnels (Mountain Road Tunnels, Urban Underpasses, Immersed Tube Tunnels)
- 5.1.15. Highway, Street and Bridge Construction Share Forecast, By Region (USD Billion)
- 5.1.16. Comparative Revenue Analysis, By Country, 2025 & 2035
- 5.1.17. Key Market Trends, Growth Factors, & Opportunities
- 5.1.18. Other Infrastructure Types (Interchange Structures, Rest Areas, Highway Drainage)
- 5.1.19. Highway, Street and Bridge Construction Share Forecast, By Region (USD Billion)
- 5.1.20. Comparative Revenue Analysis, By Country, 2025 & 2035
- 5.1.21. Key Market Trends, Growth Factors, & Opportunities
- 5.1. Infrastructure Type Market Overview, By Infrastructure Type Segment
- Chapter 6. Highway, Street and Bridge Construction Market – By End-User
- 6.1. End-User Market Overview, By End-User Segment
- 6.1.1. Highway, Street and Bridge Construction Market Revenue Share, By End-User, 2025 & 2035
- 6.1.2. Government & Public Sector (Federal/National Agencies, State/Provincial Governments, Municipal Authorities)
- 6.1.3. Highway, Street and Bridge Construction Share Forecast, By Region (USD Billion)
- 6.1.4. Comparative Revenue Analysis, By Country, 2025 & 2035
- 6.1.5. Key Market Trends, Growth Factors, & Opportunities
- 6.1.6. Private Sector (PPP Concessionaires, Toll Road Operators, Industrial Private Road Networks)
- 6.1.7. Highway, Street and Bridge Construction Share Forecast, By Region (USD Billion)
- 6.1.8. Comparative Revenue Analysis, By Country, 2025 & 2035
- 6.1.9. Key Market Trends, Growth Factors, & Opportunities
- 6.1.10. Other End-Users (Military, Utility Companies, Real Estate Developers)
- 6.1.11. Highway, Street and Bridge Construction Share Forecast, By Region (USD Billion)
- 6.1.12. Comparative Revenue Analysis, By Country, 2025 & 2035
- 6.1.13. Key Market Trends, Growth Factors, & Opportunities
- 6.1. End-User Market Overview, By End-User Segment
- Chapter 7. Highway, Street and Bridge Construction Market – Regional Analysis
- 7.1. Highway, Street and Bridge Construction Market Overview, By Region Segment
- 7.1.1. Global Highway, Street and Bridge Construction Market Revenue Share, By Region, 2025 & 2035
- 7.1.2. Global Highway, Street and Bridge Construction Market Revenue, By Region, 2026 – 2035 (USD Billion)
- 7.1.3. Global Highway, Street and Bridge Construction Market Revenue, By Construction Type, 2026 – 2035
- 7.1.4. Global Highway, Street and Bridge Construction Market Revenue, By Infrastructure Type, 2026 – 2035
- 7.1.5. Global Highway, Street and Bridge Construction Market Revenue, By End-User, 2026 – 2035
- 7.2. North America
- 7.2.1. North America Highway, Street and Bridge Construction Market Revenue, By Country, 2026 – 2035 (USD Billion)
- 7.2.2. North America Highway, Street and Bridge Construction Market Revenue, By Construction Type, 2026 – 2035
- 7.2.3. North America Highway, Street and Bridge Construction Market Revenue, By Infrastructure Type, 2026 – 2035
- 7.2.4. North America Highway, Street and Bridge Construction Market Revenue, By End-User, 2026 – 2035
- 7.2.5. U.S. Highway, Street and Bridge Construction Market Revenue, 2026 – 2035 (USD Billion)
- 7.2.6. Canada Highway, Street and Bridge Construction Market Revenue, 2026 – 2035 (USD Billion)
- 7.2.7. Mexico Highway, Street and Bridge Construction Market Revenue, 2026 – 2035 (USD Billion)
- 7.2.8. Rest of North America Highway, Street and Bridge Construction Market Revenue, 2026 – 2035 (USD Billion)
- 7.3. Europe
- 7.3.1. Europe Highway, Street and Bridge Construction Market Revenue, By Country, 2026 – 2035 (USD Billion)
- 7.3.2. Europe Highway, Street and Bridge Construction Market Revenue, By Construction Type, 2026 – 2035
- 7.3.3. Europe Highway, Street and Bridge Construction Market Revenue, By Infrastructure Type, 2026 – 2035
- 7.3.4. Europe Highway, Street and Bridge Construction Market Revenue, By End-User, 2026 – 2035
- 7.3.5. Germany Highway, Street and Bridge Construction Market Revenue, 2026 – 2035 (USD Billion)
- 7.3.6. France Highway, Street and Bridge Construction Market Revenue, 2026 – 2035 (USD Billion)
- 7.3.7. U.K. Highway, Street and Bridge Construction Market Revenue, 2026 – 2035 (USD Billion)
- 7.3.8. Russia Highway, Street and Bridge Construction Market Revenue, 2026 – 2035 (USD Billion)
- 7.3.9. Italy Highway, Street and Bridge Construction Market Revenue, 2026 – 2035 (USD Billion)
- 7.3.10. Spain Highway, Street and Bridge Construction Market Revenue, 2026 – 2035 (USD Billion)
- 7.3.11. Netherlands Highway, Street and Bridge Construction Market Revenue, 2026 – 2035 (USD Billion)
- 7.3.12. Rest of Europe Highway, Street and Bridge Construction Market Revenue, 2026 – 2035 (USD Billion)
- 7.4. Asia Pacific
- 7.4.1. Asia Pacific Highway, Street and Bridge Construction Market Revenue, By Country, 2026 – 2035 (USD Billion)
- 7.4.2. Asia Pacific Highway, Street and Bridge Construction Market Revenue, By Construction Type, 2026 – 2035
- 7.4.3. Asia Pacific Highway, Street and Bridge Construction Market Revenue, By Infrastructure Type, 2026 – 2035
- 7.4.4. Asia Pacific Highway, Street and Bridge Construction Market Revenue, By End-User, 2026 – 2035
- 7.4.5. China Highway, Street and Bridge Construction Market Revenue, 2026 – 2035 (USD Billion)
- 7.4.6. Japan Highway, Street and Bridge Construction Market Revenue, 2026 – 2035 (USD Billion)
- 7.4.7. India Highway, Street and Bridge Construction Market Revenue, 2026 – 2035 (USD Billion)
- 7.4.8. New Zealand Highway, Street and Bridge Construction Market Revenue, 2026 – 2035 (USD Billion)
- 7.4.9. Australia Highway, Street and Bridge Construction Market Revenue, 2026 – 2035 (USD Billion)
- 7.4.10. South Korea Highway, Street and Bridge Construction Market Revenue, 2026 – 2035 (USD Billion)
- 7.4.11. Taiwan Highway, Street and Bridge Construction Market Revenue, 2026 – 2035 (USD Billion)
- 7.4.12. Rest of Asia Pacific Highway, Street and Bridge Construction Market Revenue, 2026 – 2035 (USD Billion)
- 7.5. The Middle-East and Africa
- 7.5.1. The Middle-East and Africa Highway, Street and Bridge Construction Market Revenue, By Country, 2026 – 2035 (USD Billion)
- 7.5.2. The Middle-East and Africa Highway, Street and Bridge Construction Market Revenue, By Construction Type, 2026 – 2035
- 7.5.3. The Middle-East and Africa Highway, Street and Bridge Construction Market Revenue, By Infrastructure Type, 2026 – 2035
- 7.5.4. The Middle-East and Africa Highway, Street and Bridge Construction Market Revenue, By End-User, 2026 – 2035
- 7.5.5. Saudi Arabia Highway, Street and Bridge Construction Market Revenue, 2026 – 2035 (USD Billion)
- 7.5.6. UAE Highway, Street and Bridge Construction Market Revenue, 2026 – 2035 (USD Billion)
- 7.5.7. Egypt Highway, Street and Bridge Construction Market Revenue, 2026 – 2035 (USD Billion)
- 7.5.8. Kuwait Highway, Street and Bridge Construction Market Revenue, 2026 – 2035 (USD Billion)
- 7.5.9. South Africa Highway, Street and Bridge Construction Market Revenue, 2026 – 2035 (USD Billion)
- 7.5.10. Rest of the Middle East & Africa Highway, Street and Bridge Construction Market Revenue, 2026 – 2035 (USD Billion)
- 7.6. Latin America
- 7.6.1. Latin America Highway, Street and Bridge Construction Market Revenue, By Country, 2026 – 2035 (USD Billion)
- 7.6.2. Latin America Highway, Street and Bridge Construction Market Revenue, By Construction Type, 2026 – 2035
- 7.6.3. Latin America Highway, Street and Bridge Construction Market Revenue, By Infrastructure Type, 2026 – 2035
- 7.6.4. Latin America Highway, Street and Bridge Construction Market Revenue, By End-User, 2026 – 2035
- 7.6.5. Brazil Highway, Street and Bridge Construction Market Revenue, 2026 – 2035 (USD Billion)
- 7.6.6. Argentina Highway, Street and Bridge Construction Market Revenue, 2026 – 2035 (USD Billion)
- 7.6.7. Rest of Latin America Highway, Street and Bridge Construction Market Revenue, 2026 – 2035 (USD Billion)
- 7.1. Highway, Street and Bridge Construction Market Overview, By Region Segment
- Chapter 8. Competitive Landscape
- 8.1. Company Market Share Analysis – 2025
- 8.1.1. Global Highway, Street and Bridge Construction Market: Company Market Share, 2025
- 8.2. Global Highway, Street and Bridge Construction Market Company Market Share, 2024
- 8.1. Company Market Share Analysis – 2025
- Chapter 9. Company Profiles
- 9.1. China Communications Construction Company Ltd.
- 9.1.1. Company Overview
- 9.1.2. Key Executives
- 9.1.3. Product Portfolio
- 9.1.4. Financial Overview
- 9.1.5. Operating Business Segments
- 9.1.6. Business Performance
- 9.1.7. Recent Developments
- 9.2. China State Construction Engineering Corporation
- 9.3. ACS Group (Actividades de Construcción y Servicios)
- 9.4. Vinci SA
- 9.5. Bouygues Construction
- 9.6. Bechtel Group Inc.
- 9.7. Fluor Corporation
- 9.8. Skanska AB
- 9.9. Balfour Beatty plc
- 9.10. Strabag SE
- 9.11. Hochtief AG
- 9.12. Others.
- 9.1. China Communications Construction Company Ltd.
- Chapter 10. Research Methodology
- 10.1. Research Methodology
- 10.2. Secondary Research
- 10.3. Primary Research
- 10.3.1. Analyst Tools and Models
- 10.4. Research Limitations
- 10.5. Assumptions
- 10.6. Insights From Primary Respondents
- 10.7. Why Healthcare Foresights
- Chapter 11. Standard Report Commercials & Add-Ons
- 11.1. Customization Options
- 11.2. Subscription Module For Market Research Reports
- 11.3. Client Testimonials
- Chapter 12. List Of Figures
- 12.1. Figures No 1 to 27
- Chapter 13. List Of Tables
- 13.1. Tables No 1 to 46
Prominent Player
- China Communications Construction Company Ltd.
- China State Construction Engineering Corporation
- ACS Group (Actividades de Construcción y Servicios)
- Vinci SA
- Bouygues Construction
- Bechtel Group Inc.
- Fluor Corporation
- Skanska AB
- Balfour Beatty plc
- Strabag SE
- Hochtief AG
- Others
FAQs
The key players in the market are China Communications Construction Company Ltd., China State Construction Engineering Corporation, ACS Group (Actividades de Construcción y Servicios), Vinci SA, Bouygues Construction, Bechtel Group Inc., Fluor Corporation, Skanska AB, Balfour Beatty plc, Strabag SE, Hochtief AG, Others.
Government regulations are the most important single factor in the highway, street, and bridge construction market. They work through procurement laws that govern project tendering and contractor selection, environmental impact assessment requirements that condition project approval, construction technical standards that establish material and workmanship requirements, safety regulations that govern construction site operations, and infrastructure financing regulations that determine the permissible public-private partnership structures for private investment in road infrastructure. Public procurement rules, like the EU’s Public Procurement Directive, the U.S. Federal Acquisition Regulations for federally funded highway projects, and similar rules in other countries, set the rules for competitive bidding, transparency, and contractor qualifications that most highway and bridge construction contracts around the world must follow. The quality of the procurement process directly affects how competitive the market is, how much contracts cost, and how well construction is delivered. The U.S. set up rules for environmental impact assessments. The National Environmental Policy Act, the EU’s Environmental Impact Assessment Directive, and similar national EIA frameworks all require a full assessment of the environmental impacts of highway and bridge projects before they can be approved. These impacts include habitat disruption, wetland encroachment, air and water quality effects, and community displacement. EIA processes are the biggest risk to the timeline for major highway projects, as complicated environmental conditions or community opposition can add years to the permitting process. Construction technical standards, such as AASHTO highway design standards in the US, Eurocode structural design standards in Europe, and similar national design standards around the world, set the minimum performance requirements that highway and bridge infrastructure must meet. These standards are gradually adding requirements for climate resilience, seismic performance, and sustainability that affect material specifications, structural design approaches, and construction quality control requirements in ways that affect both the cost of construction and the long-term performance of the asset. As governments realize that private sector capital and operational efficiency are important additions to public investment in speeding up the development of road networks beyond what domestic fiscal resources can afford, public-private partnership regulatory frameworks are becoming more common in developing markets. These frameworks set the legal authority, risk allocation principles, and concession agreement standards for private investment in toll road and bridge infrastructure.
The cost of building highways, streets, and bridges can be very different depending on the type of project, the location, and how complicated the work is. Basic rural road construction in developing economies costs between USD 200,000 and USD 800,000 per kilometer. This is because it uses locally available aggregate and labor-intensive methods. This makes it possible for developing economy governments to invest in rural connectivity at a cost that would be too high for developed economies. Using standard earthwork, flexible pavement, and basic drainage structures, it costs between USD 500,000 and USD 2,000,000 per kilometer to build a standard two-lane highway in developing markets with moderate terrain. This is the most common unit cost range for national highway network expansion programs in South Asia, Southeast Asia, and Sub-Saharan Africa. In developing countries, building a four-lane divided highway costs between USD 3,000,000 and USD 8,000,000 per kilometer in flat to moderately hilly terrain. In mountainous terrain that needs a lot of tunneling and viaduct structures, the cost goes up to USD 10,000,000 to USD 30,000,000 per kilometer. Building urban expressways in developed countries costs between USD50 million and USD500 million per kilometer. This is because they need to buy land at urban real estate prices, move utilities, and build complex interchange structures. Iconic urban infrastructure projects like Boston’s Big Dig and Singapore’s Marina Coastal Expressway cost USD1 billion per kilometer. Depending on the type of bridge, its span, and how complicated it is, the cost of building a bridge can range from USD5,000 to USD100,000 per square meter of deck area. Simple beam bridges are the cheapest, while more complicated cable-stayed and suspension bridges are the most expensive because they have to meet higher aesthetic and span requirements. The prices of steel, cement, bitumen, and aggregate can change a lot over short periods of time, sometimes by as much as 20% to 100%. This makes project budgets risky. Price adjustment clauses and other contract risk allocation mechanisms are gradually addressing this issue, but it still has a big impact on how contractors bid and how much projects cost.
Based on current analysis, the market is expected to reach about USD 2,184.43 billion by 2035, thanks to the U.S. BIL road and bridge investment, EU Connecting Europe Facility transport network investment, and major national programs in India, Southeast Asia, and Africa that collectively represent the largest synchronized global road infrastructure investment program in history, the developing world’s continuing urbanization requiring proportional urban road network expansion that will sustain new construction market growth for decades, the aging bridge rehabilitation wave across developed economies creating a structurally mandated multi-decade rehabilitation and replacement market that will persist as long as the post-war bridge construction boom’s asset base continues aging, smart road and connected infrastructure technology content per kilometer increasing as ITS systems, vehicle communication infrastructure, and EV charging capability become standard highway construction components, and the progressive adoption of advanced construction materials and digital technologies improving productivity and asset performance in ways that reduce lifecycle cost while enabling more ambitious construction programs for equivalent investment, at a CAGR of 4.8% from 2026 to 2035.
Asia Pacific is expected to keep the biggest share of revenue during the forecast period. By 2025, the region will have about 42% of the global market share. This is because China and India are both running the world’s two biggest national road construction programs at the same time, Southeast Asia is investing more in its highway network, cities are growing faster than anywhere else in the world, and the Asian Development Bank and Asian Infrastructure Investment Bank are continuing to provide multilateral development bank financing to help lower-income Asian economies expand their road networks.
During the forecast period, Asia Pacific is expected to grow the fastest, at a rate of 6.2% per year. This is because India is speeding up the construction of national highways, with the goal of building 25,000 km of new roads each year as part of the Ministry of Road Transport and Highways’ network expansion program. China is also continuing to build highways in its interior provinces as the coastal network nears completion. In Southeast Asia, national development plans are putting a lot of money into highway network expansion in Indonesia, Vietnam, Thailand, and the Philippines. The South Asian Development Bank is lending money for infrastructure projects to improve road connectivity across Bangladesh, Nepal, and Sri Lanka. Finally, the region is experiencing an extraordinary rate of urbanization, which is creating a constant need for new urban street networks as hundreds of millions of new urban residents move in.
The Global Highway, Street, and Bridge Construction Market is expected to grow a lot because of the U.S. Bipartisan Infrastructure Law allocating USD 110 billion specifically for roads and bridges over five years representing the largest federal road investment in U.S. history, the American Society of Civil Engineers grading U.S. drinking water infrastructure at D+ and documenting approximately 42,000 structurally deficient bridges defining the rehabilitation investment requirement, India’s NHAI completing over 10,000 km of national highway annually under the Bharatmala Pariyojana program targeting 200,000 km national highway network by 2030, the African Development Bank estimating only 34% of Africa’s rural population lives within 2 km of an all-season road establishing the continent’s fundamental road connectivity deficit representing several trillion dollars of investment need, the United Nations projecting 2.5 billion additional urban residents between 2020 and 2050 with 90% concentrated in Africa and Asia requiring commensurate urban road infrastructure expansion, the Francis Scott Key Bridge collapse in Baltimore (2024) elevating political urgency for bridge structural safety investment motivating accelerated government funding commitment, the Belt and Road Initiative financing road corridor construction across approximately 140 countries creating road connectivity in regions where geographic isolation has historically constrained economic development, and China’s national expressway network expansion targeting 180,000 km by 2035 sustaining the world’s largest national highway construction program.