Employer of Record EOR Market Size, Trends and Insights By Service Type (Full-Service EOR, Multi-Country Payroll, Contractor Management, Compliance Management, Benefits Administration, Immigration Support), By Enterprise Size (Large Enterprises, Small and Medium Enterprises, Startups), By Industry Vertical (Information Technology, Healthcare, Financial Services, Manufacturing, Retail and E-commerce, Professional Services, Media and Entertainment, Education, Other Industries), By Employment Type (Full-Time Employees, Contract Workers, Temporary Staff, Part-Time Employees), and By Region - Global Industry Overview, Statistical Data, Competitive Analysis, Share, Outlook, and Forecast 2026 – 2035
Report Snapshot
| Study Period: | 2026-2035 |
| Fastest Growing Market: | Asia Pacific |
| Largest Market: | North America |
Major Players
- Globalization Partners
- Velocity Global
- Remote Technology Inc.
- Deel Inc.
- Others
Reports Description
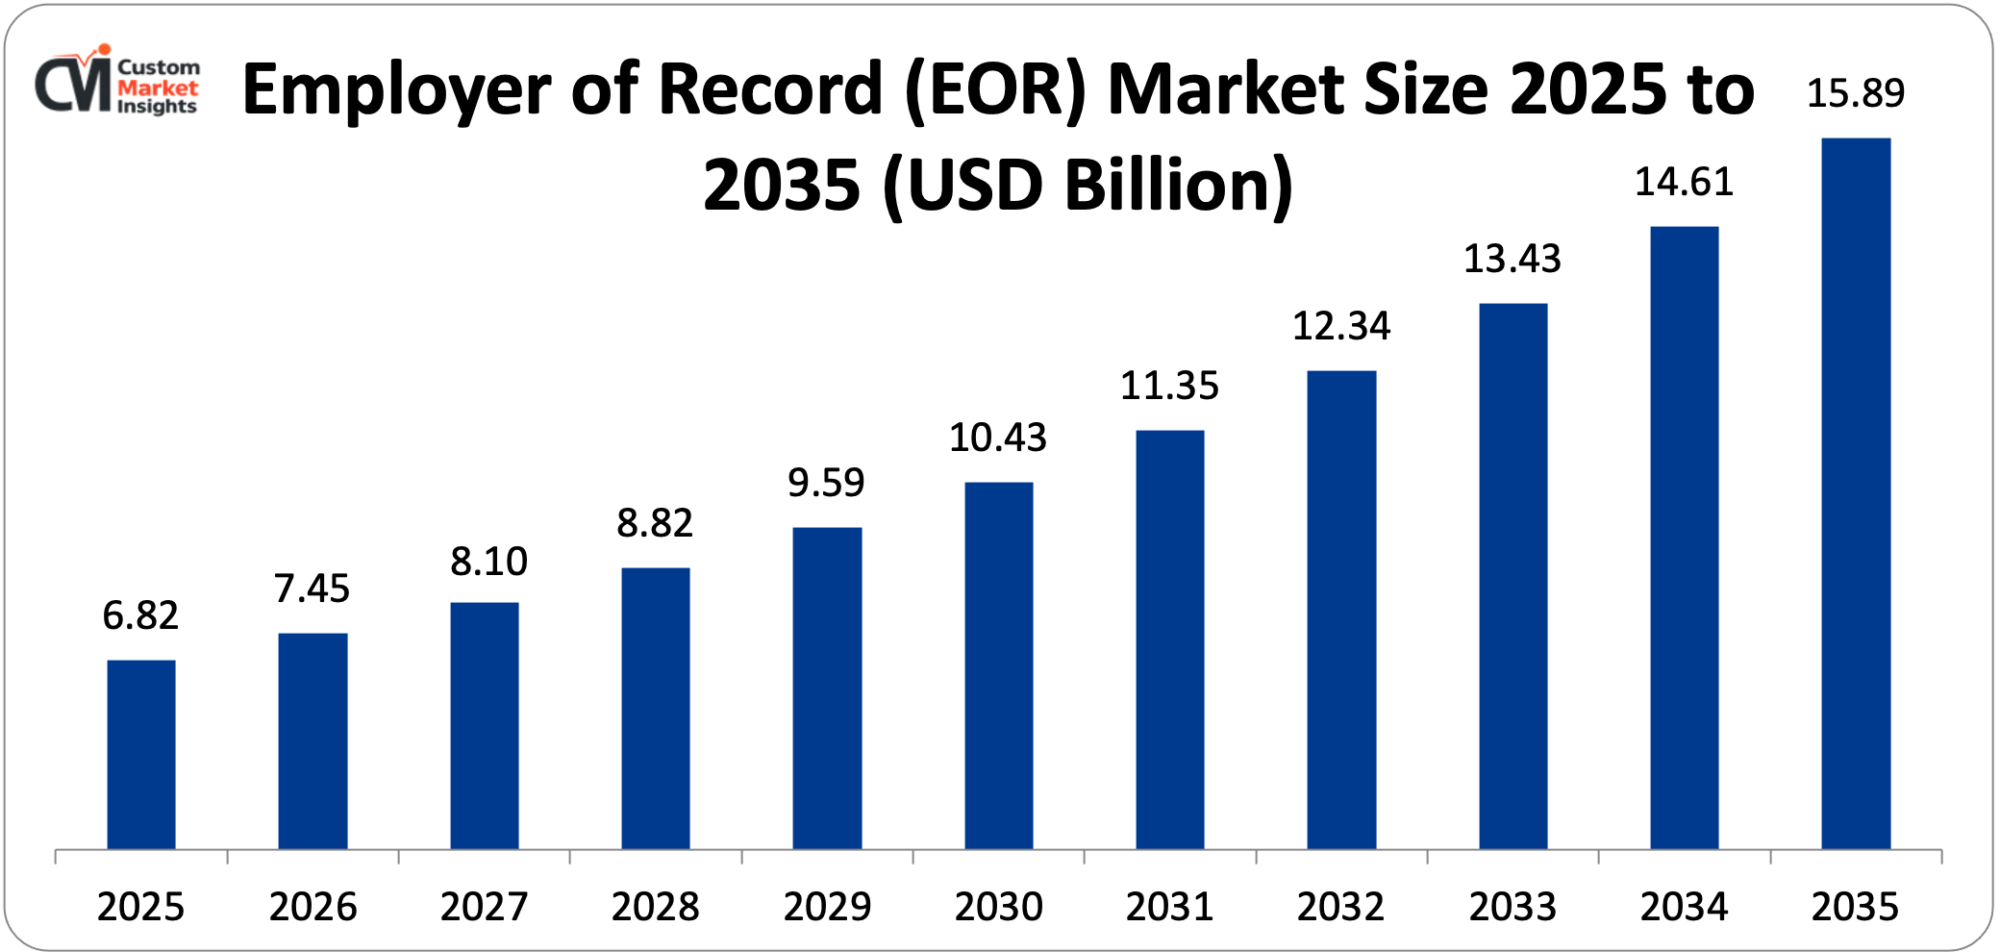
It is projected that the market size of Employer of record (EOR) in the world will reach USD 6.82 billion by 2025 and it will reach USD 7.45 billion by 2026 and around USD 15.89 billion in 2035 with an annual CAGR of 9.24%. The market is expanding due to the accelerating tendency towards remote and distributed workforces, the rising levels of complexity of international labour laws and compliance mandates, the rising need for flexible workforce solutions, the expansion of the gig economy and contract jobs, and the increasing global talent sourcing strategies of organisations seeking specialised skills in international markets.
Market Highlight
- North America had a market share of 42% of the market in 2025 and this is equivalent to the Employer of Record market leader.
- Asia Pacific will witness an increase of 11.3% between the years 2026 and 2035.
- By type of service, the full-service EOR had captured more than 48% of the market share in 2025.
- By type of service, the contractor management segment will have the highest CAGR of 10.8% in the years 2026 to 2035.
- Industry vertical-wise, the largest market share of 31% in 2025 will be held by the information technology segment; the highest CAGR for the period of the projection of 2026-35 will be held by the healthcare segment.
- Enterprise size: In 2025, the small and medium enterprises were able to claim 53% of the market share.
- In 2024, EOR and international employment services had a monopoly of 34.2% share in the overall global workforce solutions market.
Key Trends & Drivers
The Employer of Record EOR Market Trends present significant growth opportunities due to several factors:
- Remote Work Revolution and Global Talent Access: The remote and hybrid work models that the COVID-19 outbreak was the catalyst of have become the fundamental source of organizational talent acquisition and workforce management practices, making EOR services a critical infrastructure of the organizations willing to recruit talent internationally but still wanting to avoid setting up local organizations. In an article, Future of Work 2025, 58% of all employees are in hybrid employment, and 16% are working entirely remotely, which is 74% of the workforce currently enjoying flexible working conditions as opposed to only 22% prior to the pandemic. This revolution has helped businesses tap into talent pools around the world and Upwork projects 36.2 million Americans will be working remotely by 2025, or be 87% higher than the situation before the pandemic. The trend of the distributed workforce is going worldwide, where the International Labour Organization has reported that cross-border remote work has grown by 340% between 2019 and 2024 which provides unprecedented demand on the EOR services that deal with international employment compliance. The use of distributed workforce models by technology companies has been led by GitLab (a fully remote company with 2,000+ employees spread across 65 countries) operating on a permanent remote-first policy, Automattic (WordPress) with 1,800 employees (in 95 countries) working on a permanent remote-first policy, and traditional employers such as Spotify, Shopify, and Twitter adopting permanent remote-first policies that cover tens of thousands of workers. Hiring capabilities throughout the world have proven to be a competitive edge, 68% of hiring managers state that access to international talent has become central to business expansion, and 72% of job applicants state that location flexibility is a primary consideration when assessing employment opportunities. EOR services remove the old barriers to international hiring, where previously it required forming legal entities, costing USD 50,000 to USD 250,000 per country, going through local labor regulations and laws, which could only be passed with professional legal expertise, payroll, tax and benefits administration, and compliance with changing regulations in different jurisdictions. The EOR services allow companies to recruit employees in new countries in 1-2 weeks, which is a 3-6 months’ time to get an entity established and save time-to-hire by 85-90% and support quick and flexible market access and recruiting talent strategies. The companies that hire international employees through the EOR services save 40-60% of administrative costs and eradicate the compliance risks that may lead to penalties of 10-50% of annual payroll in some jurisdictions.
- Increasing Regulatory Complexity and Compliance Burdens: The proliferation of labor law sophistication in jurisdictions all over the world is placing organizations on the path of EOR solutions offering experience and liability capping in streamlining complex and ever shifting labor regulations. The Doing Business 2024 report by the World Bank records 187 new labor and employment regulations as an average country in the past decade, with compliance requirements differing dramatically across 190+ jurisdictions which include the areas of employment agreements, working time, calculation of overtime, access to leave, termination policies, and social security rates. In the EU, over 120 employment-related directives are in existence requiring member states to recast them into national law and this creates a complicated regulatory environment in which corporations are required to meet both EU-based and nation-specific standards in 27 different jurisdictions. The penalties against non-compliance have gone up to a greater level, with the UK imposing fines of GBP 20,000 per infringement of employment laws, France fining up to 45,000 EUR and possible criminal liability on serious offenses, and Germany imposing fines of up to 500,000 EUR based on the local labor authorities. The rise of employment classification concerns has posed significant compliance risks, with the gig economy platforms already paying out billions in reclassification settlements, such as the USD 100 million settlement Uber settled in California and the EUR 5 million fine that Deliveroo paid in France over worker misclassification. Regulations of data privacy that overlap with employment bring even greater complexity, and GDPR introduces obligations on how data of employees is managed, the Californian CPRA expands data privacy rights to employment relationships, and the Chinese Personal Information Protection Law (PIPL) covers cross-border transfer of employee information and its impact on multinational operations. Tax compliance is the other aspect of complexity with 159 countries having various income tax regimes, with social security contribution rates ranging between 5% and 45% of wages and complicated permanent establishment regulations that can unknowingly impose a tax liability on a foreign jurisdiction. Most recent compliance layers in the way international employment is organized by multinational companies are the OECD Base Erosion and Profit Shifting (BEPS) program and the subsequent introduction of Pillar Two global minimum tax regulations. EOR providers have specialized skills in jurisdictions, and the most successful ones have over 500 labor law experts, 150+ country tax accountants, and HR compliance specialists who observe regulatory changes around the clock and make the required changes to their employment practices, payroll calculation, and documentation needs.
What are the Major Advances Changing the Employer of Record Market Today
- Technology Platform Integration and Automation: The revolution of EOR services in the new platforms of advanced technology based on artificial intelligence, machine learning, and automated workflow is transforming service delivery by 30-40% cost of operation reduction and service delivery over one scale with the integration of multiple countries in a short period of time. The modern EOR platforms incorporate integrated human resource information systems (HRIS), which offer single interfaces to manage global workforces, automated payroll systems which compute payrolls across various currencies, tax systems and regulatory systems and requirements, compliance systems which monitor regulatory changes and update employment practices automatically, employee self-service portals which allow employees to access pay information, benefits information and employment documents without administrative intervention. The top EOR systems handle more than 100,000 payroll transactions every month in 50 or more countries with 99.8% accuracy rates by industry standards and have compliance databases with 50,000 or more regulatory requirements that are updated on a real-time basis as laws are changed. In EOR platforms, artificial intelligence applications are used to support natural language processing, which uses an algorithm to extract terms in 40+ languages of employment contract, machine learning applications which predict compliance risks based on employment patterns and regulatory trends, chatbots that answer employee queries relating to benefits, payroll, and local regulations in local languages 24/7; and intelligent document generation that creates country specific employment agreements, handbooks, and termination documents that conform to local laws. With API-first architecture, systems such as an applicant tracking system (ATS) used in hiring processes, time and attendance systems used in calculating payrolls, expense management systems used in reimbursement processes, and enterprise resource planning (ERP) systems used in consolidating finances can be easily integrated. Remote identity is one of the top EOR providers that claims that their platform is integrated with 50+ enterprise systems and onboarding is completed within 2.4 days on average as compared to 14-21 days with conventional approaches. Blockchain has been introduced as a safe method of credential verification and international payment processing, and some EORs are already testing the cryptocurrency payroll solutions to offer international employees to avoid the 3-5-day foreign exchange costs and save international payments near-instant settlement.
- Expansion of Contractor and Gig Economy Management: Gig economy and contractor workforce are expanding exponentially creating the need to execute specific EOR services to manage independent contractor relationships and reduce the risk of misclassification which has already cost billions in penalties and back payments in any sector. According to the Mastercard Economics Institute, the global gig economy is expected to reach USD 455 billion in 2024, and is predicted to reach USD 873 billion by 2028, with 36% of U.S. workers and 30% of workers worldwide engaged in gig or freelance work. Contractor management has the highest growth rate of 10.8% CAGR in 2026-2035 due to companies looking at a flexible workforce solution that increases flexibility with business needs without compromising compliance with more and more strict classification regulations. The global regulatory examination of worker classification has been heightened by the AB5 bill becoming law in California which has set forth strict qualification requirements on independent contractor status, the IR35 regulations in the UK which impose liability on companies harboring misclassified workers, and the proposed directive on platform work in the European Union which could reclassify millions of gig workers as employees. EOR providers now provide advanced contractor management services, which are classified assessment with multi-factor tests that are in line with the local laws, contract lifecycle management that has ensured that there is appropriate documentation and terms is done, payment processing that is available in 150 or more currencies with local tax treatment, and conversion pathways that convert contractors into employees where the relationship has exceeded the duration or control limits. The independent contractor rule amendment of 2024 by the U.S. Department of Labor applies to an estimated 70 million gig workers and contract professionals, which implies that the decision to classify based on the independent contractor rule should be guided by professionals who can incur a liability of 15-30% of the contractor payments in case of a misclassification. The most popular EOR platforms have integrated AI-based classification software to assess 50 or more variables such as the arrangement of the work, payment terms, the use of tools and equipment, exclusivity needs, and time to give risk assessment and compliance suggestions.
- Industry-Specific Compliance and Vertical Specialization: Market segmentation is resulting in specialization and specialization in highly regulated industries such as healthcare, financial services, and professional services is due to the development of industry-specific EOR solutions to meet unique regulatory needs, licensing, and operational aspects. Healthcare is a highly complicated vertical that is projected to grow at a 10.5% CAGR, due to the identified worldwide healthcare staffing shortage of 13 million employees revealed by the World Health Organization, strong licensing and credentialing standards depending on jurisdiction and specialized compliance with laws such as HIPAA in the United States, GDPR for health data in Europe, and other similar data protection mandates in other countries. EOR providers of healthcare have to handle the credential verification in 50 or more medical specialties, in various jurisdictions, malpractice insurance coverage arrangements, and even compliance with clinical practice regulations that differ to some extent between countries and even states or provinces within countries. There is also the complexity in financial services with the licensing of financial advisors, traders and other financial institution regulated positions, highly regulated background checks and compliance under securities regulations and specialized vetting under anti-money laundering (AML) and know-your-customer (KYC) compliance. The most competitive market share of 31% of the EOR market in 2025 is provided by the information technology sector, which demands due to the global competition of specialized technical talent, as indicated by indeed.com which states there are 1.4 million vacant technical jobs in the world market and companies that are increasingly recruiting software developers, data scientists, and cybersecurity specialists in foreign markets with higher availability of talent. Professional service firms such as consulting, accounting, legal, and engineering firms use EOR services to assign professionals to work on projects in other jurisdictions without creating entities in those jurisdictions, with 10,000-plus international contractors and employees being managed by EOR arrangements in Deloitte, PwC and other large professional services firms.
- Emerging Market Expansion and Talent Arbitrage: The strong growth of EOR services into new markets in Latin America, Southeast Asia, Eastern Europe, and Africa is led by the need of companies to gain access to inexpensive talent as they also exploit fast growing technology systems and expert competencies in less expensive jurisdictions. Latin America became one of the most important sources of nearshore talent, where 745,000 technology workers lived in the area and wage rates are 40-60% less than similar jobs in the U.S., which offered North American companies a favorable environment to develop distributed teams. Brazil, Mexico, Argentina, and Colombia have emerged to have a well-established technology base with well-established educational institutes that graduate 150,000+ engineering graduates per year, and the fact that they are in the same time zone as North America makes it possible to work in real time with them unlike with their Asian or European counterparts. Another high-growth region is that of Eastern Europe where such countries as Poland, Ukraine, Romania, and the Czech Republic now have an output of 300,000+ STEM graduates each year with a strong technical education framework and an English proficiency of more than 70% among younger-professional age ranges. Although Ukrainian geopolitics has taken its toll on the economy of the country, the technology industry keeps developing with 285,000 IT specialists in 2024, and Ukraine may soon become a significant provider of talent to western European and North American companies. The region of Southeast Asia is growing explosively with technology centres in Singapore, Vietnam, the Philippines, and Indonesia boasting of huge talent pools with the Philippines alone employing 1.5 million people in business process outsourcing and shared service positions. India has stayed the top destination with 5.4 million technology professionals and an education system that generates 1.5 million engineering graduates each year but the rate of growth in wages of 10-15% per annum is forcing companies to look at other markets. Africa is also becoming a frontier market with technology ecosystems building in Nigeria, Kenya, South Africa, and Egypt, as part of efforts such as the 3 million Technical Talent (3MTT) program in Nigeria which seeks to educate 3 million technology specialists by 2027.
Category Wise Insights
By Service Type
Why Full-Service EOR Lead the Market?
Full-service EOR dominating in 2025 will comprise the largest portion with approximately 48% market share. The full-service offering that covers the entire aspect of international employment such as the provision of a legal entity, employment contract, payroll, tax compliance, benefits administration, and HR can be attributed to this domination because companies are not required to set up foreign subsidiaries valued USD 50,000-250,000 per country. Full-service EOR solutions offer full liability whereby the EOR will be the legal employer of record and opinion of compliance with local labor laws, tax regulations and statutory requirements as the client company continues to provide day to day work direction and management. Businesses that employ the full-service EOR save on international hiring expenses by 60-70% relative to entity establishment as well as shortening the market entry schedules from 6-12 months to 1-2 weeks.
The CAGR of contractor management between 2026 and 2035 is also the highest of 10.8% because the gig economy is growing exponentially in value reaching USD 455 billion by 2024, worker classification is increasingly under regulatory analysis with penalties as high as 30% of contractor payments in certain locations, and the flexibility benefits of contractor relations enable companies to recruit and lay off workforces quickly depending on project demand. In the year 2024, the U.S. freelance market has a workforce of 76.4 million, or 47% of the total workforce, based on research by Upwork, and the revenues of the global freelance platforms have topped USD 9.8 billion per year. The new generation of leading EOR providers provides advanced contractor management systems to evaluate classification risks based on AI-enabled analysis of 50+ factors, automatically generating and renewing contracts, and handling 150+ currencies and conversion routes where the relationship between the contractor and the employee is necessary.
By Industry Vertical
Why Information Technology Dominates EOR Applications?
The biggest segment will be the information technology applications that will entail an estimated 31% in 2025. This leadership indicates the pioneering approach towards remote work in the industry, with 86% of technology companies providing remote jobs on FlexJobs data indicating the global shortage of technology talent with 1.4 million unfilled roles leading to significant competition over skilled professionals, the borderless nature of the software development work which could be done anywhere with an internet connection, and the industry’s comfort with online platforms and cloud services. By 2024, the number of technological professionals in the world reached 75 million, and the demand is expected to increase by 25% by 2030 (as the number of new graduates in educational systems exceeds 15 million each year), which leads to a structural talent shortage, which promotes international hiring. The 2024 Developer Survey of Stack Overflow represents the distributed nature of technology work by stating that half of professional software developers work less than half-time and a quarter of professional software developers work full time remotely.
Healthcare is estimated to have the highest CAGR of 10.5% in the period between 2026 and 2035 because of the global shortage of healthcare workers of 13 million professionals identified by WHO, the growing utilization of telemedicine and remote patient monitoring, which is generating the need to deploy distributed clinical teams, the intricate nature of licensing and credentialing that must be passed through by EOR providers, and the trend of healthcare organizations seeking international specialists to consult, conduct research, and administer. The telemedicine market is estimated to be USD 87.8 billion in 2024 and is expected to expand at an average CAGR of 17.2% by facilitating physicians to deliver consultations across borders by managing the licensing requirements that have to be followed by EOR providers.
By Enterprise Size
Why SMEs Dominate the Market?
The biggest grouping is the small and medium enterprises which occupy approximately 53% of the market share in 2025. This supremacy indicates the specific value of proposing the EOR services to smaller organizations that do not have the internal resources to conduct the international HR, legal and compliance services, the cost efficiency of the EOR to the entity establishment which would require overproportional resources to run SMEs, and the agility benefits that enable smaller firms to compete in the global talent pools despite the lack of adequate infrastructure. The SMEs with 10-500 employees constitute 95% of all businesses in the world according to World Bank data and contribute 70% of jobs in OECD nations but in the past there were huge obstacles to international employment which entailed legal entities, experts and economies of scale that made a small foreign workforce uneconomically viable.
EOR services have opened international recruitment to SMEs, and now a company can recruit one or two foreigners at EOR payments of USD 800-1500 per individual employee every month as opposed to USD 50,000-250,000 to form an entity at the time of establishment plus the ongoing compliance costs of USD 30,000-80,000 per annum. Technology start-ups are an exceptionally fast-growing area of SMEs, as venture-backed firms are developing distributed teams at their initial stages, instead of converting them into costly technological cities with a high concentration of employees. According to the data provided by First Round Capital, the idea to create distributed teams is now regarded as important by 78% of startup founders, whereas 42% intend to become entirely remote, thus pushing EOR to the young companies.
Report Scope
| Feature of the Report | Details |
| Market Size in 2026 | USD 7.45 billion |
| Projected Market Size in 2035 | USD 15.89 billion |
| Market Size in 2025 | USD 6.82 billion |
| CAGR Growth Rate | 9.24% CAGR |
| Base Year | 2025 |
| Forecast Period | 2026-2035 |
| Key Segment | By Service Type, Enterprise Size, Industry Vertical, Employment Type and Region |
| Report Coverage | Revenue Estimation and Forecast, Company Profile, Competitive Landscape, Growth Factors and Recent Trends |
| Regional Scope | North America, Europe, Asia Pacific, Middle East & Africa, and South & Central America |
| Buying Options | Request tailored purchasing options to fulfil your requirements for research. |
Regional Analysis
How Big is the North America Market Size?
The North America Employer of Record market size is estimated at USD 2.86 billion in 2025 and is projected to reach approximately USD 5.85 billion by 2035, with a 8.7% CAGR from 2026 to 2035.

Why did North America Dominate the Market in 2025?
With a number of factors influencing this growth such as the presence of technology companies and startups eager to recruit overseas talent, the high rate of remote work adoption, where 58% of all knowledge workers are now working in hybrid settings, the cost pressures in major technology centers where the average software engineer salary is USD 120,000-180,000; the developed venture capital industry where over 10,000 startups are funded yearly and thus demand high-speed scaling abilities, and the complexity of the employment laws of the United States with 50 different state jurisdictions, The United States technology industry has 8.2 million professionals, 1.4 million of whom are vacant, which makes the companies resort to finding talent abroad with the help of EOR programs.
U.S. Market Trends
The U.S. market is typified by the massive concentration of technology in the Silicon Valley area, Seattle, Austin, and Boston to source international talent to cover the skills gap, the startup ecosystem with 73,000 venture-backed firms in need of flexible workforce solutions, the rising complexity of state-level employment laws with California, New York, and other states becoming more demanding, the growing acceptance of remote work with the biggest companies like Salesforce, Meta, and Amazon adopting flexible work practices, and the nearshoring trend leading to Latin America at 40-60% in The demand in the manufacturing and construction industries that need specialized international skills is being generated by the Infrastructure Investment and Jobs Act and the CHIPS Act.
Why is Asia Pacific Experiencing Rapid Growth?
Asia Pacific is the most developed with a growth expectation of 11.3% in 2026-2035 implying that the economic development is fast creating the multinational expansion opportunities, the huge talent pools in India with 5.4 million technology professionals and China with 7 million technology workers, the developing technology ecosystems in the emerging markets, the growing foreign direct investment in the region necessitating compliant employment solutions, and the growing local firms expanding internationally necessitating EOR services in their outbound hiring. The technology industry alone in China alone has 7 million technocrats that can earn an average of half or even less of their counterparts in the Western market.
India Market Trends
The Indian market is typified by the large talent pool of 5.4 million professionals including 1.5 million engineering graduates every year, the well-established outsourcing sector which provides the infrastructure to support global service delivery, the emerging startup ecosystem of 108,000 known startups as of 2024, the rising Indian company rate of international recruitment for sales, marketing and specialized roles and the low wage rates of 60-70% when compared to Western markets yet high English proficiency. The multinational corporations are Global Capability Centers (GCCs), which hire 1.6 million workers in India, increasing the need to develop compliant employment solutions.
Why is Europe Focusing on Compliance and Worker Protection?
The European market is marked by high labor protection that demands profuse provision of expertise such as mandatory notice, strong employment contracts, extensive benefits requirements, works councils, union consultation, and strict termination procedures which vastly differ among the 27 EU member states as well as the UK, Switzerland and Norway. The focus on work-life balance in Europe (annual leave of 20-30 days, with the country-specific range of 14 weeks to 3 years) and high employee rights provides a difficult compliance environment. In Europe, the market size was USD 2.15 billion in 2025 with Brexit adding more confusion as the UK has become independent of the EU regulatory framework.
Germany Market Trends
The German market is characterized by the position of Germany as the largest economy in Europe with a powerful manufacturing base, the growth of the technological sector with the city of Berlin as the start-up center, the rigid employment protection of the Kundigungschutzgesetz (Protection Against Dismissal Act) and the high workforce as a result of dual vocational training system development, and the robust tradition of the works council with its traditional demand that the employees should be consulted. The cost of labor in Germany is an average of EUR 45-55 an hour, contributing to driving companies to complement their local staff with EOR agent international personnel.
Why is Latin America Emerging as Key Nearshore Destination?
The LAMEA region has been growing rapidly because of the nearshore benefits of the North American firms such as the similarity of the time zones, expanding technology ecosystems to generate 150,000-plus engineering graduates per year, the cost benefits of technology salaries that are 40-60% lower than in the U.S.; the rising infrastructure and English language proficiency, and the presence of favorable free trade agreements such as USMCA which can make it easy to conduct business. The technology workforce of Mexico increased to 700,000 professionals in 2024, and Brazil has a market of 530,000 technology workers, which provides sources of talent pools that are available on the EOR services.
Top Players in the Market and Their Offerings
- Globalization Partners
- Velocity Global
- Remote Technology Inc.
- Deel Inc.
- Papaya Global
- Multiplier
- Oyster HR
- Omnipresent
- Atlas HXM
- Remote Team
- Others
Key Developments
The market has undergone significant developments as industry participants seek to expand capabilities and enhance product portfolios.
- In August 2025: Deel announced the expansion of their global payroll infrastructure to support 150 countries and territories, adding AI-powered compliance monitoring that automatically adapts to regulatory changes across jurisdictions, demonstrating the industry’s focus on technology-enabled scalability and comprehensive global coverage.
- In January 2024: Remote launched their Contractor Management Platform 2.0 featuring advanced classification risk assessment using machine learning algorithms that analyze 50+ factors to provide compliance recommendations, addressing the growing regulatory scrutiny of independent contractor relationships worldwide.
The strategic activities have enabled companies to consolidate market positions, product offerings, and technology and capitalize on growth opportunities in the growing market.
The Employer of Record EOR Market is segmented as follows:
By Service Type
- Full-Service EOR
- Multi-Country Payroll
- Contractor Management
- Compliance Management
- Benefits Administration
- Immigration Support
By Enterprise Size
- Large Enterprises
- Small and Medium Enterprises
- Startups
By Industry Vertical
- Information Technology
- Healthcare
- Financial Services
- Manufacturing
- Retail and E-commerce
- Professional Services
- Media and Entertainment
- Education
- Other Industries
By Employment Type
- Full-Time Employees
- Contract Workers
- Temporary Staff
- Part-Time Employees
Regional Coverage:
North America
- U.S.
- Canada
- Mexico
- Rest of North America
Europe
- Germany
- France
- U.K.
- Russia
- Italy
- Spain
- Netherlands
- Rest of Europe
Asia Pacific
- China
- Japan
- India
- New Zealand
- Australia
- South Korea
- Taiwan
- Rest of Asia Pacific
The Middle East & Africa
- Saudi Arabia
- UAE
- Egypt
- Kuwait
- South Africa
- Rest of the Middle East & Africa
Latin America
- Brazil
- Argentina
- Rest of Latin America
Table of Contents
- Chapter 1. Preface
- 1.1 Report Description and Scope
- 1.2 Research scope
- 1.3 Research methodology
- 1.3.1 Market Research Type
- 1.3.2 Market research methodology
- Chapter 2. Executive Summary
- 2.1 Global Employer of Record EOR Market, (2026 – 2035) (USD Billion)
- 2.2 Global Employer of Record EOR Market: snapshot
- Chapter 3. Global Employer of Record EOR Market – Industry Analysis
- 3.1 Employer of Record EOR Market: Market Dynamics
- 3.2 Market Drivers
- 3.2.1 Remote Work Revolution and Global Talent Access
- 3.2.2 Increasing Regulatory Complexity and Compliance Burdens
- 3.3 Market Restraints
- 3.4 Market Opportunities
- 3.5 Market Challenges
- 3.6 Porter’s Five Forces Analysis
- 3.7 Market Attractiveness Analysis
- 3.7.1 Market attractiveness analysis By Service Type
- 3.7.2 Market attractiveness analysis By Enterprise Size
- 3.7.3 Market attractiveness analysis By Industry Vertical
- 3.7.4 Market attractiveness analysis By Employment Type
- Chapter 4. Global Employer of Record EOR Market- Competitive Landscape
- 4.1 Company market share analysis
- 4.1.1 Global Employer of Record EOR Market: company market share, 2025
- 4.2 Strategic development
- 4.2.1 Acquisitions & mergers
- 4.2.2 New Product launches
- 4.2.3 Agreements, partnerships, collaborations, and joint ventures
- 4.2.4 Research and development and Regional expansion
- 4.3 Price trend analysis
- 4.1 Company market share analysis
- Chapter 5. Global Employer of Record EOR Market – Service Type Analysis
- 5.1 Global Employer of Record EOR Market overview: By Service Type
- 5.1.1 Global Employer of Record EOR Market share, By Service Type, 2025 and 2035
- 5.2 Full-Service EOR
- 5.2.1 Global Employer of Record EOR Market by Full-Service EOR, 2026 – 2035 (USD Billion)
- 5.3 Multi-Country Payroll
- 5.3.1 Global Employer of Record EOR Market by Multi-Country Payroll, 2026 – 2035 (USD Billion)
- 5.4 Contractor Management
- 5.4.1 Global Employer of Record EOR Market by Contractor Management, 2026 – 2035 (USD Billion)
- 5.5 Compliance Management
- 5.5.1 Global Employer of Record EOR Market by Compliance Management, 2026 – 2035 (USD Billion)
- 5.6 Benefits Administration
- 5.6.1 Global Employer of Record EOR Market by Benefits Administration, 2026 – 2035 (USD Billion)
- 5.7 Immigration Support
- 5.7.1 Global Employer of Record EOR Market by Immigration Support, 2026 – 2035 (USD Billion)
- 5.1 Global Employer of Record EOR Market overview: By Service Type
- Chapter 6. Global Employer of Record EOR Market – Enterprise Size Analysis
- 6.1 Global Employer of Record EOR Market overview: By Enterprise Size
- 6.1.1 Global Employer of Record EOR Market share, By Enterprise Size, 2025 and 2035
- 6.2 Large Enterprises
- 6.2.1 Global Employer of Record EOR Market by Large Enterprises, 2026 – 2035 (USD Billion)
- 6.3 Small and Medium Enterprises
- 6.3.1 Global Employer of Record EOR Market by Small and Medium Enterprises, 2026 – 2035 (USD Billion)
- 6.4 Startups
- 6.4.1 Global Employer of Record EOR Market by Startups, 2026 – 2035 (USD Billion)
- 6.1 Global Employer of Record EOR Market overview: By Enterprise Size
- Chapter 7. Global Employer of Record EOR Market – Industry Vertical Analysis
- 7.1 Global Employer of Record EOR Market overview: By Industry Vertical
- 7.1.1 Global Employer of Record EOR Market share, By Industry Vertical, 2025 and 2035
- 7.2 Information Technology
- 7.2.1 Global Employer of Record EOR Market by Information Technology, 2026 – 2035 (USD Billion)
- 7.3 Healthcare
- 7.3.1 Global Employer of Record EOR Market by Healthcare, 2026 – 2035 (USD Billion)
- 7.4 Financial Services
- 7.4.1 Global Employer of Record EOR Market by Financial Services, 2026 – 2035 (USD Billion)
- 7.5 Manufacturing
- 7.5.1 Global Employer of Record EOR Market by Manufacturing, 2026 – 2035 (USD Billion)
- 7.6 Retail and E-commerce
- 7.6.1 Global Employer of Record EOR Market by Retail and E-commerce, 2026 – 2035 (USD Billion)
- 7.7 Professional Services
- 7.7.1 Global Employer of Record EOR Market by Professional Services, 2026 – 2035 (USD Billion)
- 7.8 Media and Entertainment
- 7.8.1 Global Employer of Record EOR Market by Media and Entertainment, 2026 – 2035 (USD Billion)
- 7.9 Education
- 7.9.1 Global Employer of Record EOR Market by Education, 2026 – 2035 (USD Billion)
- 7.10 Other Industries
- 7.10.1 Global Employer of Record EOR Market by Other Industries, 2026 – 2035 (USD Billion)
- 7.1 Global Employer of Record EOR Market overview: By Industry Vertical
- Chapter 8. Global Employer of Record EOR Market – Employment Type Analysis
- 8.1 Global Employer of Record EOR Market overview: By Employment Type
- 8.1.1 Global Employer of Record EOR Market share, By Employment Type, 2025 and 2035
- 8.2 Full-Time Employees
- 8.2.1 Global Employer of Record EOR Market by Full-Time Employees, 2026 – 2035 (USD Billion)
- 8.3 Contract Workers
- 8.3.1 Global Employer of Record EOR Market by Contract Workers, 2026 – 2035 (USD Billion)
- 8.4 Temporary Staff
- 8.4.1 Global Employer of Record EOR Market by Temporary Staff, 2026 – 2035 (USD Billion)
- 8.5 Part-Time Employees
- 8.5.1 Global Employer of Record EOR Market by Part-Time Employees, 2026 – 2035 (USD Billion)
- 8.1 Global Employer of Record EOR Market overview: By Employment Type
- Chapter 9. Employer of Record EOR Market – Regional Analysis
- 9.1 Global Employer of Record EOR Market Regional Overview
- 9.2 Global Employer of Record EOR Market Share, by Region, 2025 & 2035 (USD Billion)
- 9.3. North America
- 9.3.1 North America Employer of Record EOR Market, 2026 – 2035 (USD Billion)
- 9.3.1.1 North America Employer of Record EOR Market, by Country, 2026 – 2035 (USD Billion)
- 9.3.1 North America Employer of Record EOR Market, 2026 – 2035 (USD Billion)
- 9.4 North America Employer of Record EOR Market, by Service Type, 2026 – 2035
- 9.4.1 North America Employer of Record EOR Market, by Service Type, 2026 – 2035 (USD Billion)
- 9.5 North America Employer of Record EOR Market, by Enterprise Size, 2026 – 2035
- 9.5.1 North America Employer of Record EOR Market, by Enterprise Size, 2026 – 2035 (USD Billion)
- 9.6 North America Employer of Record EOR Market, by Industry Vertical, 2026 – 2035
- 9.6.1 North America Employer of Record EOR Market, by Industry Vertical, 2026 – 2035 (USD Billion)
- 9.7 North America Employer of Record EOR Market, by Employment Type, 2026 – 2035
- 9.7.1 North America Employer of Record EOR Market, by Employment Type, 2026 – 2035 (USD Billion)
- 9.8. Europe
- 9.8.1 Europe Employer of Record EOR Market, 2026 – 2035 (USD Billion)
- 9.8.1.1 Europe Employer of Record EOR Market, by Country, 2026 – 2035 (USD Billion)
- 9.8.1 Europe Employer of Record EOR Market, 2026 – 2035 (USD Billion)
- 9.9 Europe Employer of Record EOR Market, by Service Type, 2026 – 2035
- 9.9.1 Europe Employer of Record EOR Market, by Service Type, 2026 – 2035 (USD Billion)
- 9.10 Europe Employer of Record EOR Market, by Enterprise Size, 2026 – 2035
- 9.10.1 Europe Employer of Record EOR Market, by Enterprise Size, 2026 – 2035 (USD Billion)
- 9.11 Europe Employer of Record EOR Market, by Industry Vertical, 2026 – 2035
- 9.11.1 Europe Employer of Record EOR Market, by Industry Vertical, 2026 – 2035 (USD Billion)
- 9.12 Europe Employer of Record EOR Market, by Employment Type, 2026 – 2035
- 9.12.1 Europe Employer of Record EOR Market, by Employment Type, 2026 – 2035 (USD Billion)
- 9.13. Asia Pacific
- 9.13.1 Asia Pacific Employer of Record EOR Market, 2026 – 2035 (USD Billion)
- 9.13.1.1 Asia Pacific Employer of Record EOR Market, by Country, 2026 – 2035 (USD Billion)
- 9.13.1 Asia Pacific Employer of Record EOR Market, 2026 – 2035 (USD Billion)
- 9.14 Asia Pacific Employer of Record EOR Market, by Service Type, 2026 – 2035
- 9.14.1 Asia Pacific Employer of Record EOR Market, by Service Type, 2026 – 2035 (USD Billion)
- 9.15 Asia Pacific Employer of Record EOR Market, by Enterprise Size, 2026 – 2035
- 9.15.1 Asia Pacific Employer of Record EOR Market, by Enterprise Size, 2026 – 2035 (USD Billion)
- 9.16 Asia Pacific Employer of Record EOR Market, by Industry Vertical, 2026 – 2035
- 9.16.1 Asia Pacific Employer of Record EOR Market, by Industry Vertical, 2026 – 2035 (USD Billion)
- 9.17 Asia Pacific Employer of Record EOR Market, by Employment Type, 2026 – 2035
- 9.17.1 Asia Pacific Employer of Record EOR Market, by Employment Type, 2026 – 2035 (USD Billion)
- 9.18. Latin America
- 9.18.1 Latin America Employer of Record EOR Market, 2026 – 2035 (USD Billion)
- 9.18.1.1 Latin America Employer of Record EOR Market, by Country, 2026 – 2035 (USD Billion)
- 9.18.1 Latin America Employer of Record EOR Market, 2026 – 2035 (USD Billion)
- 9.19 Latin America Employer of Record EOR Market, by Service Type, 2026 – 2035
- 9.19.1 Latin America Employer of Record EOR Market, by Service Type, 2026 – 2035 (USD Billion)
- 9.20 Latin America Employer of Record EOR Market, by Enterprise Size, 2026 – 2035
- 9.20.1 Latin America Employer of Record EOR Market, by Enterprise Size, 2026 – 2035 (USD Billion)
- 9.21 Latin America Employer of Record EOR Market, by Industry Vertical, 2026 – 2035
- 9.21.1 Latin America Employer of Record EOR Market, by Industry Vertical, 2026 – 2035 (USD Billion)
- 9.22 Latin America Employer of Record EOR Market, by Employment Type, 2026 – 2035
- 9.22.1 Latin America Employer of Record EOR Market, by Employment Type, 2026 – 2035 (USD Billion)
- 9.23. The Middle-East and Africa
- 9.23.1 The Middle-East and Africa Employer of Record EOR Market, 2026 – 2035 (USD Billion)
- 9.23.1.1 The Middle-East and Africa Employer of Record EOR Market, by Country, 2026 – 2035 (USD Billion)
- 9.23.1 The Middle-East and Africa Employer of Record EOR Market, 2026 – 2035 (USD Billion)
- 9.24 The Middle-East and Africa Employer of Record EOR Market, by Service Type, 2026 – 2035
- 9.24.1 The Middle-East and Africa Employer of Record EOR Market, by Service Type, 2026 – 2035 (USD Billion)
- 9.25 The Middle-East and Africa Employer of Record EOR Market, by Enterprise Size, 2026 – 2035
- 9.25.1 The Middle-East and Africa Employer of Record EOR Market, by Enterprise Size, 2026 – 2035 (USD Billion)
- 9.26 The Middle-East and Africa Employer of Record EOR Market, by Industry Vertical, 2026 – 2035
- 9.26.1 The Middle-East and Africa Employer of Record EOR Market, by Industry Vertical, 2026 – 2035 (USD Billion)
- 9.27 The Middle-East and Africa Employer of Record EOR Market, by Employment Type, 2026 – 2035
- 9.27.1 The Middle-East and Africa Employer of Record EOR Market, by Employment Type, 2026 – 2035 (USD Billion)
- Chapter 10. Company Profiles
- 10.1 Globalization Partners
- 10.1.1 Overview
- 10.1.2 Financials
- 10.1.3 Product Portfolio
- 10.1.4 Business Strategy
- 10.1.5 Recent Developments
- 10.2 Velocity Global
- 10.2.1 Overview
- 10.2.2 Financials
- 10.2.3 Product Portfolio
- 10.2.4 Business Strategy
- 10.2.5 Recent Developments
- 10.3 Remote Technology Inc.
- 10.3.1 Overview
- 10.3.2 Financials
- 10.3.3 Product Portfolio
- 10.3.4 Business Strategy
- 10.3.5 Recent Developments
- 10.4 Deel Inc.
- 10.4.1 Overview
- 10.4.2 Financials
- 10.4.3 Product Portfolio
- 10.4.4 Business Strategy
- 10.4.5 Recent Developments
- 10.5 Papaya Global
- 10.5.1 Overview
- 10.5.2 Financials
- 10.5.3 Product Portfolio
- 10.5.4 Business Strategy
- 10.5.5 Recent Developments
- 10.6 Multiplier
- 10.6.1 Overview
- 10.6.2 Financials
- 10.6.3 Product Portfolio
- 10.6.4 Business Strategy
- 10.6.5 Recent Developments
- 10.7 Oyster HR
- 10.7.1 Overview
- 10.7.2 Financials
- 10.7.3 Product Portfolio
- 10.7.4 Business Strategy
- 10.7.5 Recent Developments
- 10.8 Omnipresent
- 10.8.1 Overview
- 10.8.2 Financials
- 10.8.3 Product Portfolio
- 10.8.4 Business Strategy
- 10.8.5 Recent Developments
- 10.9 Atlas HXM
- 10.9.1 Overview
- 10.9.2 Financials
- 10.9.3 Product Portfolio
- 10.9.4 Business Strategy
- 10.9.5 Recent Developments
- 10.10 Remote Team
- 10.10.1 Overview
- 10.10.2 Financials
- 10.10.3 Product Portfolio
- 10.10.4 Business Strategy
- 10.10.5 Recent Developments
- 10.11 Others.
- 10.11.1 Overview
- 10.11.2 Financials
- 10.11.3 Product Portfolio
- 10.11.4 Business Strategy
- 10.11.5 Recent Developments
- 10.1 Globalization Partners
List Of Figures
Figures No 1 to 40
List Of Tables
Tables No 1 to 102
Prominent Player
- Globalization Partners
- Velocity Global
- Remote Technology Inc.
- Deel Inc.
- Papaya Global
- Multiplier
- Oyster HR
- Omnipresent
- Atlas HXM
- Remote Team
- Others
FAQs
The key players in the market are Globalization Partners, Velocity Global, Remote Technology Inc., Deel Inc., Papaya Global, Multiplier, Oyster HR, Omnipresent, Atlas HXM, Remote Team, and Others.
The government regulations have significant influence on the market by introducing complications that become a driving factor on demand of EOR expertise such as labor law differences across 190+ jurisdictions with unique contract, notice, termination and leave entitlements, tax compliance requirements of 159 different income tax regimes and social security contribution rates although varying between 5-45% of wages, classification of workers, including penalties of up to 30% of contractor payments in misclassification claims, data privacy requirement under GDPR, CCPA, PIPL of China as well as Regulatory reforms pose a constant compliance issue and the AB5 law of the state of California on contractor classification, the IR35 regulations of the UK and the proposed platform work directive of the EU have impacted millions of employment relationships. Government programs are also expanding the market, as remote work tax treaties are being modeled among nations, digital nomad visa programs in 50+ nations allow location-independent work, and emerging market incentives to international workers in EOR agreements encourage international hiring. The rising level of employment regulation and the punishment growing all over the world, therefore, the involvement of EOR serves as a key element of risk management in international recruitment.
EOR services use the price model that works on a fee basis which depends on the scope of the service, geography and type of employment. Full service/EOR fees typically vary between USD 400-800 per employee monthly in a typical market, USD 800-1,500 in a complicated jurisdiction with strict regulatory demands and USD 1,200-2,000 in a specialized job where licensing or credentialing assistance is provided such as for a medical professional or an employee in a financial services position. The management services of contractors cost USD 50-200 per contractor per month based on the number of payments and the compliance services provided. These are relatively inexpensive as compared to entity establishment costs between USD 50,000-250,000 per country and annual compliance costs of USD 30,000-80,000, making the ROI with EOR in terms of 5-10 foreign nation workers quite compelling at less than entity establishment costs. The subscription pricing model is predictable in terms of cost with headcount, does not require capital expenditure that burdens balance sheets, and offers immediate cost-saving of 60-70% over traditional international expansion methods based on Global Workplace Analytics. The ability to recruit and dismiss without implications on entities is an added advantage since businesses can join and leave markets without much strains.
Based on current analysis, the market is projected to reach approximately USD 15.89 billion by 2035 with robust growth of 9.24% along the 2026-2035 period due to the permanent transition to the distributed work models, the ongoing talent shortage in the world forecasted to continue until 2030, the penetration of the emerging markets in Latin America, Southeast Asia and Africa, the growth of the gig economy and the workforce contractors to USD 873 billion by 2028, and the growth in the regulatory environment.
North America will remain with the largest share of revenue estimated at 42% of the world market, largely due to the concentration of technology firms and venture-based companies in Silicon Valley, Seattle, Austin, and Boston, the prevalence of remote work and distributed team models, the shortage of 1.4 million professionals in the U.S. technology sector leading to international hiring, the price pressure in key hubs with software engineer salaries of USD 120,000-180,000; and the well-established 73,000-venture.
The fastest growth rate of 11.3% CAGR accredited to the rapid economic growth and multinational expansion is registered in the Asia-Pacific region because of the vast talent pools in India (5.4 million technology professionals) and China (7 million technology workers), the emerging markets of Vietnam, the Philippines, and Indonesia are building strong technology platforms, the competitive wage rates, 50-70% lower than the western markets, the rising level of English proficiency above 70% among younger employees, and the local firms expanding internationally and needing outbound EOR services.
It is predicted that the Global Employer of Record Market will experience impressive growth in light of the remote work revolution where 58% of workers are in hybrid arrangements and 16% are fully remote, the global talent deficit where 1.4 million technology roles remain vacant and the increasing regulatory complexity where 187 new labor regulations per decade on average are being enacted by countries, the USD 455 billion gig economy, which is seeking contractor management solutions, the 40% to 60percent salary savings in emerging markets, which creates a demand to go international, and the average rate of entity.