Enterprise Fraud Management Market Size, Trends and Insights By Solution (Fraud Detection and Prevention, Authentication and Verification, Identity and Access Management, Transaction Monitoring, Case Management, Analytics and Reporting, Compliance Management), By Deployment Mode (Cloud-based, On-premise, Hybrid), By Organization Size (Large Enterprises, Small and Medium Enterprises), By Application (Payment Fraud, Identity Theft, Money Laundering, Account Takeover, Insurance Fraud, Procurement Fraud, Loan Fraud, Other Applications), By Industry Vertical (Banking and Financial Services, Insurance, Retail and E-commerce, Telecommunications, Healthcare, Government and Public Sector, Travel and Hospitality, Other Industries), and By Region - Global Industry Overview, Statistical Data, Competitive Analysis, Share, Outlook, and Forecast 2026 – 2035
Report Snapshot
| Study Period: | 2026-2035 |
| Fastest Growing Market: | Asia Pacific |
| Largest Market: | North America |
Major Players
- NICE Actimize
- IBM Corporation
- SAS Institute Inc.
- FICO (Fair Isaac Corporation)
- Others
Reports Description
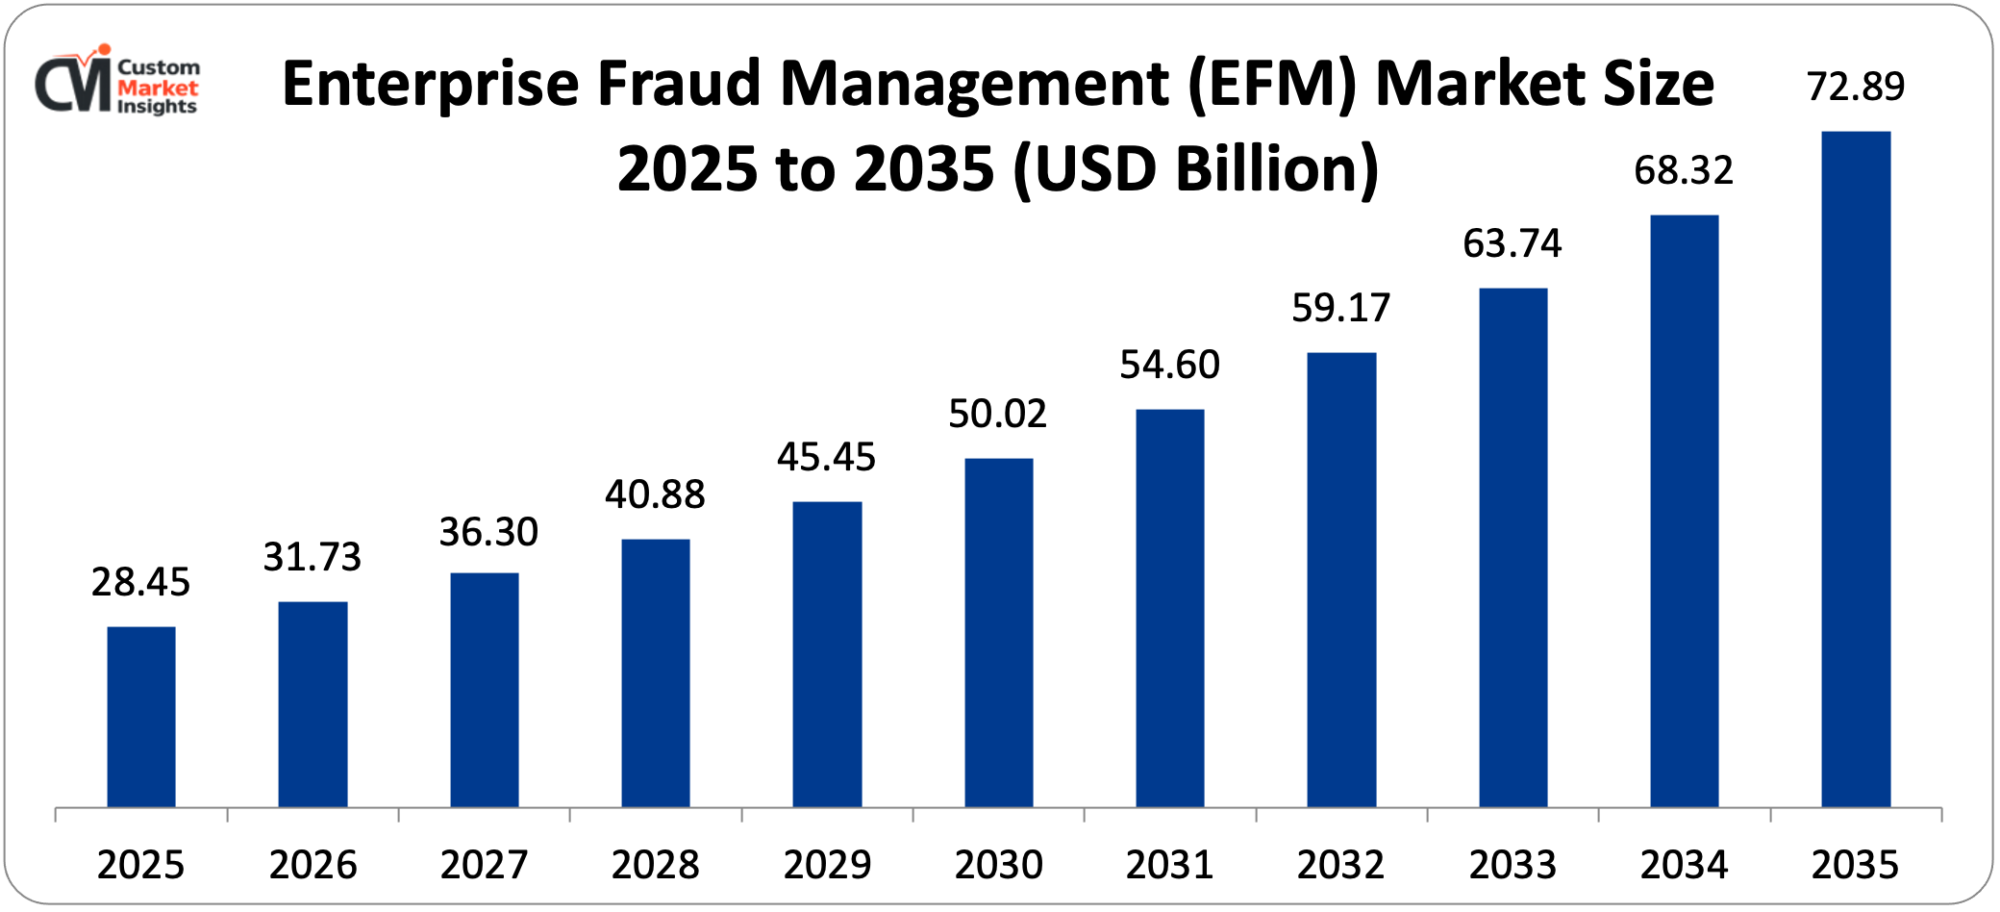
It is estimated that the market size of the global Enterprise Fraud Management (EFM) would be USD 28.45 billion in 2025, and that the market size would increase to USD 31.73 billion in 2026, and to approximately USD 72.89 billion in 2035, at an annual CAGR of 11.53% between the period of 2026 and 2035.
The market is expanding due to the increasing intensity and complexity of cyber fraud attacks, the digitalization of financial services and e-commerce transactions at an unparalleled pace, the increasing regulatory compliance requirements in various sectors, the expansion of connected devices and digital payment channels that create new attack patterns, and the development of artificial intelligence and machine learning technologies that allow the creation of more effective fraud detection and prevention systems.
Market Highlight
- North America will continue to dominate the Enterprise Fraud Management market through a 38% market share in 2025.
- Asia Pacific will grow by 13.2% in the period between 2026 and 2035.
- By 2025, the fraud detection and prevention segment had captured more than 36% of the market share in terms of solution type.
- By solution, the authentication and verification segment will have the greatest CAGR value of 12.8% in 2026-2035.
- Industry vertical-wise, the banking and financial services segment will have the highest market share of 41% in 2025 and the retail and e-commerce segment will lead in terms of the highest CAGR of 13.7% in the time period of the projection, 2026-35.
- The size of the organization: In 2025, the large enterprises segment occupied 68% of the market share.
- Fraud management and prevention solutions had a market share of 15.8% in the overall global cybersecurity market in 2024.
Key Trends & Drivers
The Enterprise Fraud Management Market Trends present significant growth opportunities due to several factors:
- Surge in Digital Payment Fraud and Cybercrime: The unprecedented number of digital transactions and payment opportunities generated by the COVID-19 pandemic has provided opportunities to fraudsters like never before, and cases of fraud losses around the globe total USD 48.2 billion in 2024, which is an increase of 18% over 2023 and is generating a sense of urgency to find ways of managing fraud effectively. The online migration that has been accelerated by the COVID-19 pandemic has essentially transformed the way fraud is conducted to the point that 89% of transactions are made through online channels as opposed to 45% before the pandemic. In 2024, the FBI used its Internet Crime Complaint Center (IC3) to report 880,418 complaints, with total losses of above USD 12.5 billion, a 300% increase in reported cybercrime losses over the last five years. In 2024 alone, card fraud cost the global economy USD 32.4 billion, and 38.7% of global card fraud losses were incurred in the United States, even though it only transacted a quarter of the global card transactions. New fraud risks also exist because the emergence of real-time payment systems such as Faster Payments in the United Kingdom, 11.4 billion transactions per month in UPI in India, and FedNow the United States has removed the fraud prevention windows that were present in traditional payment methods and high-tech fraud detection systems are now essential due to the irreversibility of the real-time payment. Criminals used 15 billion compromised accounts in dark web markets to purchase accounts in account takeover (ATO) attacks that grew by 354% in 2019-2024 and often cost USD 5-15 per account. The complexity of fraud schemes has been dramatically improved, with organized crime groups using cutting-edge technologies, such as AI-powered phishing that has an average click-through rate 60% higher than traditional attacks, deep fake technology that generates convincing video and audio content that can be used in social engineering, and automated bot networks that can stuff credentials with attack occurrences at rates up to 100,000 successful logins per minute against large sites.
- Regulatory Compliance and Data Protection Requirements: The ever-growing global regulatory environment that is highly regulated and enforces strict data protection, anti-money laundering (AML), and know-your-customer (KYC) rules is forcing organizations to adopt holistic fraud management solutions that have strong compliance ability. The European Union Payment Services Directive 2 (PSD2) will introduce strong customer authentication (SCA) when making electronic payments, which means that in order to make a transaction over EUR 30 in 27 EU member states that will involve 448 million consumers, multi-factor authentication will be significant in the process of fraud prevention. PSD2 compliance investments amounted to EUR 1.8 billion in European financial institutions, so the use of authentication technologies and real-time fraud monitoring systems became widespread. The General Data Protection Regulation (GDPR) has strict rules on the treatment of personal data subject to fines of up to EUR 20 million or 4% of annual global turnover, whichever amount is larger, and the total fines imposed in the framework of the GDPR have already reached more than EUR 4.5 billion since its introduction in 2018, as CMS tracking shows. The global fight against money laundering has been on the rise and the Financial Action Task Force (FATF) has set up recommendations that are embraced by 206 countries that have to monitor their transactions, report suspicious activities and run due diligence investigations among competitors. The U.S. financial institutions submit more than 3.6 million Suspicious Activity Reports (SARS) to FinCEN every year, compared to 573,085 SARS submitted by the UK financial institutions in 2024, which pose enormous compliance burdens demanding automated capabilities to detect fraud and manage cases. Both the Bank Secrecy Act and the USA PATRIOT Act provide U.S. financial institutions with extensive AML/KYC requirements, and any breach of AML regulations carries a penalty of billions of dollars, such as the USD 130 million Deutsche Bank in 2024 and the historic USD 1.9 billion AML fine that HSBC received in 2012. The Cybersecurity Law and Personal Information Protection Law (PIPL) of China provide data localization provisions and stringent data transfer measures on multinational corporations that deal with the world’s second-largest economy with a consumer population of 1.4 billion. The California Consumer Privacy Act (CCPA) and a later California Privacy Rights Act (CPRA) establish detailed consumer privacy provisions such as the right to hear what they collect on customers and how they use it, and it is going to directly affect the use of fraud management systems that handle large amounts of data about customers. The India Digital Personal Data Protection Act 2023 provides an extensive data protection framework for the 1.4 billion people and booming digital economy of India that handles more than 11 billion UPI transactions each month. The healthcare fraud laws in the United States, such as HIPAA have imposed certain requirements in terms of patient information protection with fines of USD 100 to USD 50,000 per violation, which presents specialized fraud management requirements in the healthcare vertical. The laws of insurance fraud differ depending on jurisdiction but typically require fraud investigating units and suspicious claims reporting.
What are the Major Advances Changing the Enterprise Fraud Management Market Today
- Artificial Intelligence and Machine Learning Revolution: The most revolutionary technological advancement in fraud management is the incorporation of powerful artificial intelligence-based algorithms and machine learning that allow detecting more complex fraud patterns that bypass the legacy rule-based systems and minimizes false positives by 50-70% in practice. The current AI-based fraud detection systems consider billions of data points on hundreds of variables such as transaction features, device fingerprints, behavioral biometrics, network analysis, and past trends to detect anomalies that may signal the existence of fraudulent activity. Machine learning models keep learning new fraud patterns and adjusting detection rules automatically and without human intervention, which is the very basis of the issue, fraudsters keep devising new strategies and making the existing rule sets irrelevant within 3-6 months. Neural networks and deep learning algorithms analyze unstructured information in the form of text messages to customers, photographs of IDs, and geolocation data to identify advanced fraud rings and intermediaries in various channels in parallel. Natural language processing (NLP) can be used to detect fraud cases by analyzing customer service logs, social media posts, and email messages to detect social engineering, phishing attacks and insider threats and the major banks report that application of NLP capabilities has resulted in 40% higher fraud detection rates. Artificial intelligence-based behavioral biometrics customers use more than 2,000 unique interaction patterns with a device such as typing rhythm, mouse movements, touch screen pressure, and device handling behavior to develop continuous authentication during the sessions and record attempts of accounts being taken over even with authentic credentials. Graph analytics and network analysis algorithms represent relationships between entities some examples of which are accounts, devices, IP addresses, and transaction counterparties to detect rings of fraud and money laundering networks, where technology can analyze networks of billions of nodes and trillions of edges in real-time. The decision intelligence platform by Mastercard manages 75 billion transactions yearly with AI and evaluates risk of fraud in less than 50 milliseconds with 300% better fraud detection rates and 50% fewer false positives with AI than other member boards of the previous generation. Feedzai, a prominent vendor of fraud prevention, states that their AI system examines over 1.6 trillion transactions per year on behalf of international customers and identifies trends of fraud 12-18 months prior to being highly utilized by criminal organizations. The explainability issue in AI fraud detection is already being solved by such models as SHAP (SHapley Additive exPlanations) and LIME (Local Interpretable Model-agnostic Explanations), which give insight into how the model made its decision, which is necessary when a legitimate transaction is rejected to comply with regulatory demands and in appeals.
- Real-Time Transaction Monitoring and Instant Decisioning: The move towards real-time payment systems and immediate transactions has led to the need to develop fraud detection systems that can detect and evaluate the risk of fraud in real time, within milliseconds as opposed to hours and days, and has caused fundamental changes to the structure and methods of fraud management solutions. The transaction data needs to be processed, complex risk models are required, business rules are to be used, and real-time fraud detection systems have to provide the decision within 50-200 milliseconds to prevent the worsening customer experience and success rates of transactions, which demands highly optimized algorithms and a well-scaled infrastructure. The emergence of real-time payment rails such as Faster Payments (UK clearing 3.8 billion transactions valued at GBP 3.4 trillion in 2024), UPI (India clearing 11.4 billion transactions each month in 2024), and FedNow (launched in the U.S. in 2023) removes time delays in fraud prevention by enabling transactions to be completed immediately, posing a challenge to real-time fraud detection. Fraud detection systems can store full customer profiles, transaction history and risk model in-memory data stores and stream processing systems, allowing access in microseconds and common systems with 100,000+ transactions per second per node. Architectures based on event-driven architectures with technologies such as Apache Kafka also allow fraud detection systems to receive transaction data on various channels in parallel and initiate real-time responses such as blocking transactions, step-up authentication challenges or customer alerts within milliseconds. The dilemma of protecting against fraud and providing a good customer experience has seen the development of advanced risk-based processes in which low-risk transactions proceed without much friction and high-risk transactions result in commensurately increased verification processes, and Gartner research suggests that an optimized friction process can cut cart abandonment by 15-20% and maintain the effectiveness of fraud detection. Fraud scoring incorporates traditional transactional risk factors with behavioral biometrics, device intelligence, and network analysis to produce the overall fraud probability score in less than 100 milliseconds, and the best systems today score fraud detection of over 95 and a false positive rate of less than 1. Real-time fraud detection is not only limited to payments, as AI-guided systems that verify identity documents, cross-reference against sanctions lists, do liveness detection on selfies, and determine the risk of an application within under 60 seconds not only shorten the time customers open accounts (15-30 minutes vs. 2-3 minutes) but also cut fraud detection by 40% based on Onfido customer data.
- Multi-Channel Fraud Detection and Omnichannel Integration: The growth of online platforms such as mobile banking apps, internet browsers, touchless payments, ATMs, voice recognition, and new platforms such as cryptocurrency wallets has imposed demanding fraud management demands involving a single platform of detection at every customer interface. Accenture research has found that modern consumers engage in financial services across 5.7 different channels on average, which forms fragmented data silos that are exploited by the fraudsters due to the differences and discrepancies in channel-specific fraud controls. Omnichannel fraud detection services fuse data on transactions, authentication activities, and behavior and represent customers in a single profile across all channels, with which patterns of cross-channel fraud (such as criminals using stolen credentials to buy a minor purchase on a mobile application and then seeking to empty their wallets by transferring large sums of money via online banking) can be detected. The growth of the Internet of Things (IoT) to 15.9 billion connected devices in the world in 2024 according to IoT Analytics subjects the Internet of Things to new fraud vectors such as compromised smart home devices used as proxies in credential stuffing attacks and fraudulent insurance claims based on manipulated IoT sensor data and payment fraud via connected vehicles. Mobile device fraud has grown where criminals have been known to use emulators to impersonate valid devices, device farms with hundreds of running phones at a time to commit account creation fraud, and SIM swapping attacks where they can steal credentials through SMS-enabled authentication and take over the accounts. The FBI has received 2,026 SIM swap complaints in 2024, with frauds amounting to USD 72 million plus. Fraud detection infrastructures have now deployed device intelligence platforms that gather 500+ device attributes comprising of hardware attributes, software configuration, network attributes, and device behavioral patterns to generate unique device fingerprints with 99.9% accuracy to recognize previously seen devices when criminals may be trying to conceal attributes of devices. Geographic anomaly detection uses transaction location information together with established customer behavioral tendencies to identify transactions with high risk jurisdictions or having an unrealistic travel history, which is now augmented with VPN detection, GPS spoofing, and mobile network analysis. Voice channel fraud has risen as fraudsters have taken the opportunity of exploiting call centers through social engineering with Pindrop citing USD 11 billion of possible voice fraud loss, and advanced vishing (voice phishing) frauds utilizing deepfake voice synthesis to mimic authentic customers necessitating the adoption of voice biometrics and artificial intelligence based call analysis.
- Collaborative Fraud Intelligence and Consortium Models: The understanding of fraud as an industry-wide problem and not an institutional problem has spurred the development of fraud intelligence sharing consortiums and collaborative defense models where consortiums of organizations share anonymized fraud information to identify new threats and enhance system detection abilities. Fraud data consortia can allow member organizations to share the intelligence of aggregated data of millions of customers and billions of transactions, and platforms such as the RiskOps Network at Feedzai can process data on clients representing 1.6 billion consumer accounts across 190 countries to see the beginning of new conduits of fraud before they can affect individual organizations. Network Effect in fraud prevention The Network Effect states that every member enhances the ability to detect fraud for all participants and studies have shown that fraud consortiums will lower the false positive rates by 35-50 and increase the fraud detection rate by 25-40 compared to single institutional fraud detection strategies. The sharing of compromised account data, known fraudster data, and novel patterns of attack is shared in real-time through financial services consortiums such as the Merchants Risk Council (11,000+ member organizations) and the American Bankers Association Deposit Account Fraud Consortium (hundreds of participating banks). The telecommunications sector has sophisticated consortiums such as the Communications Fraud Control Association in which the carriers exchange their data concerning international revenue share frauds, subscription frauds, and SIM box frauds that cost the industry USD 39.89 billion each year, as estimated by CFCA. Data sharing on frauds and privacy protection Privacy-preserving technologies such as homomorphic encryption and secure multi-party computation allow sharing data on fraud without revealing customer privacy and are also applicable to fraud models trained on shared encrypted data of multiple organizations without access to unencrypted data by any of the participants. Fraud intelligence platforms based on blockchain are being developed to offer immutable audit histories of a fraud report and provide automated trust scores of data contributors, with pilot projects in trade finance fraud prevention and identity verification already promising. The issue of data standardization among the members of the consortium is also being addressed by industry efforts such as the Fraud Classifier Model created by ACI Worldwide which offers a standard set of taxonomy of the types of frauds and frauds are uniformly reported and analysed irrespective of the organization and geographical location.
Category Wise Insights
By Solution
Why Fraud Detection and Prevention Lead the Market?
The biggest segment will be the banking and financial services applications with an estimated 41% in 2025. This leadership is an indication of the industry being the major target of fraud attacks that constitute 38% of all data breaches in 2024 as reported by the Verizon Data Breach Investigations Report, the high transaction volumes that exist between the industry and country payment networks handling 623 billion transactions annually with an estimated cost of USD 138 trillion, the rigorous regulations that would be imposed on it in Basel III, Dodd-Frank, PSD2, and many country-specific requirements requiring complete fraud controls and the high-value nature of financial fraud with an average. The banking industry had reported USD 32.4 billion in losses on fraud in 2024, payment card fraud 67, online banking fraud 18, and ATM fraud 9. The adoption of digital banking has dramatically increased to 78% of consumers having access to mobile banking in 2024 versus 43% in 2019, as per the Fed Reserve statistics, which has provided more access to attack surfaces necessitating advanced multi-channel fraud detection technologies.
The highest CAGR of 13.7% is seen between the years 2026 and 2035 within the retail and e-commerce segment due to the explosive growth of online commerce to USD 6.3 trillion in 2024 with 21.2% share of the total retail sales, the emergence of social commerce with USD 992 billion of sales annually using social media, and the sophistication of e-commerce fraud including account takeover, promo abuse, and return fraud costing retailers USD 101 billion a year. The average fraud rates are 1.19% of revenue on e-commerce and 0.06% of revenue on card-present transactions, and the losses on CNP (card-not-present) frauds have reached USD 19 billion in 2024. Added up to the operational expenses, the chargeback burden costs merchants USD 125 billion every year, and merchants lose USD 3.75 incurred on each dollar of fraud as per Javelin Strategy research.
By Industry Vertical
Why does Banking and Financial Services Take Over EFM Applications?
The biggest segment will be banking and financial services, which will constitute an estimated 41% of the market by 2025. Several reasons contribute to this leadership: multinationals mostly experience fraud attacks, which constitute 38% of all data breaches in 2024; payment networks exist globally with 623 billion transactions and USD 138 trillion worth every year; regulatory demands are particularly high, as Basel III, Dodd-Frank, PSD 2, and numerous country-specific regulations demand well-developed fraud controls; and fraud has high costs, with the average loss per incident amounting to USD 21,000. Of all countries around the globe, the banking industry in 2024 was defrauded of USD 32.4 billion, of which payment-card fraud was 67%, ATM fraud 9%, and online banking fraud 18%. There have been sudden increased rates in digital banking. Mobile banking usage in 2024 was 78% of the consumers as opposed to 43% in 2019 (Federal Reserve data) and generates bigger attack phenomenas that require advanced multi-channel fraud detection.
The e-commerce and retail will increase at 13.7% CAGR between 2026 and 2035. Online commerce increased to USD 6.3 trillion in 2024, which included 21.2% of all retail sales. The contribution to USD sales through social media networks was USD 992 billion by social commerce. E-commerce fraud is becoming more intricate – account takeover, promotional abuse, and revenue refund defraud retailers USD101 billion a year. BNPL services have grown to USD 262 billion in transaction volume, creating new fraud opportunities. The average rate of e-commerce fraud is 1.19 per cent. revenue as compared to 0.06% for card-present transactions. Card-not-present (CNP) fraud losses amounted to more than USD19 billion in 2024. Chargebacks impose a considerable cost load of USD 125 billion per year when the operation cost is added. Merchants lose, on average, USD 3.75 on each dollar of fraud.
By Organization Size
Why are Big Organizations taking over the Market Place?
In 2025, the market share of big enterprises is 68% of the market share. They dominate because of the large number of transactions they are dealing with (huge volumes of transactions every month, 50-500 million) and highly structured and multi-channel operations that involve branches, mobile apps, online platforms, ATMs, and call centers. These institutions require end-to-end fraud detection. Fraud attacks in large enterprises are also sophisticated, as organized crime groups would go after the high-value assets. The corporate compliance has high costs, and regulatory frameworks have strict controls. The average cost of fraud prevention technology and fraud prevention operations in fortune 500 financial institutions is USD 1050 million every year. They process terabytes of data each day in their detection systems and use 20-100 data science experts to administer machine learning models and detection rules.
The small and medium enterprise (SME) segment representing 32% of market share is experiencing growth at 10.2% CAGR as cloud-based fraud management platforms reduce adoption barriers, with SaaS solutions available at USD 5,000-50,000 annually compared to USD 50-500 million for enterprise on-premise deployments. SMEs face disproportionate fraud risk, with 43% of cyberattacks targeting small businesses, yet historically lacked access to enterprise-grade fraud detection capabilities, creating a market opportunity for cloud-based solutions democratizing advanced fraud prevention technology.
Report Scope
| Feature of the Report | Details |
| Market Size in 2026 | USD 31.73 billion |
| Projected Market Size in 2035 | USD 72.89 billion |
| Market Size in 2025 | USD 28.45 billion |
| CAGR Growth Rate | 11.53% CAGR |
| Base Year | 2025 |
| Forecast Period | 2026-2035 |
| Key Segment | By Solution, Deployment Mode, Organization Size, Application, Industry Vertical and Region |
| Report Coverage | Revenue Estimation and Forecast, Company Profile, Competitive Landscape, Growth Factors and Recent Trends |
| Regional Scope | North America, Europe, Asia Pacific, Middle East & Africa, and South & Central America |
| Buying Options | Request tailored purchasing options to fulfil your requirements for research. |
Regional Analysis
How Big is the North America Market Size?
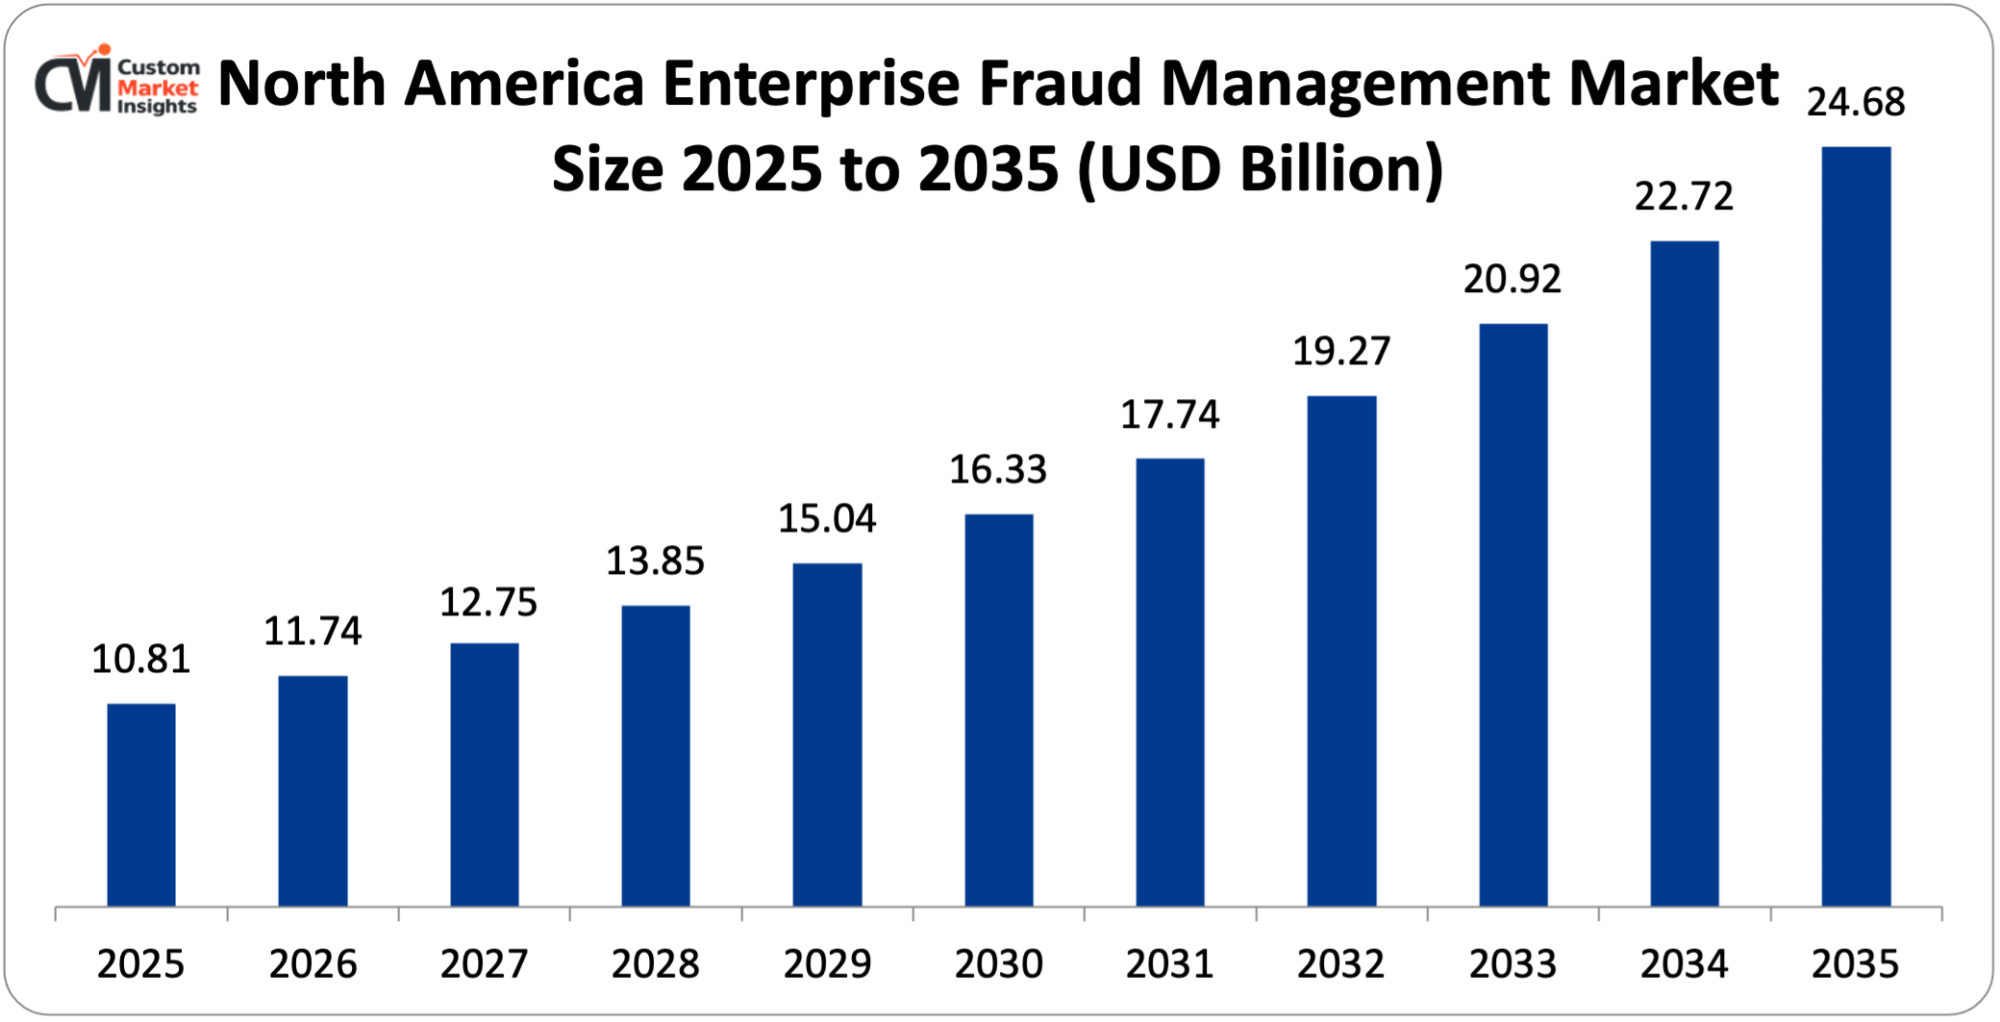
The North America Enterprise Fraud Management market size is estimated at USD 10.81 billion in 2025 and is projected to reach approximately USD 24.68 billion by 2035, with a 10.8% CAGR from 2026 to 2035.
Why did North America Dominate the Market in 2025?
The North American region is central to the global market with an estimated market share of approximately 38% by 2025 due to a number of factors such as the concentration of global financial institutions with USD 23.6 trillion of the assets in the U.S. banks, the huge scale of the e-commerce market with the North American e-commerce sales in USD 1.14 trillion in 2024, the advanced fraud landscape with the region representing 38.7% of the global payment card fraud in spite of the 23% of the transaction volume, the In United States alone, there are 880,418 reported cases of cybercrime to FBI with cumulative losses of USD 12.5 billion and there is an urgent need to improve their ability to manage frauds.
United States Market Trends
The presence of a large financial services industry with more than 4,700 banks with FDIC insurance and 5,000 credit unions with more than USD 4.45 million in data breaches per incident, the advanced e-commerce infrastructure with Amazon, Walmart, Target and thousands of online stores processing trillions in credit and transactions each year, the regulatory sophistication with federal legislation alongside state-specific regulations such as the CCPA of California and the SHIELD Act of New York, and the investment by venture capitalists in fraud prevention technologies worth more than USD 2.8 Traders in the United States alone recorded USD 12.5 billion in payment card frauds in 2024 with card-not-present frauds taking 75% of the losses as e-commerce continues booming.
Why is Asia Pacific Experiencing Rapid Growth?
The most promising growth rate is in Asia Pacific with a forecasted CAGR of 13.2% in 2026-2035 which means that financial services are rapidly being digitalized with a huge mobile payment market in China of USD 58 trillion of transactions and India of 11.4 billion transactions via UPI platforms and the growing middle classes population of 3.2 billion consumers who are increasingly accessing digital financial services, the ever-growing sophistication of fraud with organized crime groups targeting the rapidly expanding digital-based ecosystem and government initiatives that encourage the use of digital WeChat Pay and Alipay that transact a greater number of mobile payment transactions in China with a combined user base of more than 1.8 billion accounts have more than 90% of the mobile payment transactions.
China Market Trends
The huge mobile payment ecosystem that supports USD 58 trillion worth of transactions annually in Alipay and WeChat Pay, the high-tech fraud risks such as payment fraud, account takeover, money laundering, which demand advanced AI-based detection, the government regulatory policies that are enforced by the Cybersecurity Law and Data Security Law that requires comprehensive fraud controls, the fast growth of e-commerce where the platforms such as Alibaba, JD.com, and Pinduoduo process billions of transactions every quarter, and the appearance of domestic fraud detection vendors such as Tongdun Technology and People bank of china made 100.74 billion mobile payment transactions in 2024 worth RMB 527.2 trillion which posed enormous fraud detection demands.
Why is Europe Focusing on Regulatory Compliance and Consumer Protection?
European market: The European market is defined by strict regulatory requirements such as PSD2 that mandates the use of strong customer authentication on electronic payment involving 448 million consumers in 27 EU countries; GDPR, which mandates data protection requirements in a complex compliance environment; and national regulators such as the UK Financial Conduct Authority rules requiring electronic money payment with high customer authentication. European banks and payment service providers spent EUR 1.8 billion to comply with PSD2 and achieve their fraud prevention and strong customer authentication capabilities. In 2025, the market size of the European market was USD 8.42 billion with advanced fraud schemes that comprised cross-border payment fraud and emerging digital identity theft.
Germany Market Trends
The German market is characterized by the dominant status of the country as the largest economy in Europe with a large banking system featuring Deutsche Bank, Commerzbank and many regional banks, the advanced state of the e-commerce market where online sales have already surpassed EUR 87 billion in 2024; the advanced culture of protecting information privacy with Germany being one of the first to adopt GDPR, the rising challenges with fraud with BKA registering 146,363 cases of cybercrime in 2024, and the focus on privacy-conscious fraud detection solutions. German banks have more than 21 billion transactions per year of cashless payments amounting to EUR 5.4 trillion, and the infrastructure of fraud management is necessary.
Why is the Middle East & Africa Region Experiencing Growth?
The LAMEA region is undergoing growth as as a result of the intensive financial inclusion efforts where mobile money accounts are growing at 548 million in sub-Saharan Africa alone as per GSMA data, the digital transformation plans in Gulf Cooperation Council countries such as the UAE in Dubai 10X, and Saudi Arabia in Vision 2030, the new fraud issues as the digital financial services are growing more rapidly than the fraud prevention facilities, the regulatory redesign using AML/KYC regulation in line with FATF standards, and the expanding volumes of cross-border In 2024, the UAE cleared more than 5.2 billion digital payment transactions worth AED 2.4 trillion and Saudi Arabia had 6.4 billion transactions in its mada payment network worth SAR 852 billion.
Top Players in the Market and Their Offerings
- NICE Actimize
- IBM Corporation
- SAS Institute Inc.
- FICO (Fair Isaac Corporation)
- ACI Worldwide
- Fiserv Inc.
- BAE Systems Applied Intelligence
- LexisNexis Risk Solutions
- Experian plc
- CyberSource Corporation (Visa)
- Others
Key Developments
The market has undergone significant developments as industry participants seek to expand capabilities and enhance product portfolios.
- In February 2025: NICE Actimize launched their next-generation Fraud & Authentication Management platform, incorporating advanced AI capabilities that reduce false positives by 60% while improving fraud detection rates by 35%, featuring real-time behavioral biometrics and cross-channel analytics that process 500,000 transactions per second.
- In May 2021: FICO announced the expansion of their Falcon Fraud Platform with new machine learning models specifically designed for real-time payment fraud detection, achieving decision latencies under 50 milliseconds while analyzing 180+ risk factors, addressing the growing fraud challenges in instant payment systems globally.
These strategic activities have allowed companies to strengthen market positions, expand product offerings, enhance technological capabilities, and capitalize on growth opportunities within the expanding market.
The Enterprise Fraud Management Market is segmented as follows:
By Solution
- Fraud Detection and Prevention
- Authentication and Verification
- Identity and Access Management
- Transaction Monitoring
- Case Management
- Analytics and Reporting
- Compliance Management
By Deployment Mode
- Cloud-based
- On-premise
- Hybrid
By Organization Size
- Large Enterprises
- Small and Medium Enterprises
By Application
- Payment Fraud
- Identity Theft
- Money Laundering
- Account Takeover
- Insurance Fraud
- Procurement Fraud
- Loan Fraud
- Other Applications
By Industry Vertical
- Banking and Financial Services
- Insurance
- Retail and E-commerce
- Telecommunications
- Healthcare
- Government and Public Sector
- Travel and Hospitality
- Other Industries
Regional Coverage:
North America
- U.S.
- Canada
- Mexico
- Rest of North America
Europe
- Germany
- France
- U.K.
- Russia
- Italy
- Spain
- Netherlands
- Rest of Europe
Asia Pacific
- China
- Japan
- India
- New Zealand
- Australia
- South Korea
- Taiwan
- Rest of Asia Pacific
The Middle East & Africa
- Saudi Arabia
- UAE
- Egypt
- Kuwait
- South Africa
- Rest of the Middle East & Africa
Latin America
- Brazil
- Argentina
- Rest of Latin America
Table of Contents
- Chapter 1. Preface
- 1.1 Report Description and Scope
- 1.2 Research scope
- 1.3 Research methodology
- 1.3.1 Market Research Type
- 1.3.2 Market research methodology
- Chapter 2. Executive Summary
- 2.1 Global Enterprise Fraud Management Market, (2026 – 2035) (USD Billion)
- 2.2 Global Enterprise Fraud Management Market: snapshot
- Chapter 3. Global Enterprise Fraud Management Market – Industry Analysis
- 3.1 Enterprise Fraud Management Market: Market Dynamics
- 3.2 Market Drivers
- 3.2.1 Surge in Digital Payment Fraud and Cybercrime
- 3.2.2 Regulatory Compliance and Data Protection Requirements
- 3.3 Market Restraints
- 3.4 Market Opportunities
- 3.5 Market Challenges
- 3.6 Porter’s Five Forces Analysis
- 3.7 Market Attractiveness Analysis
- 3.7.1 Market attractiveness analysis By Solution
- 3.7.2 Market attractiveness analysis By Deployment Mode
- 3.7.3 Market attractiveness analysis By Organization Size
- 3.7.4 Market attractiveness analysis By Application
- 3.7.5 Market attractiveness analysis By Industry Vertical
- Chapter 4. Global Enterprise Fraud Management Market- Competitive Landscape
- 4.1 Company market share analysis
- 4.1.1 Global Enterprise Fraud Management Market: company market share, 2025
- 4.2 Strategic development
- 4.2.1 Acquisitions & mergers
- 4.2.2 New Product launches
- 4.2.3 Agreements, partnerships, collaborations, and joint ventures
- 4.2.4 Research and development and Regional expansion
- 4.3 Price trend analysis
- 4.1 Company market share analysis
- Chapter 5. Global Enterprise Fraud Management Market – Solution Analysis
- 5.1 Global Enterprise Fraud Management Market overview: By Solution
- 5.1.1 Global Enterprise Fraud Management Market share, By Solution, 2025 and 2035
- 5.2 Fraud Detection and Prevention
- 5.2.1 Global Enterprise Fraud Management Market by Fraud Detection and Prevention, 2026 – 2035 (USD Billion)
- 5.3 Authentication and Verification
- 5.3.1 Global Enterprise Fraud Management Market by Authentication and Verification, 2026 – 2035 (USD Billion)
- 5.4 Identity and Access Management
- 5.4.1 Global Enterprise Fraud Management Market by Identity and Access Management, 2026 – 2035 (USD Billion)
- 5.5 Transaction Monitoring
- 5.5.1 Global Enterprise Fraud Management Market by Transaction Monitoring, 2026 – 2035 (USD Billion)
- 5.6 Case Management
- 5.6.1 Global Enterprise Fraud Management Market by Case Management, 2026 – 2035 (USD Billion)
- 5.7 Analytics and Reporting
- 5.7.1 Global Enterprise Fraud Management Market by Analytics and Reporting, 2026 – 2035 (USD Billion)
- 5.8 Compliance Management
- 5.8.1 Global Enterprise Fraud Management Market by Compliance Management, 2026 – 2035 (USD Billion)
- 5.1 Global Enterprise Fraud Management Market overview: By Solution
- Chapter 6. Global Enterprise Fraud Management Market – Deployment Mode Analysis
- 6.1 Global Enterprise Fraud Management Market overview: By Deployment Mode
- 6.1.1 Global Enterprise Fraud Management Market share, By Deployment Mode, 2025 and 2035
- 6.2 Cloud-based
- 6.2.1 Global Enterprise Fraud Management Market by Cloud-based, 2026 – 2035 (USD Billion)
- 6.3 On-premise
- 6.3.1 Global Enterprise Fraud Management Market by On-premise, 2026 – 2035 (USD Billion)
- 6.4 Hybrid
- 6.4.1 Global Enterprise Fraud Management Market by Hybrid, 2026 – 2035 (USD Billion)
- 6.1 Global Enterprise Fraud Management Market overview: By Deployment Mode
- Chapter 7. Global Enterprise Fraud Management Market – Organization Size Analysis
- 7.1 Global Enterprise Fraud Management Market overview: By Organization Size
- 7.1.1 Global Enterprise Fraud Management Market share, By Organization Size, 2025 and 2035
- 7.2 Large Enterprises
- 7.2.1 Global Enterprise Fraud Management Market by Large Enterprises, 2026 – 2035 (USD Billion)
- 7.3 Small and Medium Enterprises
- 7.3.1 Global Enterprise Fraud Management Market by Small and Medium Enterprises, 2026 – 2035 (USD Billion)
- 7.1 Global Enterprise Fraud Management Market overview: By Organization Size
- Chapter 8. Global Enterprise Fraud Management Market – Application Analysis
- 8.1 Global Enterprise Fraud Management Market overview: By Application
- 8.1.1 Global Enterprise Fraud Management Market share, By Application, 2025 and 2035
- 8.2 Payment Fraud
- 8.2.1 Global Enterprise Fraud Management Market by Payment Fraud, 2026 – 2035 (USD Billion)
- 8.3 Identity Theft
- 8.3.1 Global Enterprise Fraud Management Market by Identity Theft, 2026 – 2035 (USD Billion)
- 8.4 Money Laundering
- 8.4.1 Global Enterprise Fraud Management Market by Money Laundering, 2026 – 2035 (USD Billion)
- 8.5 Account Takeover
- 8.5.1 Global Enterprise Fraud Management Market by Account Takeover, 2026 – 2035 (USD Billion)
- 8.6 Insurance Fraud
- 8.6.1 Global Enterprise Fraud Management Market by Insurance Fraud, 2026 – 2035 (USD Billion)
- 8.7 Procurement Fraud
- 8.7.1 Global Enterprise Fraud Management Market by Procurement Fraud, 2026 – 2035 (USD Billion)
- 8.8 Loan Fraud
- 8.8.1 Global Enterprise Fraud Management Market by Loan Fraud, 2026 – 2035 (USD Billion)
- 8.9 Other Applications
- 8.9.1 Global Enterprise Fraud Management Market by Other Applications, 2026 – 2035 (USD Billion)
- 8.1 Global Enterprise Fraud Management Market overview: By Application
- Chapter 9. Global Enterprise Fraud Management Market – Industry Vertical Analysis
- 9.1 Global Enterprise Fraud Management Market overview: By Industry Vertical
- 9.1.1 Global Enterprise Fraud Management Market share, By Industry Vertical, 2025 and 2035
- 9.2 Banking and Financial Services
- 9.2.1 Global Enterprise Fraud Management Market by Banking and Financial Services, 2026 – 2035 (USD Billion)
- 9.3 Insurance
- 9.3.1 Global Enterprise Fraud Management Market by Insurance, 2026 – 2035 (USD Billion)
- 9.4 Retail and E-commerce
- 9.4.1 Global Enterprise Fraud Management Market by Retail and E-commerce, 2026 – 2035 (USD Billion)
- 9.5 Telecommunications
- 9.5.1 Global Enterprise Fraud Management Market by Telecommunications, 2026 – 2035 (USD Billion)
- 9.6 Healthcare
- 9.6.1 Global Enterprise Fraud Management Market by Healthcare, 2026 – 2035 (USD Billion)
- 9.7 Government and Public Sector
- 9.7.1 Global Enterprise Fraud Management Market by Government and Public Sector, 2026 – 2035 (USD Billion)
- 9.8 Travel and Hospitality
- 9.8.1 Global Enterprise Fraud Management Market by Travel and Hospitality, 2026 – 2035 (USD Billion)
- 9.9 Other Industries
- 9.9.1 Global Enterprise Fraud Management Market by Other Industries, 2026 – 2035 (USD Billion)
- 9.1 Global Enterprise Fraud Management Market overview: By Industry Vertical
- Chapter 10. Enterprise Fraud Management Market – Regional Analysis
- 10.1 Global Enterprise Fraud Management Market Regional Overview
- 10.2 Global Enterprise Fraud Management Market Share, by Region, 2025 & 2035 (USD Billion)
- 10.3. North America
- 10.3.1 North America Enterprise Fraud Management Market, 2026 – 2035 (USD Billion)
- 10.3.1.1 North America Enterprise Fraud Management Market, by Country, 2026 – 2035 (USD Billion)
- 10.3.1 North America Enterprise Fraud Management Market, 2026 – 2035 (USD Billion)
- 10.4 North America Enterprise Fraud Management Market, by Solution, 2026 – 2035
- 10.4.1 North America Enterprise Fraud Management Market, by Solution, 2026 – 2035 (USD Billion)
- 10.5 North America Enterprise Fraud Management Market, by Deployment Mode, 2026 – 2035
- 10.5.1 North America Enterprise Fraud Management Market, by Deployment Mode, 2026 – 2035 (USD Billion)
- 10.6 North America Enterprise Fraud Management Market, by Organization Size, 2026 – 2035
- 10.6.1 North America Enterprise Fraud Management Market, by Organization Size, 2026 – 2035 (USD Billion)
- 10.7 North America Enterprise Fraud Management Market, by Application, 2026 – 2035
- 10.7.1 North America Enterprise Fraud Management Market, by Application, 2026 – 2035 (USD Billion)
- 10.8 North America Enterprise Fraud Management Market, by Industry Vertical, 2026 – 2035
- 10.8.1 North America Enterprise Fraud Management Market, by Industry Vertical, 2026 – 2035 (USD Billion)
- 10.9. Europe
- 10.9.1 Europe Enterprise Fraud Management Market, 2026 – 2035 (USD Billion)
- 10.9.1.1 Europe Enterprise Fraud Management Market, by Country, 2026 – 2035 (USD Billion)
- 10.9.1 Europe Enterprise Fraud Management Market, 2026 – 2035 (USD Billion)
- 10.10 Europe Enterprise Fraud Management Market, by Solution, 2026 – 2035
- 10.10.1 Europe Enterprise Fraud Management Market, by Solution, 2026 – 2035 (USD Billion)
- 10.11 Europe Enterprise Fraud Management Market, by Deployment Mode, 2026 – 2035
- 10.11.1 Europe Enterprise Fraud Management Market, by Deployment Mode, 2026 – 2035 (USD Billion)
- 10.12 Europe Enterprise Fraud Management Market, by Organization Size, 2026 – 2035
- 10.12.1 Europe Enterprise Fraud Management Market, by Organization Size, 2026 – 2035 (USD Billion)
- 10.13 Europe Enterprise Fraud Management Market, by Application, 2026 – 2035
- 10.13.1 Europe Enterprise Fraud Management Market, by Application, 2026 – 2035 (USD Billion)
- 10.14 Europe Enterprise Fraud Management Market, by Industry Vertical, 2026 – 2035
- 10.14.1 Europe Enterprise Fraud Management Market, by Industry Vertical, 2026 – 2035 (USD Billion)
- 10.15. Asia Pacific
- 10.15.1 Asia Pacific Enterprise Fraud Management Market, 2026 – 2035 (USD Billion)
- 10.15.1.1 Asia Pacific Enterprise Fraud Management Market, by Country, 2026 – 2035 (USD Billion)
- 10.15.1 Asia Pacific Enterprise Fraud Management Market, 2026 – 2035 (USD Billion)
- 10.16 Asia Pacific Enterprise Fraud Management Market, by Solution, 2026 – 2035
- 10.16.1 Asia Pacific Enterprise Fraud Management Market, by Solution, 2026 – 2035 (USD Billion)
- 10.17 Asia Pacific Enterprise Fraud Management Market, by Deployment Mode, 2026 – 2035
- 10.17.1 Asia Pacific Enterprise Fraud Management Market, by Deployment Mode, 2026 – 2035 (USD Billion)
- 10.18 Asia Pacific Enterprise Fraud Management Market, by Organization Size, 2026 – 2035
- 10.18.1 Asia Pacific Enterprise Fraud Management Market, by Organization Size, 2026 – 2035 (USD Billion)
- 10.19 Asia Pacific Enterprise Fraud Management Market, by Application, 2026 – 2035
- 10.19.1 Asia Pacific Enterprise Fraud Management Market, by Application, 2026 – 2035 (USD Billion)
- 10.20 Asia Pacific Enterprise Fraud Management Market, by Industry Vertical, 2026 – 2035
- 10.20.1 Asia Pacific Enterprise Fraud Management Market, by Industry Vertical, 2026 – 2035 (USD Billion)
- 10.21. Latin America
- 10.21.1 Latin America Enterprise Fraud Management Market, 2026 – 2035 (USD Billion)
- 10.21.1.1 Latin America Enterprise Fraud Management Market, by Country, 2026 – 2035 (USD Billion)
- 10.21.1 Latin America Enterprise Fraud Management Market, 2026 – 2035 (USD Billion)
- 10.22 Latin America Enterprise Fraud Management Market, by Solution, 2026 – 2035
- 10.22.1 Latin America Enterprise Fraud Management Market, by Solution, 2026 – 2035 (USD Billion)
- 10.23 Latin America Enterprise Fraud Management Market, by Deployment Mode, 2026 – 2035
- 10.23.1 Latin America Enterprise Fraud Management Market, by Deployment Mode, 2026 – 2035 (USD Billion)
- 10.24 Latin America Enterprise Fraud Management Market, by Organization Size, 2026 – 2035
- 10.24.1 Latin America Enterprise Fraud Management Market, by Organization Size, 2026 – 2035 (USD Billion)
- 10.25 Latin America Enterprise Fraud Management Market, by Application, 2026 – 2035
- 10.25.1 Latin America Enterprise Fraud Management Market, by Application, 2026 – 2035 (USD Billion)
- 10.26 Latin America Enterprise Fraud Management Market, by Industry Vertical, 2026 – 2035
- 10.26.1 Latin America Enterprise Fraud Management Market, by Industry Vertical, 2026 – 2035 (USD Billion)
- 10.27. The Middle-East and Africa
- 10.27.1 The Middle-East and Africa Enterprise Fraud Management Market, 2026 – 2035 (USD Billion)
- 10.27.1.1 The Middle-East and Africa Enterprise Fraud Management Market, by Country, 2026 – 2035 (USD Billion)
- 10.27.1 The Middle-East and Africa Enterprise Fraud Management Market, 2026 – 2035 (USD Billion)
- 10.28 The Middle-East and Africa Enterprise Fraud Management Market, by Solution, 2026 – 2035
- 10.28.1 The Middle-East and Africa Enterprise Fraud Management Market, by Solution, 2026 – 2035 (USD Billion)
- 10.29 The Middle-East and Africa Enterprise Fraud Management Market, by Deployment Mode, 2026 – 2035
- 10.29.1 The Middle-East and Africa Enterprise Fraud Management Market, by Deployment Mode, 2026 – 2035 (USD Billion)
- 10.30 The Middle-East and Africa Enterprise Fraud Management Market, by Organization Size, 2026 – 2035
- 10.30.1 The Middle-East and Africa Enterprise Fraud Management Market, by Organization Size, 2026 – 2035 (USD Billion)
- 10.31 The Middle-East and Africa Enterprise Fraud Management Market, by Application, 2026 – 2035
- 10.31.1 The Middle-East and Africa Enterprise Fraud Management Market, by Application, 2026 – 2035 (USD Billion)
- 10.32 The Middle-East and Africa Enterprise Fraud Management Market, by Industry Vertical, 2026 – 2035
- 10.32.1 The Middle-East and Africa Enterprise Fraud Management Market, by Industry Vertical, 2026 – 2035 (USD Billion)
- Chapter 11. Company Profiles
- 11.1 NICE Actimize
- 11.1.1 Overview
- 11.1.2 Financials
- 11.1.3 Product Portfolio
- 11.1.4 Business Strategy
- 11.1.5 Recent Developments
- 11.2 IBM Corporation
- 11.2.1 Overview
- 11.2.2 Financials
- 11.2.3 Product Portfolio
- 11.2.4 Business Strategy
- 11.2.5 Recent Developments
- 11.3 SAS Institute Inc.
- 11.3.1 Overview
- 11.3.2 Financials
- 11.3.3 Product Portfolio
- 11.3.4 Business Strategy
- 11.3.5 Recent Developments
- 11.4 FICO (Fair Isaac Corporation)
- 11.4.1 Overview
- 11.4.2 Financials
- 11.4.3 Product Portfolio
- 11.4.4 Business Strategy
- 11.4.5 Recent Developments
- 11.5 ACI Worldwide
- 11.5.1 Overview
- 11.5.2 Financials
- 11.5.3 Product Portfolio
- 11.5.4 Business Strategy
- 11.5.5 Recent Developments
- 11.6 Fiserv Inc.
- 11.6.1 Overview
- 11.6.2 Financials
- 11.6.3 Product Portfolio
- 11.6.4 Business Strategy
- 11.6.5 Recent Developments
- 11.7 BAE Systems Applied Intelligence
- 11.7.1 Overview
- 11.7.2 Financials
- 11.7.3 Product Portfolio
- 11.7.4 Business Strategy
- 11.7.5 Recent Developments
- 11.8 LexisNexis Risk Solutions
- 11.8.1 Overview
- 11.8.2 Financials
- 11.8.3 Product Portfolio
- 11.8.4 Business Strategy
- 11.8.5 Recent Developments
- 11.9 Experian plc
- 11.9.1 Overview
- 11.9.2 Financials
- 11.9.3 Product Portfolio
- 11.9.4 Business Strategy
- 11.9.5 Recent Developments
- 11.10 CyberSource Corporation (Visa)
- 11.10.1 Overview
- 11.10.2 Financials
- 11.10.3 Product Portfolio
- 11.10.4 Business Strategy
- 11.10.5 Recent Developments
- 11.11 Others.
- 11.11.1 Overview
- 11.11.2 Financials
- 11.11.3 Product Portfolio
- 11.11.4 Business Strategy
- 11.11.5 Recent Developments
- 11.1 NICE Actimize
List Of Figures
Figures No 1 to 48
List Of Tables
Tables No 1 to 127
Prominent Player
- NICE Actimize
- IBM Corporation
- SAS Institute Inc.
- FICO (Fair Isaac Corporation)
- ACI Worldwide
- Fiserv Inc.
- BAE Systems Applied Intelligence
- LexisNexis Risk Solutions
- Experian plc
- CyberSource Corporation (Visa)
- Others
FAQs
The key players in the market are NICE Actimize, IBM Corporation, SAS Institute Inc., FICO (Fair Isaac Corporation), ACI Worldwide, Fiserv Inc., BAE Systems Applied Intelligence, LexisNexis Risk Solutions, Experian plc, CyberSource Corporation (Visa), Others.
Government regulations are significantly influential in the market because they impose mandatory compliance requirements that drive the adoption of fraud management programs such as the Payment Services Directive 2 (PSD2) which requires the strong customer authentication of electronic payments across the EU covering 448 million consumers and the General Data Protection Regulation (GDPR) which imposes hefty fines of up to EUR 20 million or 4% of worldwide revenue where the breach of privacy little to no data and the Bank Secrecy Act and USA PATRIOT Act both introducing comprehensive obligations under AML/KYC which Market growth is also facilitated by government programs to use digital payments, with the UPI in India recording 11.4 billion transactions every month through government-sponsored implementation, and infrastructure to prevent fraud being necessary to safeguard the booming digital economy serving 1.4 billion consumers.
Enterprise Fraud Management solutions market under various pricing models depending on mode of deployment, size of organization, volume of transactions and complexity of features. Cloud-based fraud detection services can cost subscriptions of USD 5,000-50,000 a year to cater to SME solutions with less than 1 million transactions a year, USD 100,000-500,000 a year to cater to mid-market organizations with 10-50 million transactions, and USD 1-10 million a year to cater to enterprise solutions with billions of transactions and advanced AI powered solutions and multi-channel integration. On-premise enterprise implementation costs USD 500,000 to USD 5 million to purchase licenses along with 18-22% annual maintenance agreements with implementation services costing 40-80% of license costs based on complexity and customization needs. The pricing models of transaction based pay are USD 0.01-0.10 per transaction screened depending on the complexity of risk scoring with the high volume merchants negotiating lower charges of USD 0.001 per transaction. This payback is overwhelming, and fraud prevention systems have saved USD 4-6 per USD spent in most cases and minimized false positive rates (by 50-70%) compared to rule-based systems, saving revenue loss on declined legitimate transactions estimated at 15-20% of the cost of fraud prevention. With the change to cloud-based solutions, the addressable market has been opened to organizations with 100,000-1 million transactions per year that can deploy enterprise-grade fraud detection at affordable prices of USD 10,000-30,000 per year.
With the current analysis, the market is projected to reach approximately USD 72.89 billion in 2035 and a high growth rate of 11.53% from 2026 to 2035 as the digitalization of financial services and commerce continues, the volume of transactions is projected to exceed 850 billion in 2035, the sophistication of fraud schemes is expected to continue to grow leveraging AI and deepfake technologies and quantum computing platforms in subsequent years, and the real-time payment systems are expected to grow throughout the world, requiring milliseconds.
North America is going to reap most of the share of revenues of an estimated 38% of the entire global market, primarily due to the concentration of the world financial institutions structure with the U.S. banks holding the USD 23.6 trillion of assets, the extensive e-commerce ecosystem with the USD 1.14 trillion of the online sales, the advanced fraud landscape with 38.7 of the global card frauds, the advanced regulatory framework with the Dodd-Frank law and the state data breach law that reinforce the compliance investment, and the 880.
The highest growth rate with 13.2% CAGR is observed in the Asia-Pacific region as a result of the high rate of digitalization where mobile payments have reached USD 58 trillion in China and UPI has 11.4 billion transactions monthly in India, the enormous growth of e-commerce reaching USD 2.1 trillion in the region, the rising consumer middle-income population of 3.2 billion consumers with access to digital financial services, the rising level of fraud sophistication targeting the growing digital ecosystems; and the government initiatives in digital payments which demand fraud prevention.
The Global Enterprise Fraud Management Market is also projected to record impressive growth given the growing fraud losses of USD 48.2 billion in the world with 18% yearly growth, the digital payment boom with 623 billion transactions of USD 138 trillion per year providing expansive attack surfaces, the sophistication of fraud schemes with artificial intelligence powered phishing, deepfakes social engineering, and automated bot attacks, the regulatory requirements such as PSD2, GDPR and AML regulations that demand all round fraud controls, the 89% of transactions that are through digital means compared to.