Gas Pipeline Infrastructure Market Size, Trends and Insights By Infrastructure Type (Transmission Pipelines (High-Pressure, Long-Distance), Distribution Pipelines (Medium and Low-Pressure Urban & Suburban), Gathering Pipelines (Field Collection Infrastructure), Offshore Pipelines, Other Infrastructure Types (Interconnectors, Storage Connections)), By Material Type (Steel (Carbon Steel, Alloy Steel, Stainless Steel), Polyethylene (HDPE, MDPE, PE100, PE100-RC), Composite Materials (Reinforced Thermoplastic Pipe, Fiber-Reinforced Polymer), Ductile Iron & Cast Iron (Legacy and Replacement), Other Material Types (Fiberglass, Flexible Pipe)), By Application (Natural Gas (Transmission, Distribution, and Gathering), Hydrogen (Dedicated and Repurposed Pipelines), Biogas & Biomethane, Syngas & Industrial Gas, Other Applications), By Component (Pipes & Tubes, Compressor Stations, Metering Stations & Measurement Equipment, Valves & Fittings, Cathodic Protection Systems, Pig Launchers & Receivers, Other Components (SCADA, Pressure Regulation)), By End-Use (Power Generation, Industrial (Chemical, Fertilizer, Steel, Refining), Residential & Commercial (Heating, Cooking), Transportation (CNG, Gas-to-Liquids), Other End-Uses), and By Region - Global Industry Overview, Statistical Data, Competitive Analysis, Share, Outlook, and Forecast 2026 – 2035
Report Snapshot
CAGR: 7.5%
| Study Period: | 2026-2035 |
| Fastest Growing Market: | Asia Pacific |
| Largest Market: | Asia Pacific |
Major Players
- Tenaris S.A.
- TMK Group
- Vallourec S.A.
- Georg Fischer AG
- Others
Reports Description
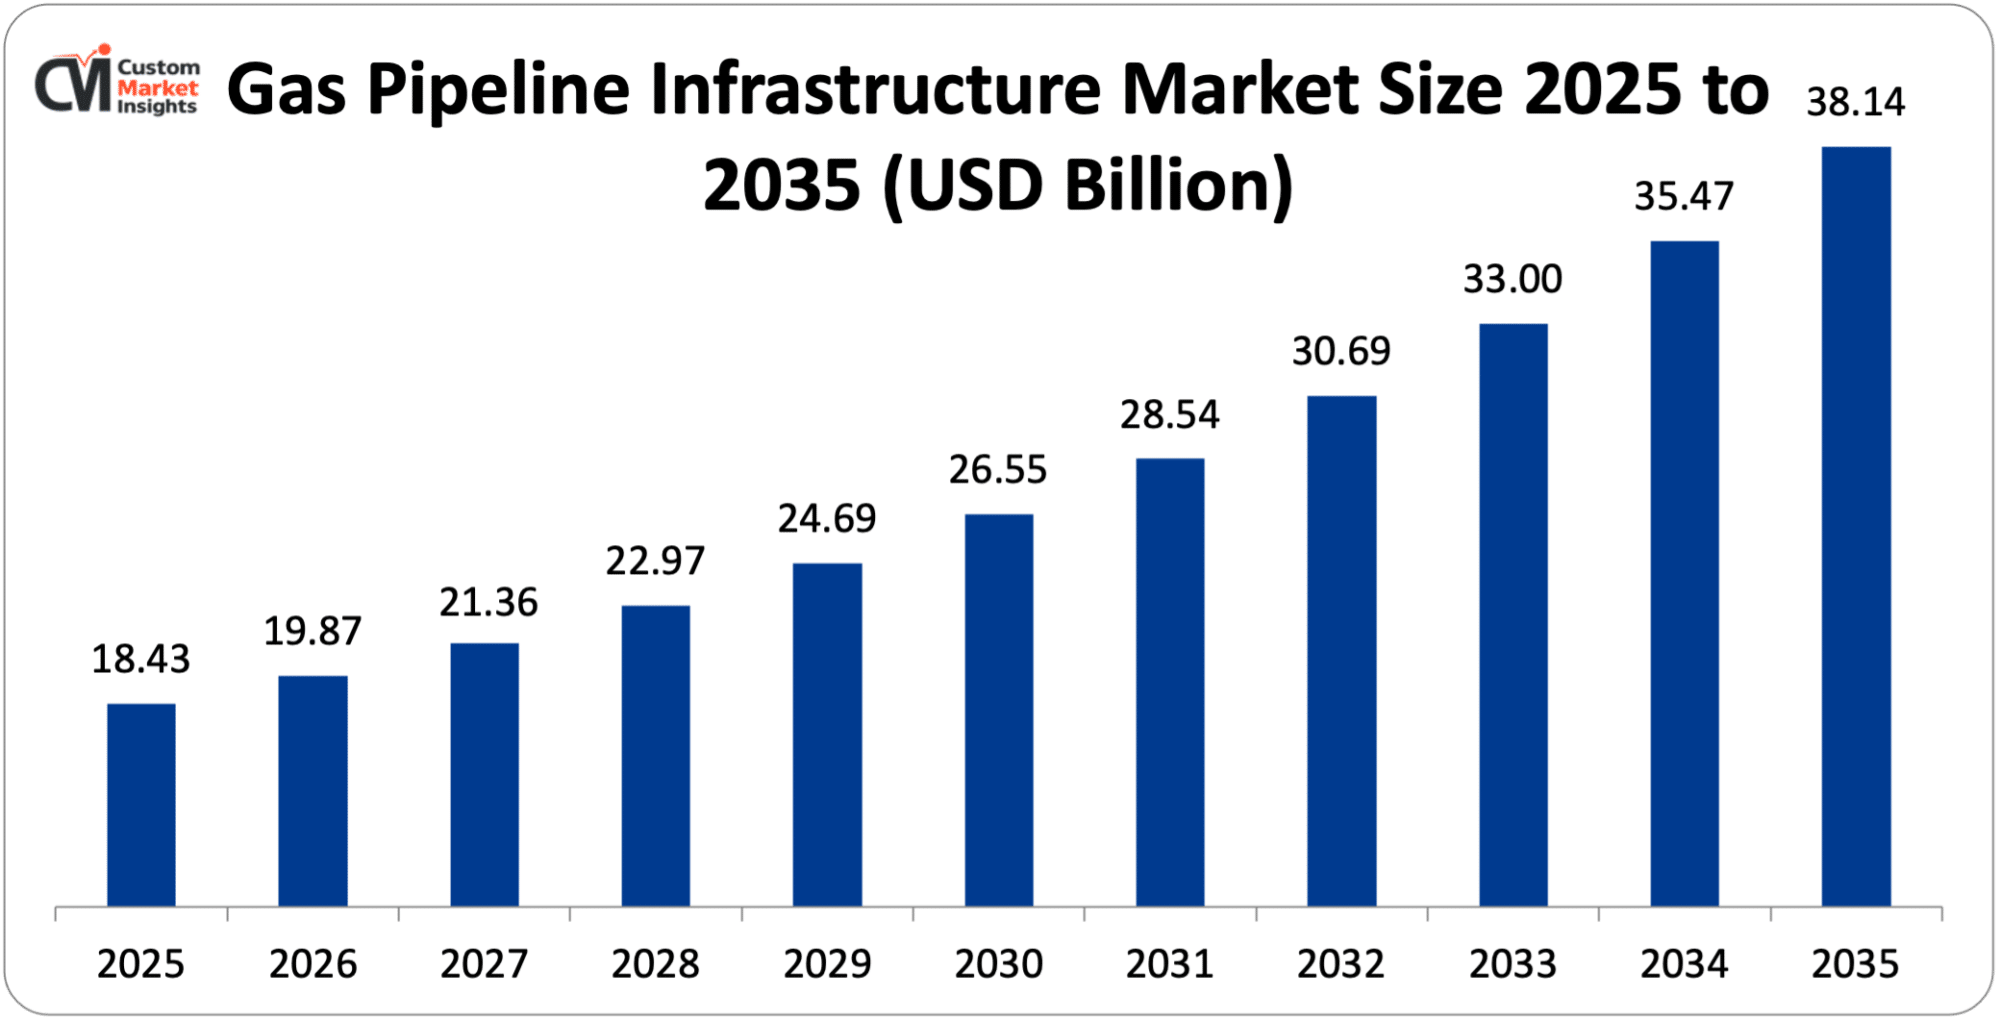
The size of the market of the global gas pipeline infrastructure is estimated at USD 18.43 billion in 2025, which is estimated to grow at a CAGR of 7.5% between 2026 and 2035 to USD 19.87 billion in 2026 to USD 38.14 billion in 2035. The rising global investment into natural gas transmission and distribution networks due to the imperative of energy security raised by geopolitical supply disruptions, the swift creation of hydrogen pipeline infrastructure as a core part of national decarbonization efforts, the enlarged natural gas access in emerging economies through the development of urban distribution networks, the aging of the existing pipeline infrastructure in the developed markets through the necessity of replacing and rehabilitating it; and the increased use of biogas and biomethane injection infrastructure linking renewable gas sources to the existing pipeline networks are collectively driving a sustained and robust market growth over the forecast period.
Market Highlight
- Asia Pacific is the gas pipeline infrastructure market leader with a market share of 34% in 2025.
- The CAGR of the growth of North America will be at 6.8% in the period of 2026-2035.
- Exxon Mobil Infrastructure by type of infrastructure, the transmission pipelines segment had about 41% market share in 2025.
- By going by infrastructure type, the distribution pipelines section is recording the highest CAGR of 8.4% between the year 2026 and 2035.
- By Application, the natural gas segment had the largest market share of 78% in 2025 and the hydrogen pipeline segment projected the quickest CAGR of 18.6% in 2026–2035.
- By type of materials, the steel segment captured 58% of the market in 2025, and the polyethylene segment was the segment with the highest CAGR of 9.2% between 2026 and 2035.
- By end use, the power generation segment was controlling 36% of the market share in 2025.
- Investment in gas pipeline infrastructure was about 43.7% of total midstream energy infrastructure capital spending in the world in 2024 as a testimony to the fundamental contribution of natural gas pipeline networks to the global energy infrastructure linking regions producing energy to global places of consumption over intercontinental distances.
Significant Growth Factors
The Gas Pipeline Infrastructure Market Trends present significant growth opportunities due to several factors:
- Energy Security Imperatives and Natural Gas Supply Diversification Driving Infrastructure Investment: This acute energy security weakness manifested by the Russian invasion of Ukraine in February 2022, leading to the loss of supply of about 155 billion cubic meters of annual Russian natural gas to Europe, or about 40% of European gas imports in time, caused a new wave of emergency and strategic gas infrastructure investment across Europe, North America, and Asia that has relegated the global gas infrastructure investment cycle to fundamentally new levels and continues to drive spending on pipelines at levels well above pre-2022 baselines. According to the International Energy Agency (IEA) report, World Energy Investment 2024, the global natural gas supply investment was estimated to be circa USD 280 billion in 2023, of which the transmission and distribution pipeline infrastructure constituted the major part of the midstream investment. The REPowerEU proposal developed by the European Union in May 2022 to stop the reliance on Russian fossil fuel in particular specifically promised EUR 210 billion of additional energy investment by 2027 that a large portion of which is to be spent on new interconnection pipelines, connections to LNG import terminals, and updating the distribution network, all of which necessitate the large-scale investment in pipeline infrastructure. Connecting new LNG import terminals to Germany, increasing the Iberian Peninsula gas interconnection capacity, synchronizing the Baltic countries with the Russian-dominated IPS/UPS electricity grid, and necessitating the parallel diversification of gas supply to European energy security after 2022 are the physical pipeline infrastructure implications of the post-2022 European energy security transformation. Simultaneously, in Asia, China, India, Japan, and South Korea, domestic gas pipeline network development is being undertaken to maintain the increasing gas demand, LNG import infrastructure ties, and strategic gas storage and pipeline interconnection projects that enhance supply security in case of a future geopolitical or supply disturbance. According to the U.S. Energy Information Administration (EIA), the United States had operated nearly 3 million miles of natural gas pipeline as of 2024, the largest national gas pipeline system in the world, and annual capital investment in United States natural gas pipeline infrastructure continued to be more than USD 20 billion and had enabled United States national gas supply security and the expanding LNG export infrastructure to serve foreign markets. The energy security has increased the gas pipeline infrastructure from a commercial investor decision to a strategic national priority in most major economies, with the government as a support investor.
- Expanding Natural Gas Access in Developing Economies Through Urban Distribution Network Development: The massive parallel programmes of natural gas access underway in the developing economies of South Asia, Southeast Asia, Sub-Saharan Africa, and Latin America, which put the hundreds of millions of households and industry consumers of these regions directly on to a piped natural gas system, are among the most important long-term structural growth drivers to gas distribution pipeline infrastructure in the world as the long, low-pressure polyethylene distribution systems needed to reach these widely distributed populations of consumer units require enormous capital investments of pipe, fittings, metering, and pressure regulation infrastructure across geographically The Pradhan Mantri Urja Ganga and City Gas Distribution (CGD) expansion programs in India are the most ambitious developing economy gas distribution expansion schemes in the world, with the Petroleum and Natural Gas Regulatory Board (PNGRB) of India having granted City Gas Distribution licenses to cover nearly 98% of the geographical area and population of India in the rollout of gas distribution infrastructure development over a 10-year period of buildout. By 2024, India had around 26 million Piped Natural Gas (PNG) household connections and was putting in place more than 2 million new connections every year, the government target of 100 million households to piped gas would mean hundreds of thousands of kilometers of distribution pipeline would have to be constructed connecting Indian cities, towns and villages. Developing countries like Bangladesh, Vietnam, Pakistan, and many African countries such as Nigeria, Tanzania and Mozambique are laying down domestic gas pipeline systems to commercialize local natural gas supplies and replace expensive and polluting cooking and heating fuels such as biomass, kerosene, and LPG – development finance institutions such as the World Bank, Asian Development Bank and African Development bank are providing concessional capital on gas distribution systems in lower income countries. The Sustainable Development Scenario of the IEA recognizes the universal access to clean cooking, which is currently lacking in 2.3 billion individuals in the world, who use solid biomass or other polluting fuels.
What are the Major Advances Changing the Gas Pipeline Infrastructure Market Today?
- Hydrogen-Ready and Dedicated Hydrogen Pipeline Infrastructure Development: The creation of hydrogen as the focal point of global decarbonization plans – both green hydrogen, made by electrolysis of renewable electricity, and blue hydrogen, made by using natural gas with carbon capture and storage (CCS), needs dedicated or repurposed pipeline transmission and distribution systems and is generating a completely new market segment within the existing space of gas pipeline infrastructure that did not exist at commercial scales five years ago. The European Hydrogen Backbone initiative – a group of 31 European gas infrastructure operators representing pipeline systems in 28 countries – released its roadmap in 2022 which anticipates a European hydrogen pipeline network of the order of 53,000 km by 2030 and 84,000 km by 2040, of which around 69% will be repurposing existing natural gas pipelines and 31% will be newly constructed dedicated hydrogen piping. Hydrogen pipeline infrastructure is of higher capital cost than equivalent natural gas pipeline construction, dedicated hydrogen transmission pipelines are estimated to cost 10–20% more than similar natural gas pipelines in terms of cost and require hydrogen-compatible steel grades with controlled hydrogen embrittlement risk, special compressor technology for hydrogen service, and better leak detection systems, generating premium revenue opportunities to pipeline equipment vendors to the hydrogen infrastructure market. The most advanced national hydrogen pipeline infrastructure plan in the world at the pre-construction stage, the national hydrogen network plan of Germany, is aimed at deploying about 9,700 km of hydrogen transmission pipeline by 2032, with an estimated EUR 20 billion of investment, open season processes of capacity reservation on the planned hydrogen pipeline infrastructure have already aroused the interests of the industrial hydrogen users in the chemical, steel and cement industries. By 2050, the Hydrogen Council forecasted in its 2024 global hydrogen outlook that the world would need to deploy about 100,000 km of new and refurbished hydrogen pipelines to deliver hydrogen between production centres and consumption centres, a scale of infrastructure development that will represent investment into the hundreds of billions of dollars that will characterise a new wave of hydrogen pipeline infrastructure construction. The crucial technical problem of hydrogen pipeline infrastructure hydrogen embrittlement of conventional carbon steel pipe which may lead to catastrophic brittle fracture failure at hydrogen partial pressures beyond some threshold has been the motivation behind materials engineering innovations in pipeline steel grades, weld quality requirements and operation pressure management procedures leading to new technical standards in the hydrogen pipeline infrastructure supply chain.
- Digital Pipeline Management and Integrity Monitoring Technology: The digitalization of gas pipeline operations via the deployment of digital monitoring technology i.e. fiber optic distributed acoustic sensing (DAS) and distributed temperature sensing (DTS), satellite based methane leak detection, AI-based pipeline integrity management systems, drone-based aerial inspection programs, and real-time SCADA (Supervisory Control and Data Acquisition) system integration with predictive analytics platforms is establishing a new market in digital pipeline infrastructure technology, as well as a strong operational and regulatory incentive to have pipeline operators invest in it. Pipeline operators around the world are adopting distributed acoustic sensing – in which fiber optic cables along the length of the pipeline are continuously monitored and acoustic signals used to indicate third-party intrusion, ground movement, flow noise of leaks, and mechanical anomalies – as the most effective and cost-effective method of monitoring long transmission infrastructure of pipelines. Methane leak detection Satellite-based methane leak detection – low-cost shortwave infrared spectrometry of commercial satellite constellations such as GHGSat, Kairos Aerospace, and Satellogic – allows pipeline operators to locate and map the points of leakage of methane throughout large pipeline systems at cost levels far lower than alternative ground-based or air-based survey methods, with sensitivities to sources of methane emissions of a few hundred kg/hr at altitudes as high as space. The updated methane regulations of the Inflation Reduction Act by the U.S. Environmental Protection Agency (EPA), which have natural gas pipeline operators potentially meet specific methane emission reduction restrictions with penalties and fines in the event of excess emissions are proving strong regulatory compliance incentives to motivate pipeline operators to invest in extensive leak detection and repair (LDAR) programs using digital monitoring technology. Published analyses indicate that the natural gas pipeline infrastructure accounts for a range between 1 and 3% of the total gas transported by the pipeline infrastructure of most pipeline industries and industry expenditures on leak detection and repair schemes are motivated by both regulatory and commercial incentives to recover the value of the natural gas that would otherwise go to waste. The AI-driven pipeline integrity management systems, which combine the results of inline inspection of intelligent pigging systems with cathodic protection systems and soil movement systems, as well as operational pressure and flow systems, can be used to predict the pipeline segments with high probabilities of failure and implement targeted preventive maintenance strategies to both decrease the risk of pipeline failure and reduce the overall cost of the integrity management program.
- Polyethylene Pipeline Technology Advancement for Distribution Network Modernization: The continued replacement of old cast iron, steel and ductile iron gas transportation mains in the urban pipeline system of developed market economies with new high density polyethylene (HDPE) and medium density polyethylene (MDPE) pipe together with the replacement of polyethylene as the preferred material in which to build new gas distribution systems in virtually all markets around the globe is creating a sustained demand for polyethylene pipe, fittings, and fusion joining equipment, which is the fastest growing materials segment within gas pipeline infrastructure. The United States by itself has some 1.2 million miles of gas distribution mains per the Pipeline and Hazardous Materials Safety Administration (PHMSA), much of it containing cast iron and bare steel gas pipe laid in the middle of the 20 th century, which is long out of service and is highly susceptible to leaks and failure in an urban setting. State utility commissions in the United States have approved accelerated pipeline replacement programs in large gas distribution companies such as National grid, Consolidated Edison, Eversource and Spire energy – that have capital investment commitments in multi-billion dollar infrastructure replacement programs that span a 10-20 year implementation period — to offer sustainable long-term transparency of the polyethylene pipes market in North American distribution. Recent grades of PE100 and PE100-RC (Resistance to Crack) polyethylene pipes – produced by such manufacturers as Wavin (Mexichem), Georg Fischer, Aliaxis, and Primus Line – have a service life exceeding 100 years in the correct operating environment, resistance to soil movement and seismic action causing failures in rigid metallic pipe, better corrosion resistance eliminating the electrochemical corrosion that is the most common source of leaks in aging steel distribution networks, and the fusion welding system that allows the production of joints. This is because both distribution network modernization in the developed markets and new distribution network construction in urbanization programs of the developing economies have seen the value of the global polyethylene gas pipe market to be estimated at circa USD 4.8 billion in 2024 and projected to increase at a CAGR rate of circa 9% until the year 2032.
Category Wise Insights
By Infrastructure Type
Why Do Transmission Pipelines Lead the Market?
In 2025, the transmission pipelines will be the biggest type of infrastructure segment with an approximate market share of about 41%. This pre-eminence is a side effect of the capital intensity of high-pressure, long-diameter transmission pipeline construction, the most capital-intensive type, demanding the greatest specification, most advanced welding and inspection processes, largest compressor stations, and most elaborate SCADA monitoring infrastructure that produces the largest proportion of revenue per kilometer of pipeline built per kilometer compared with lower pressure distribution infrastructure. Onshore natural gas systems Transmission pipelines: Natural gas is transported in large amounts over hundreds or thousands of kilometers over either a single production center or an LNG import terminal down to city gate receiving stations that feed outbound distribution systems, in onshore natural gas systems with pressures of 40 to 100 bar, transmission pipelines are typically of very large diameter, and single transmission pipeline projects may be capital investments of USD 1-5 million per kilometer, depending on pipe diameter, terrain, regulatory requirements, and geographic location. Recent and major ongoing transmission pipeline projects such as the Baltic Pipe linking Norwegian gas fields to Denmark and Poland, LNG connection pipelines in Germany after the FSRU installations at Brunsbuettel and Lubmin, and new gas transmission legs in India linking the LNG import terminals at Mundra and Dhamra to consumption centres in the north of the country are the size of investments in transmission pipelines currently driving the world market. The highest unit-value pipeline material category is the large-diameter pipe made using high-strength X65, X70, and X80 grade carbon steel, which is generally highly priced in 20-56 in. outside dimensions to serve major transmission pipelines and which has high-value grade specifications based on hydrogen service, sour gas service, and arctic service.
By Material Type
Why Does Steel Dominate the Market?
State is the largest type of material segment with a market share of about 58% in 2025 representing the unique specification to high pressure transmission pipelines with the combination of high tensile strength, toughness at operating temperatures, weldability and compatibility with cathodic protection. The worldwide-standardized material used to construct natural gas transmission pipeline is API 5L specification carbon steel line pipe, produced at grades of between X42 and X80, with minimum yield strengths of between 290 MPa and 550 Mpa, with the leading manufacturers of large-diameter API 5L line pipe in the world being Tenaris, TMK, Vallourec, EVRAZ, and Nippon Steel. The introduction of hydrogen-compatible steel grades of pipeline – with controlled chemical composition limits to carbon, sulfur, phosphorus, and other tramp elements, post-weld heat treatment requirements and hardness limits that reduce hydrogen embrittlement vulnerability – are developing a premium product segment in the steel pipeline market as the pace of hydrogen infrastructure development accelerates. The distribution pipeline distribution is a long-term competitive threat to the steel market, where operating pressure is in the ability range of polyethylene, but is not threatened in the high-pressure transmission and gathering sub-sectors that control the total assembly of pipeline infrastructure investment value.
By Application
Why Does Natural Gas Dominate the Market?
The largest application segment appears to be natural gas applications which command a very impressive share of about 78% of the total market share in 2025 in recognition of the established and dominant role played by natural gas in the world energy system; natural gas already provides about 23% of primary energy globally with the IEA reporting that natural gas provides most of the global energy transport system with the world’s largest and most densely networked energy transport system that requires investment in its maintenance, expansion and modernization. The natural gas pipeline network globally covers about 1.3 million kilometers of transmission pipeline and a number of millions more kilometers of distribution infrastructure, which is a capital investment of trillions of dollars, which produces significant replacement, maintenance and expansion investment without the need to construct new greenfields. The infrastructure investment in natural gas pipelines is also resistant to the energy transition pressure because gas is well-known even by the IEA in its scenarios as a transitional energy source that will have a substantial role in the global energy systems by 2035 and possibly even later, especially in the developing economies where coal replacement by natural gas will bring immediate carbon saving benefits as the renewable energy infrastructure is built.
By Component
Why Do Pipes & Tubes Lead the Market?
The largest segment of the component is pipes and tubes at about 52% of the overall market share in 2025, the essential material dominance of pipe in gas pipeline infrastructure investment – with pipe material generally accounting for 35-55% of the total transmission pipeline project cost and 40-60% of the distribution pipeline project cost depending on terrain, regulatory environment, and compressor or station needs. The international line pipe market, which includes API 5L carbon steel pipe to use in transmission and gathering projects and polyethylene pipe used in distribution, is estimated to be USD 8.2 billion in 2024 and is primarily focused on the leading pipeline construction markets of North America, Asia Pacific, and the Middle East. The most expensive component category in terms of cost per installation is compressor stations, which are essential infrastructure in sustaining the momentum of gas flow over long-distance transmission pipelines, and which are normally positioned at intervals ranging between 60 and 160 km, and which are of major centrifugal type and installations of reciprocating compressor stations. Designated at large transmission pipelines: USD 30 USD 150 million per station (civil works) Comprehending turbine or motor-driven compressors, scrubbing and cooling devices, and control systems. Metering stations – where the custody transfer measurement at interconnection points, at city gates, and at the point of delivery of industry consumers is provided—are increasingly becoming a significant source of revenue that is stimulated by the increased use of advanced ultrasonic and Coriolis metering technology that offers improved measurement accuracy and fewer maintenance needs as compared to traditional differential pressure metering, and smart metering provides a means of real time network management and commercial settlement.
By End-Use
Why Does Power Generation Lead the Market?
The largest end-use segment with a market share of about 36% in 2025 is power generation, which is necessitated by the role of natural gas-fired power generation as the principal flexible backup and peaking capacity to intermittent renewable energy in an electricity system that is transitioning to high levels of renewable penetration, a role that is expanding as opposed to shrinking as wind and solar generation increase and the system needs the capacity of a dispatchable gas turbine to address variability in output. In most markets the favored technology in new thermal power generation is gas-fired power plants, such as combined cycle gas turbine (CCGT) plants with efficiencies of up to 62% and open cycle gas turbine (OCGT) peaking plants, which provide rapid response capacity, the IEA estimates that natural gas as a source of electricity contributed about 23% of global electricity generation in 2023. The development of gas pipeline infrastructure between new gas-fired power stations with transmission networks – such as a high-pressure lateral gas pipeline between the transmission main and the gas plant design operating point of the gas distribution and specific compressor pipeline systems to ensure a high-pressure supply of gas at the demands of the global gas-to-power industry – constitutes a major and expanding element of infrastructure investment in gas infrastructure.
Report Scope
| Feature of the Report | Details |
| Market Size in 2026 | USD 19.87 billion |
| Projected Market Size in 2035 | USD 38.14 billion |
| Market Size in 2025 | USD 18.43 billion |
| CAGR Growth Rate | 7.5% CAGR |
| Base Year | 2025 |
| Forecast Period | 2026-2035 |
| Key Segment | By Infrastructure Type, Material Type, Application, Component, End-Use and Region |
| Report Coverage | Revenue Estimation and Forecast, Company Profile, Competitive Landscape, Growth Factors and Recent Trends |
| Regional Scope | North America, Europe, Asia Pacific, Middle East & Africa, and South & Central America |
| Buying Options | Request tailored purchasing options to fulfil your requirements for research. |
Regional Analysis
How Big is the Asia Pacific Market Size?
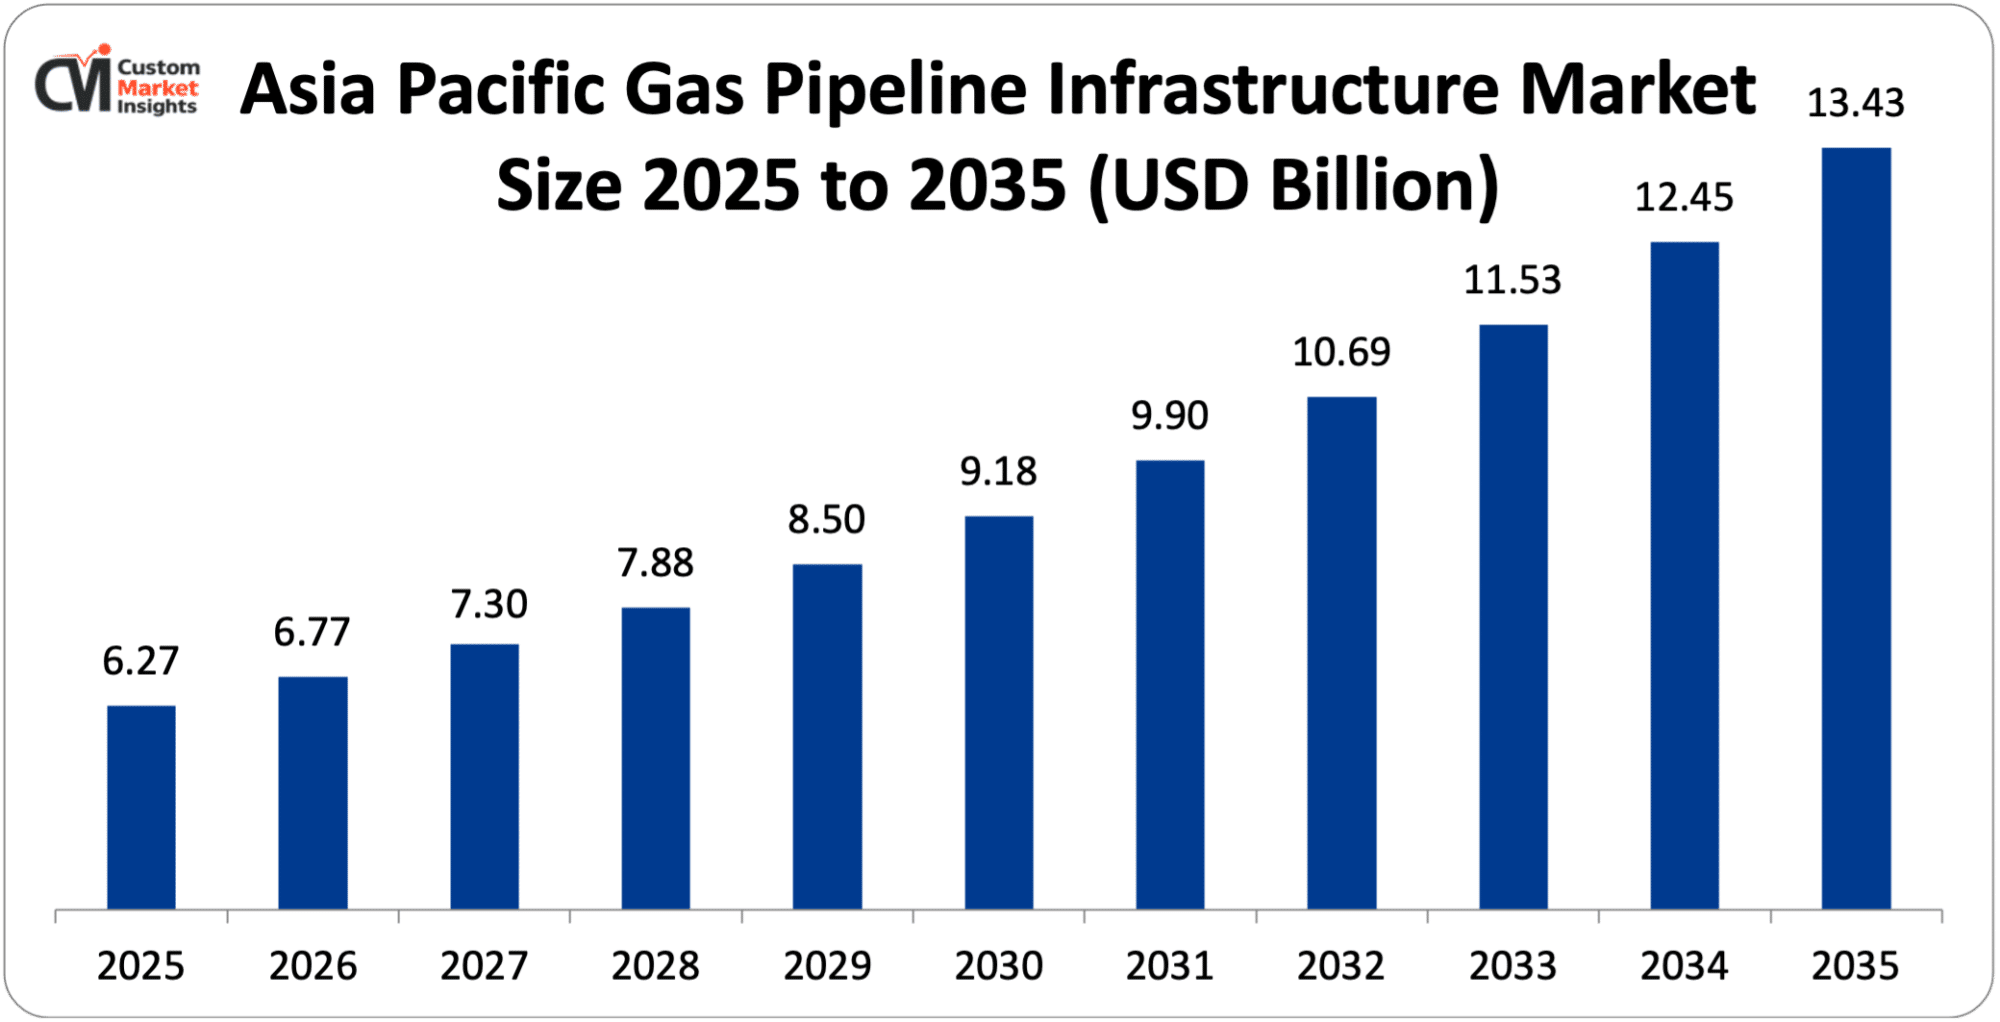
The Asia Pacific gas pipeline infrastructure market size is estimated at USD 6.27 billion in 2025 and is projected to reach approximately USD 13.43 billion by 2035, with an 8.1% CAGR from 2026 to 2035.
Why Did Asia Pacific Dominate the Market in 2025?
In 2025, the Asia Pacific has an estimated market share of 34% of the world, which shows the convergence of the highest-growing gas demand in the world alongside the boldest gas infrastructure development opportunities ever witnessed by the world, fronted by the expansion of the national gas network in China and the CGD development in India together with the highest number of households in the region getting piped gas services first. China has an estimated 120,000 km of long-distance natural gas transmission system as per the National Energy Administration, which is the third-largest in the world national transmission system, and further investment in expansion has been subject to growth in domestic gas demand, pipeline linkages with Central Asian suppliers of gas, and the establishment of a national gas storage network to enhance security of supply. The National Development and Reform Commission of China has always put a high priority on the natural gas infrastructure investment as a part of the two different programs of urban air quality improvement, such as the replacement of coal heating in the cities of northern China with natural gas, as well as the diversification of energy sources and the elimination of the excessive dependence on the single source of gas supply. The two infrastructure priorities in India, namely LNG import terminal pipeline connections and urban CGD distribution network construction, are ironing out some of the most rapid rates of pipeline investment growth in the globe, which is backed by the regulatory framework of the PNGRB and the commercial involvement of both the public sector companies of GAIL India, Indraprastha Gas, and Mahanagar Gas and the private operators of Adani Total Gas and Gujarat Gas.
Why is North America Experiencing Steady and Important Growth?
The steady growth of North America is projected to have a CAGR of 6.8% between 2026 and 2035 due to the status of the United States as the largest producer of natural gas globally and its production of U.S. dry natural gas amounting to about 103 billion cubic feet per day by 2023 as the EIA predicts. This necessitates continuous gathering, processing, and transmission infrastructure development to transport gas out of natural gas prolific production basins such as the Permian and Marcellus/Utica. Hay Accelerated distribution main replacement programs authorized by state utility regulators, the creation of new natural gas pipeline connections to meet increased capacity in LNG export facilities on the Gulf Coast, and the emerging hydrogen pipeline infrastructure development connected with the DOE Regional Clean Hydrogen Hubs program that is being invested in by USD 7 billion of federal funding are also fueling the U.S. pipeline infrastructure investment.
Why is Europe Focusing on Energy Security and Infrastructure Diversification?
In 2025 the market size of European gas pipeline infrastructure is approximated to be around USD 4.14 billion and is expected to be around USD 8.47 billion in 2035 at a CAGR of 7.4%. The post-2022 energy security transformation has fundamentally changed the nature of investment in the gas pipeline infrastructure of Europe, as the investment priorities shifted to the post-2022 trend of diversifying the emergency supply, to the creation of new import connection infrastructure, and to early hydrogen backbone pipeline network development that are part of the European decarbonization strategies. The 53,000 km network of the European Hydrogen Backbone initiative by 2030 is the most significant medium-term gas infrastructure investment program in Europe, with operators of networks in Germany, the Netherlands, Belgium, France, Italy, and Spain all progressing on hydrogen pipeline repurification and new construction projects, which are now in the planning and permitting phases. The proposed 9,700 km hydrogen transmission network, the heart of the European hydrogen backbone, in Germany has obtained regulatory approval to proceed with its open season procedure and is in the process of seeking the authorization to begin with the construction of the first sections, as the European chemical and steel industries need to be supplied with hydrogen.
Why is the Middle East & Africa Region an Important Growth Market?
The LAMEA region shows good market development supported by the investment in the gas infrastructure in Saudi Arabia and the UAE to support industrial diversification under Vision 2030 and Vision 2071, where Saudi Aramco and ADNOC invest in expanded domestic gas gathering, processing, and distribution infrastructure to serve non-oil industries, including petrochemicals, smelting of aluminum, and desalination; Sub-Saharan Africa’s development of local natural gas resources in Mozambique, Tanzania, Nigeria, and Senegal, where gathering and transmission pipeline infrastructure would connect offshore and onshore gas fields to domestic consumers and LNG export facilities, and Brazil’s development of natural gas distribution infrastructure supporting the government’s Gas Law reform of 2021 designed to liberalize the Brazilian gas market and attract investment in gas distribution network expansion.
Top Players in the Market and Their Offerings
- Tenaris S.A.
- TMK Group
- Vallourec S.A.
- Georg Fischer AG
- Wavin (Orbia Advance Corporation)
- Aliaxis S.A.
- Aegion Corporation
- EVRAZ plc
- Nippon Steel Corporation
- S. Steel Corporation
- Shawflex (Anixter)
- Others
Key Developments
The market has undergone significant developments as industry participants seek to expand hydrogen-compatible product capabilities, address accelerating distribution network modernization demand, and respond to the fundamental restructuring of global gas infrastructure investment priorities driven by energy security imperatives and decarbonization strategies.
- In September 2024: Tenaris S.A. declared the commercial introduction of its HydroStar hydrogen-grade line item product line – covering API 5L X52 to X70 grades with controlled chemistry specifications, improved toughness necessities, and third party tested hydrogen embrittlement resistance testing at working pressures up to 100 bar – particularly designed to be applied in dedicated hydrogen transmission pipeline service.
- In January 2025: Georg Fischer Piping Systems declared a USD 45 million investment in increased HDPE gas pipe production capacity at its Schaffhausen, Switzerland, and Coventry, United Kingdom, plants with particular focus on the growing market of main replacement programs of aging cast iron and bare steel distribution networks.
Such strategic undertakings have enabled businesses to consolidate market shares and enhance product functionalities towards the new hydrogen pipeline infrastructure market, increase production capacity to meet the growing distribution network modernisation demand, and invent trenchless rehabilitation technologies in enhancing the cost-effectiveness and environmental performance of old infrastructure replacement programs throughout the global gas pipeline network.
The Gas Pipeline Infrastructure Market is segmented as follows:
By Infrastructure Type
- Transmission Pipelines (High-Pressure, Long-Distance)
- Distribution Pipelines (Medium and Low-Pressure Urban & Suburban)
- Gathering Pipelines (Field Collection Infrastructure)
- Offshore Pipelines
- Other Infrastructure Types (Interconnectors, Storage Connections)
By Material Type
- Steel (Carbon Steel, Alloy Steel, Stainless Steel)
- Polyethylene (HDPE, MDPE, PE100, PE100-RC)
- Composite Materials (Reinforced Thermoplastic Pipe, Fiber-Reinforced Polymer)
- Ductile Iron & Cast Iron (Legacy and Replacement)
- Other Material Types (Fiberglass, Flexible Pipe)
By Application
- Natural Gas (Transmission, Distribution, and Gathering)
- Hydrogen (Dedicated and Repurposed Pipelines)
- Biogas & Biomethane
- Syngas & Industrial Gas
- Other Applications
By Component
- Pipes & Tubes
- Compressor Stations
- Metering Stations & Measurement Equipment
- Valves & Fittings
- Cathodic Protection Systems
- Pig Launchers & Receivers
- Other Components (SCADA, Pressure Regulation)
By End-Use
- Power Generation
- Industrial (Chemical, Fertilizer, Steel, Refining)
- Residential & Commercial (Heating, Cooking)
- Transportation (CNG, Gas-to-Liquids)
- Other End-Uses
Regional Coverage:
North America
- U.S.
- Canada
- Mexico
- Rest of North America
Europe
- Germany
- France
- U.K.
- Russia
- Italy
- Spain
- Netherlands
- Rest of Europe
Asia Pacific
- China
- Japan
- India
- New Zealand
- Australia
- South Korea
- Taiwan
- Rest of Asia Pacific
The Middle East & Africa
- Saudi Arabia
- UAE
- Egypt
- Kuwait
- South Africa
- Rest of the Middle East & Africa
Latin America
- Brazil
- Argentina
- Rest of Latin America
Table of Contents
- Chapter 1. Report Introduction
- 1.1. Report Description
- 1.1.1. Purpose of the Report
- 1.1.2. USP & Key Offerings
- 1.2. Key Benefits For Stakeholders
- 1.3. Target Audience
- 1.4. Report Scope
- 1.1. Report Description
- Chapter 2. Market Overview
- 2.1. Report Scope (Segments And Key Players)
- 2.1.1. Gas Pipeline Infrastructure by Segments
- 2.1.2. Gas Pipeline Infrastructure by Region
- 2.2. Executive Summary
- 2.2.1. Market Size & Forecast
- 2.2.2. Gas Pipeline Infrastructure Market Attractiveness Analysis, By Infrastructure Type
- 2.2.3. Gas Pipeline Infrastructure Market Attractiveness Analysis, By Material Type
- 2.2.4. Gas Pipeline Infrastructure Market Attractiveness Analysis, By Application
- 2.2.5. Gas Pipeline Infrastructure Market Attractiveness Analysis, By Component
- 2.2.6. Gas Pipeline Infrastructure Market Attractiveness Analysis, By End-Use
- 2.1. Report Scope (Segments And Key Players)
- Chapter 3. Market Dynamics (DRO)
- 3.1. Market Drivers
- 3.1.1. Energy Security Imperatives and Natural Gas Supply Diversification Driving Infrastructure Investment
- 3.1.2. Expanding Natural Gas Access in Developing Economies Through Urban Distribution Network Development
- 3.2. Market Restraints
- 3.3. Market Opportunities
- 3.5. Pestle Analysis
- 3.6. Porter Forces Analysis
- 3.7. Technology Roadmap
- 3.8. Value Chain Analysis
- 3.9. Government Policy Impact Analysis
- 3.10. Pricing Analysis
- 3.1. Market Drivers
- Chapter 4. Gas Pipeline Infrastructure Market – By Infrastructure Type
- 4.1. Infrastructure Type Market Overview, By Infrastructure Type Segment
- 4.1.1. Gas Pipeline Infrastructure Market Revenue Share, By Infrastructure Type, 2025 & 2035
- 4.1.2. Transmission Pipelines (High-Pressure, Long-Distance)
- 4.1.3. Gas Pipeline Infrastructure Share Forecast, By Region (USD Billion)
- 4.1.4. Comparative Revenue Analysis, By Country, 2025 & 2035
- 4.1.5. Key Market Trends, Growth Factors, & Opportunities
- 4.1.6. Distribution Pipelines (Medium and Low-Pressure Urban & Suburban)
- 4.1.7. Gas Pipeline Infrastructure Share Forecast, By Region (USD Billion)
- 4.1.8. Comparative Revenue Analysis, By Country, 2025 & 2035
- 4.1.9. Key Market Trends, Growth Factors, & Opportunities
- 4.1.10. Gathering Pipelines (Field Collection Infrastructure)
- 4.1.11. Gas Pipeline Infrastructure Share Forecast, By Region (USD Billion)
- 4.1.12. Comparative Revenue Analysis, By Country, 2025 & 2035
- 4.1.13. Key Market Trends, Growth Factors, & Opportunities
- 4.1.14. Offshore Pipelines
- 4.1.15. Gas Pipeline Infrastructure Share Forecast, By Region (USD Billion)
- 4.1.16. Comparative Revenue Analysis, By Country, 2025 & 2035
- 4.1.17. Key Market Trends, Growth Factors, & Opportunities
- 4.1.18. Other Infrastructure Types (Interconnectors, Storage Connections)
- 4.1.19. Gas Pipeline Infrastructure Share Forecast, By Region (USD Billion)
- 4.1.20. Comparative Revenue Analysis, By Country, 2025 & 2035
- 4.1.21. Key Market Trends, Growth Factors, & Opportunities
- 4.1. Infrastructure Type Market Overview, By Infrastructure Type Segment
- Chapter 5. Gas Pipeline Infrastructure Market – By Material Type
- 5.1. Material Type Market Overview, By Material Type Segment
- 5.1.1. Gas Pipeline Infrastructure Market Revenue Share, By Material Type, 2025 & 2035
- 5.1.2. Steel (Carbon Steel, Alloy Steel, Stainless Steel)
- 5.1.3. Gas Pipeline Infrastructure Share Forecast, By Region (USD Billion)
- 5.1.4. Comparative Revenue Analysis, By Country, 2025 & 2035
- 5.1.5. Key Market Trends, Growth Factors, & Opportunities
- 5.1.6. Polyethylene (HDPE, MDPE, PE100, PE100-RC)
- 5.1.7. Gas Pipeline Infrastructure Share Forecast, By Region (USD Billion)
- 5.1.8. Comparative Revenue Analysis, By Country, 2025 & 2035
- 5.1.9. Key Market Trends, Growth Factors, & Opportunities
- 5.1.10. Composite Materials (Reinforced Thermoplastic Pipe, Fiber-Reinforced Polymer)
- 5.1.11. Gas Pipeline Infrastructure Share Forecast, By Region (USD Billion)
- 5.1.12. Comparative Revenue Analysis, By Country, 2025 & 2035
- 5.1.13. Key Market Trends, Growth Factors, & Opportunities
- 5.1.14. Ductile Iron & Cast Iron (Legacy and Replacement)
- 5.1.15. Gas Pipeline Infrastructure Share Forecast, By Region (USD Billion)
- 5.1.16. Comparative Revenue Analysis, By Country, 2025 & 2035
- 5.1.17. Key Market Trends, Growth Factors, & Opportunities
- 5.1.18. Other Material Types (Fiberglass, Flexible Pipe)
- 5.1.19. Gas Pipeline Infrastructure Share Forecast, By Region (USD Billion)
- 5.1.20. Comparative Revenue Analysis, By Country, 2025 & 2035
- 5.1.21. Key Market Trends, Growth Factors, & Opportunities
- 5.1. Material Type Market Overview, By Material Type Segment
- Chapter 6. Gas Pipeline Infrastructure Market – By Application
- 6.1. Application Market Overview, By Application Segment
- 6.1.1. Gas Pipeline Infrastructure Market Revenue Share, By Application, 2025 & 2035
- 6.1.2. Natural Gas (Transmission, Distribution, and Gathering)
- 6.1.3. Gas Pipeline Infrastructure Share Forecast, By Region (USD Billion)
- 6.1.4. Comparative Revenue Analysis, By Country, 2025 & 2035
- 6.1.5. Key Market Trends, Growth Factors, & Opportunities
- 6.1.6. Hydrogen (Dedicated and Repurposed Pipelines)
- 6.1.7. Gas Pipeline Infrastructure Share Forecast, By Region (USD Billion)
- 6.1.8. Comparative Revenue Analysis, By Country, 2025 & 2035
- 6.1.9. Key Market Trends, Growth Factors, & Opportunities
- 6.1.10. Biogas & Biomethane
- 6.1.11. Gas Pipeline Infrastructure Share Forecast, By Region (USD Billion)
- 6.1.12. Comparative Revenue Analysis, By Country, 2025 & 2035
- 6.1.13. Key Market Trends, Growth Factors, & Opportunities
- 6.1.14. Syngas & Industrial Gas
- 6.1.15. Gas Pipeline Infrastructure Share Forecast, By Region (USD Billion)
- 6.1.16. Comparative Revenue Analysis, By Country, 2025 & 2035
- 6.1.17. Key Market Trends, Growth Factors, & Opportunities
- 6.1.18. Other Applications
- 6.1.19. Gas Pipeline Infrastructure Share Forecast, By Region (USD Billion)
- 6.1.20. Comparative Revenue Analysis, By Country, 2025 & 2035
- 6.1.21. Key Market Trends, Growth Factors, & Opportunities
- 6.1. Application Market Overview, By Application Segment
- Chapter 7. Gas Pipeline Infrastructure Market – By Component
- 7.1. Component Market Overview, By Component Segment
- 7.1.1. Gas Pipeline Infrastructure Market Revenue Share, By Component, 2025 & 2035
- 7.1.2. Pipes & Tubes
- 7.1.3. Gas Pipeline Infrastructure Share Forecast, By Region (USD Billion)
- 7.1.4. Comparative Revenue Analysis, By Country, 2025 & 2035
- 7.1.5. Key Market Trends, Growth Factors, & Opportunities
- 7.1.6. Compressor Stations
- 7.1.7. Gas Pipeline Infrastructure Share Forecast, By Region (USD Billion)
- 7.1.8. Comparative Revenue Analysis, By Country, 2025 & 2035
- 7.1.9. Key Market Trends, Growth Factors, & Opportunities
- 7.1.10. Metering Stations & Measurement Equipment
- 7.1.11. Gas Pipeline Infrastructure Share Forecast, By Region (USD Billion)
- 7.1.12. Comparative Revenue Analysis, By Country, 2025 & 2035
- 7.1.13. Key Market Trends, Growth Factors, & Opportunities
- 7.1.14. Valves & Fittings
- 7.1.15. Gas Pipeline Infrastructure Share Forecast, By Region (USD Billion)
- 7.1.16. Comparative Revenue Analysis, By Country, 2025 & 2035
- 7.1.17. Key Market Trends, Growth Factors, & Opportunities
- 7.1.18. Cathodic Protection Systems
- 7.1.19. Gas Pipeline Infrastructure Share Forecast, By Region (USD Billion)
- 7.1.20. Comparative Revenue Analysis, By Country, 2025 & 2035
- 7.1.21. Key Market Trends, Growth Factors, & Opportunities
- 7.1.22. Pig Launchers & Receivers
- 7.1.23. Gas Pipeline Infrastructure Share Forecast, By Region (USD Billion)
- 7.1.24. Comparative Revenue Analysis, By Country, 2025 & 2035
- 7.1.25. Key Market Trends, Growth Factors, & Opportunities
- 7.1.26. Other Components (SCADA, Pressure Regulation)
- 7.1.27. Gas Pipeline Infrastructure Share Forecast, By Region (USD Billion)
- 7.1.28. Comparative Revenue Analysis, By Country, 2025 & 2035
- 7.1.29. Key Market Trends, Growth Factors, & Opportunities
- 7.1. Component Market Overview, By Component Segment
- Chapter 8. Gas Pipeline Infrastructure Market – By End-Use
- 8.1. End-Use Market Overview, By End-Use Segment
- 8.1.1. Gas Pipeline Infrastructure Market Revenue Share, By End-Use, 2025 & 2035
- 8.1.2. Power Generation
- 8.1.3. Gas Pipeline Infrastructure Share Forecast, By Region (USD Billion)
- 8.1.4. Comparative Revenue Analysis, By Country, 2025 & 2035
- 8.1.5. Key Market Trends, Growth Factors, & Opportunities
- 8.1.6. Industrial (Chemical, Fertilizer, Steel, Refining)
- 8.1.7. Gas Pipeline Infrastructure Share Forecast, By Region (USD Billion)
- 8.1.8. Comparative Revenue Analysis, By Country, 2025 & 2035
- 8.1.9. Key Market Trends, Growth Factors, & Opportunities
- 8.1.10. Residential & Commercial (Heating, Cooking)
- 8.1.11. Gas Pipeline Infrastructure Share Forecast, By Region (USD Billion)
- 8.1.12. Comparative Revenue Analysis, By Country, 2025 & 2035
- 8.1.13. Key Market Trends, Growth Factors, & Opportunities
- 8.1.14. Transportation (CNG, Gas-to-Liquids)
- 8.1.15. Gas Pipeline Infrastructure Share Forecast, By Region (USD Billion)
- 8.1.16. Comparative Revenue Analysis, By Country, 2025 & 2035
- 8.1.17. Key Market Trends, Growth Factors, & Opportunities
- 8.1.18. Other End-Uses
- 8.1.19. Gas Pipeline Infrastructure Share Forecast, By Region (USD Billion)
- 8.1.20. Comparative Revenue Analysis, By Country, 2025 & 2035
- 8.1.21. Key Market Trends, Growth Factors, & Opportunities
- 8.1. End-Use Market Overview, By End-Use Segment
- Chapter 9. Gas Pipeline Infrastructure Market – Regional Analysis
- 9.1. Gas Pipeline Infrastructure Market Overview, By Region Segment
- 9.1.1. Global Gas Pipeline Infrastructure Market Revenue Share, By Region, 2025 & 2035
- 9.1.2. Global Gas Pipeline Infrastructure Market Revenue, By Region, 2026 – 2035 (USD Billion)
- 9.1.3. Global Gas Pipeline Infrastructure Market Revenue, By Infrastructure Type, 2026 – 2035
- 9.1.4. Global Gas Pipeline Infrastructure Market Revenue, By Material Type, 2026 – 2035
- 9.1.5. Global Gas Pipeline Infrastructure Market Revenue, By Application, 2026 – 2035
- 9.1.6. Global Gas Pipeline Infrastructure Market Revenue, By Component, 2026 – 2035
- 9.1.7. Global Gas Pipeline Infrastructure Market Revenue, By End-Use, 2026 – 2035
- 9.2. North America
- 9.2.1. North America Gas Pipeline Infrastructure Market Revenue, By Country, 2026 – 2035 (USD Billion)
- 9.2.2. North America Gas Pipeline Infrastructure Market Revenue, By Infrastructure Type, 2026 – 2035
- 9.2.3. North America Gas Pipeline Infrastructure Market Revenue, By Material Type, 2026 – 2035
- 9.2.4. North America Gas Pipeline Infrastructure Market Revenue, By Application, 2026 – 2035
- 9.2.5. North America Gas Pipeline Infrastructure Market Revenue, By Component, 2026 – 2035
- 9.2.6. North America Gas Pipeline Infrastructure Market Revenue, By End-Use, 2026 – 2035
- 9.2.7. U.S. Gas Pipeline Infrastructure Market Revenue, 2026 – 2035 (USD Billion)
- 9.2.8. Canada Gas Pipeline Infrastructure Market Revenue, 2026 – 2035 (USD Billion)
- 9.2.9. Mexico Gas Pipeline Infrastructure Market Revenue, 2026 – 2035 (USD Billion)
- 9.2.10. Rest of North America Gas Pipeline Infrastructure Market Revenue, 2026 – 2035 (USD Billion)
- 9.3. Europe
- 9.3.1. Europe Gas Pipeline Infrastructure Market Revenue, By Country, 2026 – 2035 (USD Billion)
- 9.3.2. Europe Gas Pipeline Infrastructure Market Revenue, By Infrastructure Type, 2026 – 2035
- 9.3.3. Europe Gas Pipeline Infrastructure Market Revenue, By Material Type, 2026 – 2035
- 9.3.4. Europe Gas Pipeline Infrastructure Market Revenue, By Application, 2026 – 2035
- 9.3.5. Europe Gas Pipeline Infrastructure Market Revenue, By Component, 2026 – 2035
- 9.3.6. Europe Gas Pipeline Infrastructure Market Revenue, By End-Use, 2026 – 2035
- 9.3.7. Germany Gas Pipeline Infrastructure Market Revenue, 2026 – 2035 (USD Billion)
- 9.3.8. France Gas Pipeline Infrastructure Market Revenue, 2026 – 2035 (USD Billion)
- 9.3.9. U.K. Gas Pipeline Infrastructure Market Revenue, 2026 – 2035 (USD Billion)
- 9.3.10. Russia Gas Pipeline Infrastructure Market Revenue, 2026 – 2035 (USD Billion)
- 9.3.11. Italy Gas Pipeline Infrastructure Market Revenue, 2026 – 2035 (USD Billion)
- 9.3.12. Spain Gas Pipeline Infrastructure Market Revenue, 2026 – 2035 (USD Billion)
- 9.3.13. Netherlands Gas Pipeline Infrastructure Market Revenue, 2026 – 2035 (USD Billion)
- 9.3.14. Rest of Europe Gas Pipeline Infrastructure Market Revenue, 2026 – 2035 (USD Billion)
- 9.4. Asia Pacific
- 9.4.1. Asia Pacific Gas Pipeline Infrastructure Market Revenue, By Country, 2026 – 2035 (USD Billion)
- 9.4.2. Asia Pacific Gas Pipeline Infrastructure Market Revenue, By Infrastructure Type, 2026 – 2035
- 9.4.3. Asia Pacific Gas Pipeline Infrastructure Market Revenue, By Material Type, 2026 – 2035
- 9.4.4. Asia Pacific Gas Pipeline Infrastructure Market Revenue, By Application, 2026 – 2035
- 9.4.5. Asia Pacific Gas Pipeline Infrastructure Market Revenue, By Component, 2026 – 2035
- 9.4.6. Asia Pacific Gas Pipeline Infrastructure Market Revenue, By End-Use, 2026 – 2035
- 9.4.7. China Gas Pipeline Infrastructure Market Revenue, 2026 – 2035 (USD Billion)
- 9.4.8. Japan Gas Pipeline Infrastructure Market Revenue, 2026 – 2035 (USD Billion)
- 9.4.9. India Gas Pipeline Infrastructure Market Revenue, 2026 – 2035 (USD Billion)
- 9.4.10. New Zealand Gas Pipeline Infrastructure Market Revenue, 2026 – 2035 (USD Billion)
- 9.4.11. Australia Gas Pipeline Infrastructure Market Revenue, 2026 – 2035 (USD Billion)
- 9.4.12. South Korea Gas Pipeline Infrastructure Market Revenue, 2026 – 2035 (USD Billion)
- 9.4.13. Taiwan Gas Pipeline Infrastructure Market Revenue, 2026 – 2035 (USD Billion)
- 9.4.14. Rest of Asia Pacific Gas Pipeline Infrastructure Market Revenue, 2026 – 2035 (USD Billion)
- 9.5. The Middle-East and Africa
- 9.5.1. The Middle-East and Africa Gas Pipeline Infrastructure Market Revenue, By Country, 2026 – 2035 (USD Billion)
- 9.5.2. The Middle-East and Africa Gas Pipeline Infrastructure Market Revenue, By Infrastructure Type, 2026 – 2035
- 9.5.3. The Middle-East and Africa Gas Pipeline Infrastructure Market Revenue, By Material Type, 2026 – 2035
- 9.5.4. The Middle-East and Africa Gas Pipeline Infrastructure Market Revenue, By Application, 2026 – 2035
- 9.5.5. The Middle-East and Africa Gas Pipeline Infrastructure Market Revenue, By Component, 2026 – 2035
- 9.5.6. The Middle-East and Africa Gas Pipeline Infrastructure Market Revenue, By End-Use, 2026 – 2035
- 9.5.7. Saudi Arabia Gas Pipeline Infrastructure Market Revenue, 2026 – 2035 (USD Billion)
- 9.5.8. UAE Gas Pipeline Infrastructure Market Revenue, 2026 – 2035 (USD Billion)
- 9.5.9. Egypt Gas Pipeline Infrastructure Market Revenue, 2026 – 2035 (USD Billion)
- 9.5.10. Kuwait Gas Pipeline Infrastructure Market Revenue, 2026 – 2035 (USD Billion)
- 9.5.11. South Africa Gas Pipeline Infrastructure Market Revenue, 2026 – 2035 (USD Billion)
- 9.5.12. Rest of the Middle East & Africa Gas Pipeline Infrastructure Market Revenue, 2026 – 2035 (USD Billion)
- 9.6. Latin America
- 9.6.1. Latin America Gas Pipeline Infrastructure Market Revenue, By Country, 2026 – 2035 (USD Billion)
- 9.6.2. Latin America Gas Pipeline Infrastructure Market Revenue, By Infrastructure Type, 2026 – 2035
- 9.6.3. Latin America Gas Pipeline Infrastructure Market Revenue, By Material Type, 2026 – 2035
- 9.6.4. Latin America Gas Pipeline Infrastructure Market Revenue, By Application, 2026 – 2035
- 9.6.5. Latin America Gas Pipeline Infrastructure Market Revenue, By Component, 2026 – 2035
- 9.6.6. Latin America Gas Pipeline Infrastructure Market Revenue, By End-Use, 2026 – 2035
- 9.6.7. Brazil Gas Pipeline Infrastructure Market Revenue, 2026 – 2035 (USD Billion)
- 9.6.8. Argentina Gas Pipeline Infrastructure Market Revenue, 2026 – 2035 (USD Billion)
- 9.6.9. Rest of Latin America Gas Pipeline Infrastructure Market Revenue, 2026 – 2035 (USD Billion)
- 9.1. Gas Pipeline Infrastructure Market Overview, By Region Segment
- Chapter 10. Competitive Landscape
- 10.1. Company Market Share Analysis – 2025
- 10.1.1. Global Gas Pipeline Infrastructure Market: Company Market Share, 2025
- 10.2. Global Gas Pipeline Infrastructure Market Company Market Share, 2024
- 10.1. Company Market Share Analysis – 2025
- Chapter 11. Company Profiles
- 11.1. Tenaris S.A.
- 11.1.1. Company Overview
- 11.1.2. Key Executives
- 11.1.3. Product Portfolio
- 11.1.4. Financial Overview
- 11.1.5. Operating Business Segments
- 11.1.6. Business Performance
- 11.1.7. Recent Developments
- 11.2. TMK Group
- 11.3. Vallourec S.A.
- 11.4. Georg Fischer AG
- 11.5. Wavin (Orbia Advance Corporation)
- 11.6. Aliaxis S.A.
- 11.7. Aegion Corporation
- 11.8. EVRAZ plc
- 11.9. Nippon Steel Corporation
- 11.10. U.S. Steel Corporation
- 11.11. Shawflex (Anixter)
- 11.12. Others.
- 11.1. Tenaris S.A.
- Chapter 12. Research Methodology
- 12.1. Research Methodology
- 12.2. Secondary Research
- 12.3. Primary Research
- 12.3.1. Analyst Tools and Models
- 12.4. Research Limitations
- 12.5. Assumptions
- 12.6. Insights From Primary Respondents
- 12.7. Why Custom Market Insights
- Chapter 13. Standard Report Commercials & Add-Ons
- 13.1. Customization Options
- 13.2. Subscription Module For Market Research Reports
- 13.3. Client Testimonials
List Of Figures
Figures No 1 to 47
List Of Tables
Tables No 1 to 56
FAQs
The Global Gas Pipeline Infrastructure Market is forecasted to exhibit a very high growth because of the IEA that reported international investment in natural gas supply to the globe up to approximately USD 280 billion in 2023 creating a high baseline of gas infrastructure investment, the Russian invasion of Ukraine disrupting approximately 155 billion cubic meters of natural gas supply to Europe and causing a reaction of investing in energy security measures of the order of billions in infrastructure (including the EU REpowerEU plan incurring EUR 210 billion through 2027), the PNGRB having authorized CGD licenses covering approximately 98% of India’s geographic area representing an estimated USD 60 billion in cumulative gas distribution infrastructure investment, the European Hydrogen Backbone initiative projecting a 53,000 km hydrogen pipeline network by 2030 establishing Europe’s hydrogen infrastructure buildout as a multi-decade pipeline investment program, the United States operating approximately 3 million miles of natural gas pipelines with annual capital investment consistently exceeding USD 20 billion, PHMSA’s Gas Transmission and Gathering Rule driving compliance-driven integrity investment across approximately 500 U.S. jurisdictional transmission operators, and the Hydrogen Council estimating approximately 100,000 km of global hydrogen pipeline infrastructure required by 2050 representing investment in the hundreds of billions of dollars.
Asia Pacific will remain the highest market share region and highest growth rate at 8.1% CAGR throughout the forecast period due to the CGD expansion program plans of India which represent one of the largest gas distribution infrastructure development programs in the world, with over 2 million new household connections annually; China, with its ongoing expansion of transmission network linking new LNG import terminals and Central Asian pipeline gas to the expanding demand centers, Southeast Asian gas infrastructure development in Vietnam, Bangladesh, and Indonesia to the growing industrial and residential gas demand as well as Japan and South Korea, with their plans to expand their LNG import infrastructure expansion and connection pipeline investment; and Australia’s development of domestic gas gathering and transmission infrastructure serving both LNG export and east coast domestic demand markets.
The combination of India and China, the largest population of households first connected to piped gas, creating structurally new demand in distribution pipelines based on their connection to LNG imports as new users, and the developing gas infrastructure investment background of Southeast Asia means that the Asia Pacific will hold the highest revenue share during the forecast period, with an approximate 34% of the total global market share, based on their combination of the highest growth rates in gas infrastructure investment in the world, the largest population of new gas pipeline demand, and the next step in the national gas network growth program that China represents with its state-directed pipeline investment and India’s CGD authorization framework, growing LNG import terminal connection pipeline demand across Japan, South Korea, India, and China, and Southeast Asia’s developing gas infrastructure investment representing the next growth frontier after the South Asian CGD buildout matures.
According to existing analysis, by 2035 the market would reach around USD 38.14 billion due to the multi-decade implementation of European hydrogen backbone pipeline networks construction that accelerates throughout the forecast period as the industrial hydrogen demand in steel, chemical, and refining industries is realized, the construction of the CGD distribution network in India continued to bring its annual pipeline investment, North American oil pipeline modernization programs replacing the outdated cast iron and steel main pipes with polyethylene-pipe-based networks under regulatory requirements and the expanding environmental demands to limit methane emissions, the reduction requirements, U.S. and global LNG export capacity expansion requiring continued gathering and transmission infrastructure investment, digital pipeline monitoring and integrity management technology creating a growing services and equipment market alongside traditional pipe and component supply, Asia Pacific’s continued gas demand growth sustaining transmission network expansion investment, and the Hydrogen Council’s projected 100,000 km global hydrogen pipeline network by 2050 driving escalating hydrogen infrastructure construction through the forecast period and beyond, at a CAGR of 7.5% from 2026 to 2035.
Gas pipeline infrastructure investment is typified by large absolute capital outlay and long economic life of assets which require well-established long-run demand and support of the contract to warrant project financing. The cost of transmission pipeline constructions is also highly geography-dependent, terrain-dependent, and diameter of the pipe, as well as regulatory thresholds – in flat terrain, the approximate cost of the onshore pipeline construction is USD 0.5 to USD 1.5 million/km, whereas in mountainous or urban or sensitive areas to the environment routes the construction of the pipeline might cost USD 3 to USD 8 million/km. The cost of steel line pipe material is quite an important element of the capital cost of a transmission pipeline, and the price of API 5L X65 large-diameter pipe, at a wall thickness of 65 cm, varies between USD 800 and USD 1,800 per metric ton based on grade and market conditions, and the total cost of the material of the oil pipes used in a large 500 km long transmission pipeline may be USD 150 to USD 500 million, in accordance with the specifications and the market pricing at the time of acquisition The cost of construction of a distribution pipeline per unit length is lower than the cost of a transmission pipeline program, USD 50,000 – USD 500,000 per km depending on rural density, trenchless or trench installation, and pipe diameter, however, the length of urban distribution networks combined with high urban density results in aggregate investment costs comparable to the transmission pipeline programs. Most markets have general support for the economics of infrastructure investment in their regulated tariff structure of transmission and distribution pipelines which allows the infrastructure owners to get cost recovery plus a regulated rate of return on invested capital that helps to cushion the infrastructure owners against commodity price volatility and helps to give the revenue certainty that is required in the long-term financing of assets. The price premium of hydrogen compatible pipeline materials, which is around 15-22% higher than the natural gas service specifications based on published market data, will be a quantifiably higher cost factor in the construction of European hydrogen backbone pipelines, however, is likely to reduce as hydrogen pipeline construction volumes increase and supply chain specialization is attained during the forecast period.
The most significant force affecting patterns, timing and technical standards of gas pipeline infrastructure investment in the world is government regulations, which act through pipeline safety regulations, environmental regulations, energy security policies, and market access regulations as well as the financial structure and they set patterns of returns on pipeline investment across the value chain. The complete body of regulatory rules set by the U.S. Pipeline and Hazardous Materials Safety Administration, including the Gas Transmission and Gathering Rule, Distribution Integrity Management Program, and Control Room Management regulation, establishes the safety, monitoring, and integrity management requirements of U.S. gas pipeline operators and motivates the pipeline industry to invest substantial amounts of money in compliance. The Gas Security of Supply Regulation of the EU and the corresponding national emergency supply planning requirements are pushing the operators of European gas infrastructure to invest in supply diversification and interconnection infrastructure which enhances crisis response capacity – investment has been jump-started by the post-2022 energy security crisis. The EU updated Gas Regulation and Hydrogen Regulation are currently in the final stages of the process of becoming EU law to create the regulatory framework comprising access to the hydrogen pipeline network, setting of tariffs, and certification of hydrogen infrastructure investments in the European Hydrogen Backbone vision would be achieved by providing the investment confidence required by the private sector to invest in hydrogen pipeline infrastructure at the scale that is needed. Regulations on methane emissions such as the new methane rules by EPA in the United States and the EU Methane regulation – which enacts binding methane emissions intensity limits and leakage detection and repair requirements on operators of gas infrastructure globally—are acting to produce significant compliance-based investment in pipeline monitoring equipment, valve replacement and compressor station control of methane emissions in the global community of gas pipeline operators. Policies of national energy security such as the U.S. Natural Gas Security Policy, EU energy independence involvement, Indian national energy access initiatives, and Chinese efforts to secure gas infrastructure development, which under a purely market investment criterion would be commercially marginal, are driving sovereign capital towards the development of gas pipeline infrastructure that would be otherwise commercially marginal under purely market-driven investment criteria, to keep gas infrastructure development at levels above commercial viability in sensitive strategic management and diversification of supply applications.
The key players in the market are Tenaris S.A., TMK Group, Vallourec S.A., Georg Fischer AG, Wavin (Orbia Advanced Corporation), Aliaxis S.A., Aegion Corporation, EVRAZ plc, Nippon Steel Corporation, U.S. Steel Corporation, Shawflex (Anixter), Others.