Green Hydrogen Market Size, Trends and Insights By Technology (Alkaline Electrolyzer, PEM Electrolyzer, SOEC Electrolyzer), By Application (Power Generation, Transport, Others), By Distribution Channel (Pipeline, Cargo), and By Region - Global Industry Overview, Statistical Data, Competitive Analysis, Share, Outlook, and Forecast 2026 – 2035
Report Snapshot
| Study Period: | 2026-2035 |
| Fastest Growing Market: | Asia Pacific |
| Largest Market: | Europe |
Major Players
- Siemens Energy
- Nel ASA
- ITM Power
- Ballard Power Systems
- Others
Reports Description
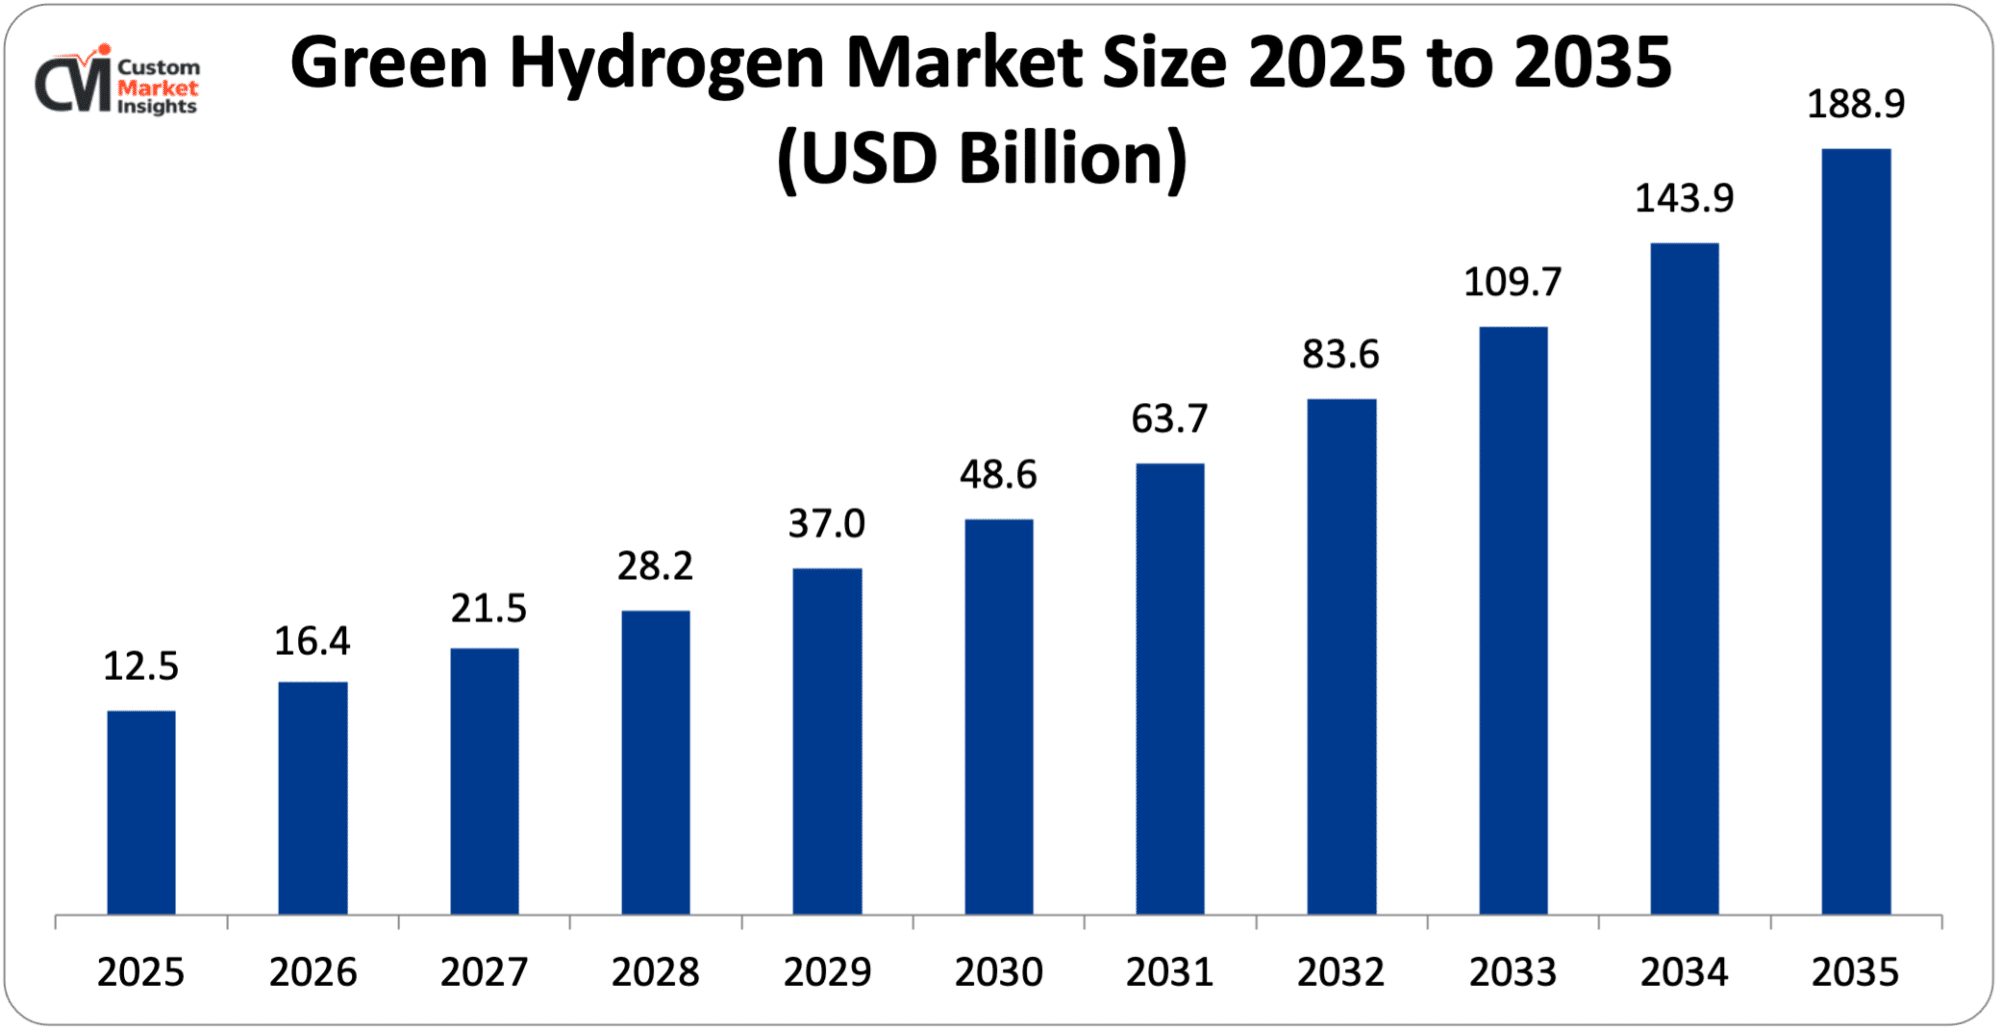
The market size of global green hydrogen will be estimated at USD 12.5 billion in 2025 and is expected to grow to between USD 16.4 billion in 2026 and about USD 188.9 billion by 2035, with a current CAGR (compound annual growth rate) of 31.2% during the period of 2026 to 2035. Green hydrogen is hydrogen gas produced from an environmentally friendly process with zero or almost zero carbon emissions. Green hydrogen itself is a clean energy source that is generally produced by an electrolysis process by splitting water (H₂O) into hydrogen and oxygen with an electric current from renewable power sources (Solar, Wind, Hydro).
Unlike traditional hydrogen production that is powered by fossil fuel with high emissions of CO₂, green hydrogen is regarded as a clean energy vector enabling the decarbonization of sectors that are hard to abate. Green hydrogen can be scaled and exported across the globe by storage and transportation to be used for power generation, industrial use, or fuel for moving a hydrogen fleet. Under pressure from climate change issues and global efforts led by the Paris agreement, green hydrogen is developing as one of the key players in the transition path to a resilient low-carbon energy system.
Market Highlight
- In 2025, Europe will dominate the global market with an estimated market share of 47%. The presence of major players and technological innovation drives the market growth.
- The Asia Pacific is growing at the highest rate over the analysis period. The increasing government initiative drives the regional growth.
- By technology, the alkaline electrolyzer segment dominated the industry in 2025 of over 60%.
- By application, the transport segment would have the highest share of the market in 2025 of over 44%.
- By distribution channel, the pipeline segment would have the highest share of the market in 2025 of more than 60%.
Significant Growth Factors
The green hydrogen market trends present significant growth opportunities due to several factors:
- Rising Decarbonization Goals And Climate Policies: Governments around the world are setting rigorous climate objectives toward minimizing carbon emissions, and several countries consider green hydrogen a solution to achieve those. Different policies and measures like those encouraging renewable energy, CO₂ taxation, and tax rebates on low-carbon technologies induce the demand for green hydrogen in different sectors such as transport. In this context in February 2024 UN Member States unanimously reached an agreement, adopting the ITC Strategy for the reduction of greenhouse gas (GHG) emissions in inland transport, a resolution that aims to smash the GHG emissions made by the transport sector that represent approximately 23% of annual emissions and 72% of all the transport emissions, which are 69% road, 2% inland shipping, and 1% railways. The trend of the growth of the demand for passenger transport and freight transport in 2050 will be 79% and 100%, respectively. Since it is a big contributor of carbon emissions, input of the inland transport sector to the climate endeavors must be accelerated and encouraged.
- Energy Security & Diversification: Energy security and diversification have emerged as major concerns for countries across the globe, and this factor has contributed significantly to the development of the green hydrogen market. Most countries are in dire need of imported fossil fuels, and this has led to concerns over security risks. Green hydrogen has emerged as a viable solution to cater to the energy needs of countries, and this has led to the development of the green hydrogen market. With green hydrogen, countries can produce their own energy and reduce their dependency on imported fuels. Abundant solar and wind resources are available, and countries can utilize green hydrogen to produce energy. The International Energy Agency has highlighted the potential of green hydrogen in reducing dependency on imported fuels, and countries can achieve energy security through the diversification of energy resources. This has led to the development of the green hydrogen market, and countries can produce their own energy, thus enhancing their energy security.
What are the Major Advances Changing the Green Hydrogen Market Today?
- Breakthroughs in Electrolyzer Technology: The progress of electrolyzer technology is, undoubtedly, the most optimistic new development for green hydrogen. An electrolyzer is an electrochemical cell that can split water into hydrogen and oxygen. The infrastructure of electrolyzers (which will be quantified later) is currently discovering technological revolutions in their efficiency and lifetime of use, with electrolyzer endeavors clearly aiming to commercialize green hydrogen. The breakthroughs in PEM, alkaline, and solid oxide electrolyzer technologies have led to advances in efficiency, reaction speed, and modularity of systems that can be tailored to intermittent sources of energy such as solar and wind. The leading developments of large-capacity modular systems from Siemens Energy and ITM Power have lowered energy demand and, consequently, operating costs; alongside reduced capital costs and the established expectation of a long lifetime, electrolyzers will become integral to green hydrogen.
- Advances in Storage & Transportation: The development of hydrogen storage and transportation is significantly contributing to the rapid development of the green hydrogen market by solving the biggest challenge associated with it, i.e., the safe, efficient, and affordable transport of hydrogen. Hydrogen is a low-density gas, making it hard to store or transport it over long distances, especially in its natural form. However, recent innovations have successfully addressed the challenges associated with hydrogen transport. For example, hydrogen can be transported by converting it to ammonia, which can then be easily transported over long distances. This is significantly contributing to the feasibility of hydrogen transport globally. In addition, hydrogen can be transported using compressed hydrogen, liquid hydrogen, or using other chemical carrier options. For example, hydrogen can be transported by converting it to ammonia, which can then be transported over long distances. This is significantly contributing to the feasibility of hydrogen transport globally. In addition, hydrogen can be transported using compressed hydrogen, liquid hydrogen, or using other chemical carrier options. For example, hydrogen can be transported by converting it to ammonia, which can then be transported over long distances. This is significantly contributing to the feasibility of hydrogen transport globally. In addition, hydrogen can be transported using compressed hydrogen, liquid hydrogen, or using other chemical carrier options. For example, hydrogen can be transported by converting it to ammonia, which can then be transported over long distances. This is significantly contributing to the feasibility of hydrogen transport globally. In addition, hydrogen can be transported using compressed hydrogen, liquid hydrogen, or using other chemical carrier options. For example, hydrogen can be transported by converting it to ammonia, which can then be transported over.
Category Wise Insights
By Technology
Why Alkaline Electrolyzer Hold a Prominent Position in the Market?
The alkaline electrolyzer segment dominated the industry in 2025 of over 60%. Alkaline electrolysis is one of the most mature commercially proven blueprints for the production of green hydrogen. Since it is commercially proven, alkaline electrolysis produces high reliability, longer operational life, and relatively lower installation costs compared to newer electrolyzer types. Widespread application of alkaline electrolysis to large industrial-scale hydrogen projects underscores the scalability and proven performance of the technology on commercial scales and the capability to align well with large-scale renewable power projects. Strong leveraging of alkaline electrolyzer technology for chemical processing, refining, and power-to-hydrogen markets and the enabling policies and subsidies directed toward renewable hydrogen infrastructure development cemented the alkaline electrolyzer as the dominant type in the hydrogen market.
The Solid Oxide Electrolyzer Cell (SOEC) segment is growing at the highest CAGR during the forecast period. The high operating temperatures of SOECs (Solid Oxide Electrolyzer Cells) allow much higher electrical efficiencies and potentially lower electricity requirements if linked to waste heat or industrial processes. The continuous emphasis on improving system efficiencies, reducing the capital cost and hence long-term hydrogen production costs, together with the desire to decarbonize the heavy industries (e.g. Steel and chemicals), should lead to a growing interest in SOEC electrolyzers. Innovations in materials, durability, and system integration and an increase in relevant pilot and demonstration projects are expected to further encourage the use of SOEC technology in the green hydrogen market.
By Application
Why Transport Capture the Highest Market Share in the Green Hydrogen Market?
The transport segment would have the highest share of the market in 2025 of over 44%. This can be explained by an increasing adoption of hydrogen being used as a zero-emissions fuel for all FCEV transport (cars, public transport buses, heavy-duty trucks, rail, and maritime). Green hydrogen, as a low-carbon fuel with a high energy density, is rapidly gaining traction in the sector due to its fast-refueling times, high mobility needs, and heavy-duty, long-distance transport stages of such rides that batteries cannot fulfill. The segment is further supported by government incentive schemes, ambitious emission reduction targets, and construction of hydrogen refueling infrastructure.
The power generation segment is growing at a steady rate over the projected period. The push toward cleaner and sustainable energy sources has increased the demand for green hydrogen for power production. As the world becomes increasingly reactive toward carbon emissions and the inevitable switch away from fossil fuels, green hydrogen is showing itself to be a viable option to power electricity, either into a fuel cell or mixed into natural gas, as a cleaner source of energy for power generation. This cleaner source of energy is especially advantageous for power generation as it synergistically can be used with other renewable sources of energy. The intermittent volatility of renewable energy sources has required a new medium of storing energy to compensate, and green hydrogen is also increasingly proving to be this form of energy, to be stored for later use when demand dictates.
By Distribution Channel
What Factor Causes Pipeline to Have a Dominant Position in the Tank Container Market?
The pipeline segment would have the highest share of the market in 2025 of more than 60%. Pipeline-based distribution is the most favored option for a large and continuous supply of hydrogen due to its cost efficiency, safety, and ease of transportation of large quantities of hydrogen at longer distances. This mode of distribution finds the most effective use for industrial clusters, hydrogen hubs, and areas of existing gas pipeline networks for efficient integration of green hydrogen into refineries, chemicals, and power plants. Increasing flow of investments toward dedicated hydrogen pipelines and the conversion of natural gas pipelines is expected to accentuate the dominance of the pipeline segment.
The cargo segment is growing at a rapid rate over the projected period. A cargo-based option (beyond potential piped transportation to a local industrial cluster) is gaining momentum (liquefied hydrogen and hydrogen carriers like ammonia and LOHCs), primarily for long-distance, international trade. Growing number of cross-border green hydrogen projects; higher demand for imports from regions with less availability of relevant resources (solar, wind, etc.), and growing maritime export-import infrastructure are all fueling a rapid expansion in this segment. Increased efficiency in liquefaction, storage, and shipping infrastructure and equipment also make it increasingly attractive.
Report Scope
| Feature of the Report | Details |
| Market Size in 2026 | USD 16.4 billion |
| Projected Market Size in 2035 | USD 188.9 billion |
| Market Size in 2025 | USD 12.5 billion |
| CAGR Growth Rate | 31.2% CAGR |
| Base Year | 2025 |
| Forecast Period | 2026-2035 |
| Key Segment | By Technology, Application, Distribution Channel and Region |
| Report Coverage | Revenue Estimation and Forecast, Company Profile, Competitive Landscape, Growth Factors and Recent Trends |
| Regional Scope | North America, Europe, Asia Pacific, Middle East & Africa, and South & Central America |
| Buying Options | Request tailored purchasing options to fulfil your requirements for research. |
Regional Analysis
How Big is Europe Green Hydrogen Market Size?
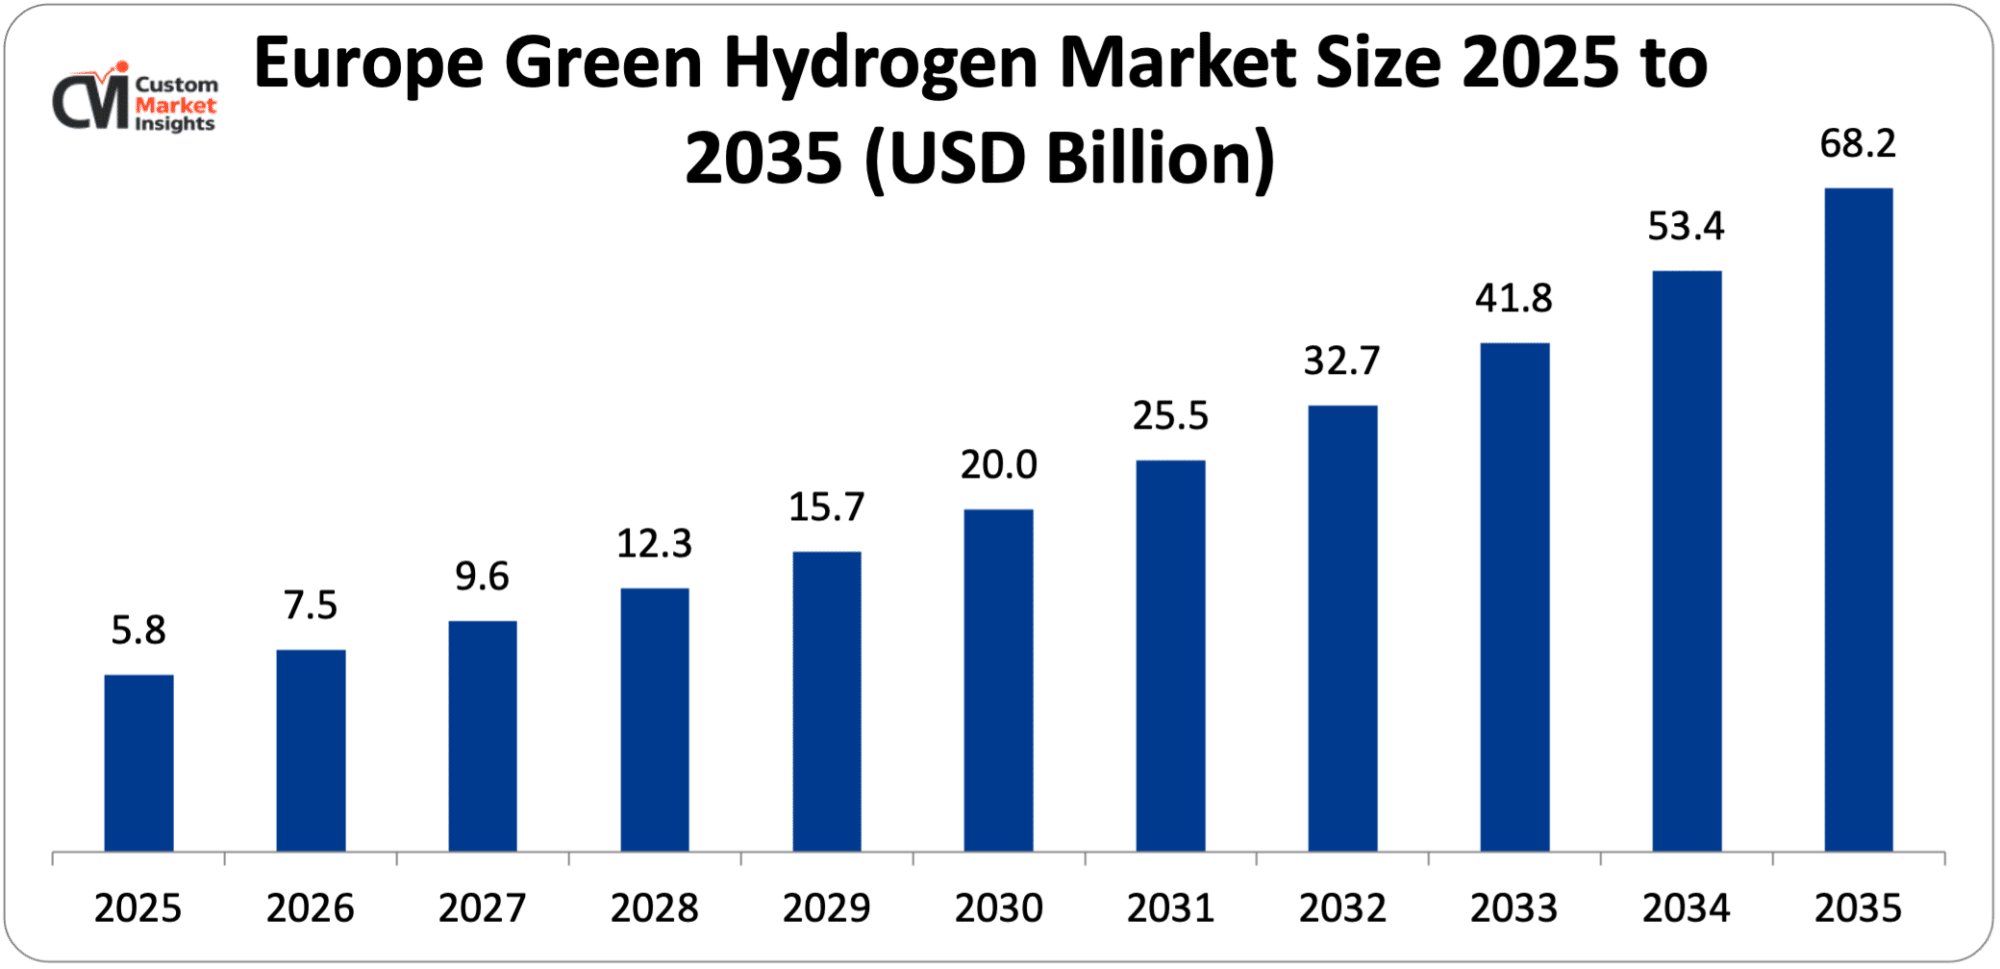
Its market size, in terms of European green hydrogen, is projected to be USD 5.8 billion in 2025 with a growth of about USD 68.2 billion in 2035 with a CAGR of 27.8% between 2026 and 2035.
Why did Europe Dominate the Green Hydrogen Market in 2025?
In 2025, Europe will dominate the global market with an estimated market share of 47%. This role as a front-runner in the hydrogen economy is driven by ambitious decarbonization goals, sound policy & regulation, and integrated hydrogen strategies across the EU and all of its member states. To unlock market expansion, electricity & electrolyzer capacity ramp-up, renewable energy retrofit, and hydrogen backbone infrastructure across the other side of the coin, the likes of Germany, France, the Netherlands, and Spain are emerging with billions of Euros of investment, while the industrial, mobility, and power-to-x momentum stay resilient.
Germany Green Hydrogen Market Trends
In the European region, Germany leads the industry expansion over the projected period. The increasing auction activity in the area drives the market growth. For instance, in February 2025, ENERTRAG, a leading renewable energy and green hydrogen producer company, launched a public auction for 500 tons of green hydrogen at E-World 2025.
Why is North America Experiencing a Significant Growth in the Green Hydrogen Market?
North America holds a significant market share in 2025. The growing investment in clean energy infrastructure, hydrogen hubs, and industrial decarbonization projects is driving this trend. Interceding demand from transportation, refineries, and electricity generation is prompting adoption while robust federal and state policies are strengthening market viability. The region is experiencing fast implementation of large electrolysis projects & hydrogen refueling stations predominantly in North America.
US Green Hydrogen Market Trends
The US held the dominant position in the market in 2025. The growth is attributed to several factors, such as increasing government initiatives and increasing investment in low-carbon technology.
Why is the Asia Pacific Growing at a Highest CAGR in the Green Hydrogen Market?
The Asia Pacific is expected to grow at the highest CAGR over the projected period. Fast-paced industrialization, increasing energy demand, and robust government commitments towards decarbonizing the energy sector drive this increase. Within Asia, globally prominent nations such as China, Japan, South Korea, Australia, and India are making significant investments in the green hydrogen segment, electrolyzer manufacturing, and hydrogen infrastructure development for commercial industry decarbonization and clean mobility. Few national hydrogen roadmaps, subsidies, and pilot projects for hydrogen-based commercial transportation and power plants are supporting the large-scale adoption.
India Green Hydrogen Market Trends
India holds the prominent market share in the industry. The growing investment in green technology drives the industry growth.
Why is the Middle East & Africa Region is growing rapidly in the Green Hydrogen?
The MEA region is growing at a steady rate over the projected period. This expansion is largely enabled by the on-site availability of renewable resources, proactive government policies, and surging worldwide fuel demand. Countries like the Kingdom of Saudi Arabia and the United Arab Emirates are channeling billions of dollars to develop mega-green hydrogen projects, utilizing the region‘s extensive solar and wind resources to produce low-cost green hydrogen, which is already at cost parity to conventional fuels. Prominent projects such as NEOM, are bringing the region‘s green hydrogen & ammonia industry to the world‘s forefront.
UAE Green Hydrogen Market Trends
The UAE is growing at the highest CAGR during the forecast period. The growth is owing to the rising investment in green hydrogen and growing technological advancements.
Top Players in the Green Hydrogen Market and Their Offerings
- Siemens Energy
- Nel ASA
- ITM Power
- Ballard Power Systems
- Plug Power
- McPhy Energy
- Air Products and Chemicals Inc.
- Air Liquide
- Linde plc
- Engie
- Mitsubishi Power
- Cummins Inc.
- Thyssenkrupp Nucera
- Enapter
- Green Hydrogen Systems
- Others
Key Developments
Green hydrogen market has experienced considerable changes in the last two years as the market players are trying to diversify their technological aspects and develop product portfolio using strategic approaches.
- In February 2025, Evonik is building a pilot plant in Marl, Germany, for the production of its innovative and high-performance anion exchange membrane (AEM). Developed by Evonik, the membrane is marketed under the name DURAION®. A central element in AEM water electrolysis, DURAION® membranes enable the cost competitive production of green hydrogen. Evonik is investing a low double-digit million euro amount in the AEM plant, which is scheduled to go online at the end of 2025.
- In June 2025, At SNEC 2025, Sungrow Hydrogen and Wison Engineering made waves in the green energy sector by jointly launching MegaFlex “Plant-as-a-Product” – a turnkey solution that reshapes green hydrogen production. Featuring MW-to-GW scalability and fully outdoor modular design, this system overcomes traditional indoor plant limitations while enabling faster deployment and lower costs, setting new standards for the hydrogen economy worldwide.
These strategic measures have enabled the companies to reinforce their competitive positions, increase the product line, boost their technological competencies and also seize growth opportunities in the fast-growing green hydrogen market.
The Green Hydrogen Market is segmented as follows:
By Technology
- Alkaline Electrolyzer
- PEM Electrolyzer
- SOEC Electrolyzer
By Application
- Power Generation
- Transport
- Others
By Distribution Channel
- Pipeline
- Cargo
Regional Coverage:
North America
- U.S.
- Canada
- Mexico
- Rest of North America
Europe
- Germany
- France
- U.K.
- Russia
- Italy
- Spain
- Netherlands
- Rest of Europe
Asia Pacific
- China
- Japan
- India
- New Zealand
- Australia
- South Korea
- Taiwan
- Rest of Asia Pacific
The Middle East & Africa
- Saudi Arabia
- UAE
- Egypt
- Kuwait
- South Africa
- Rest of the Middle East & Africa
Latin America
- Brazil
- Argentina
- Rest of Latin America
Table of Contents
- Chapter 1. Report Introduction
- 1.1. Report Description
- 1.1.1. Purpose of the Report
- 1.1.2. USP & Key Offerings
- 1.2. Key Benefits For Stakeholders
- 1.3. Target Audience
- 1.4. Report Scope
- 1.1. Report Description
- Chapter 2. Market Overview
- 2.1. Report Scope (Segments And Key Players)
- 2.1.1. Green Hydrogen by Segments
- 2.1.2. Green Hydrogen by Region
- 2.2. Executive Summary
- 2.2.1. Market Size & Forecast
- 2.2.2. Green Hydrogen Market Attractiveness Analysis, By Technology
- 2.2.3. Green Hydrogen Market Attractiveness Analysis, By Application
- 2.2.4. Green Hydrogen Market Attractiveness Analysis, By Distribution Channel
- 2.1. Report Scope (Segments And Key Players)
- Chapter 3. Market Dynamics (DRO)
- 3.1. Market Drivers
- 3.1.1. Rising Decarbonization Goals And Climate Policies
- 3.1.2. Energy Security & Diversification
- 3.2. Market Restraints
- 3.3. Market Opportunities
- 3.5. Pestle Analysis
- 3.6. Porter Forces Analysis
- 3.7. Technology Roadmap
- 3.8. Value Chain Analysis
- 3.9. Government Policy Impact Analysis
- 3.10. Pricing Analysis
- 3.1. Market Drivers
- Chapter 4. Green Hydrogen Market – By Technology
- 4.1. Technology Market Overview, By Technology Segment
- 4.1.1. Green Hydrogen Market Revenue Share, By Technology, 2025 & 2035
- 4.1.2. Alkaline Electrolyzer
- 4.1.3. Green Hydrogen Share Forecast, By Region (USD Billion)
- 4.1.4. Comparative Revenue Analysis, By Country, 2025 & 2035
- 4.1.5. Key Market Trends, Growth Factors, & Opportunities
- 4.1.6. PEM Electrolyzer
- 4.1.7. Green Hydrogen Share Forecast, By Region (USD Billion)
- 4.1.8. Comparative Revenue Analysis, By Country, 2025 & 2035
- 4.1.9. Key Market Trends, Growth Factors, & Opportunities
- 4.1.10. SOEC Electrolyzer
- 4.1.11. Green Hydrogen Share Forecast, By Region (USD Billion)
- 4.1.12. Comparative Revenue Analysis, By Country, 2025 & 2035
- 4.1.13. Key Market Trends, Growth Factors, & Opportunities
- 4.1. Technology Market Overview, By Technology Segment
- Chapter 5. Green Hydrogen Market – By Application
- 5.1. Application Market Overview, By Application Segment
- 5.1.1. Green Hydrogen Market Revenue Share, By Application, 2025 & 2035
- 5.1.2. Power Generation
- 5.1.3. Green Hydrogen Share Forecast, By Region (USD Billion)
- 5.1.4. Comparative Revenue Analysis, By Country, 2025 & 2035
- 5.1.5. Key Market Trends, Growth Factors, & Opportunities
- 5.1.6. Transport
- 5.1.7. Green Hydrogen Share Forecast, By Region (USD Billion)
- 5.1.8. Comparative Revenue Analysis, By Country, 2025 & 2035
- 5.1.9. Key Market Trends, Growth Factors, & Opportunities
- 5.1.10. Others
- 5.1.11. Green Hydrogen Share Forecast, By Region (USD Billion)
- 5.1.12. Comparative Revenue Analysis, By Country, 2025 & 2035
- 5.1.13. Key Market Trends, Growth Factors, & Opportunities
- 5.1. Application Market Overview, By Application Segment
- Chapter 6. Green Hydrogen Market – By Distribution Channel
- 6.1. Distribution Channel Market Overview, By Distribution Channel Segment
- 6.1.1. Green Hydrogen Market Revenue Share, By Distribution Channel, 2025 & 2035
- 6.1.2. Pipeline
- 6.1.3. Green Hydrogen Share Forecast, By Region (USD Billion)
- 6.1.4. Comparative Revenue Analysis, By Country, 2025 & 2035
- 6.1.5. Key Market Trends, Growth Factors, & Opportunities
- 6.1.6. Cargo
- 6.1.7. Green Hydrogen Share Forecast, By Region (USD Billion)
- 6.1.8. Comparative Revenue Analysis, By Country, 2025 & 2035
- 6.1.9. Key Market Trends, Growth Factors, & Opportunities
- 6.1. Distribution Channel Market Overview, By Distribution Channel Segment
- Chapter 7. Green Hydrogen Market – Regional Analysis
- 7.1. Green Hydrogen Market Overview, By Region Segment
- 7.1.1. Global Green Hydrogen Market Revenue Share, By Region, 2025 & 2035
- 7.1.2. Global Green Hydrogen Market Revenue, By Region, 2026 – 2035 (USD Billion)
- 7.1.3. Global Green Hydrogen Market Revenue, By Technology, 2026 – 2035
- 7.1.4. Global Green Hydrogen Market Revenue, By Application, 2026 – 2035
- 7.1.5. Global Green Hydrogen Market Revenue, By Distribution Channel, 2026 – 2035
- 7.2. North America
- 7.2.1. North America Green Hydrogen Market Revenue, By Country, 2026 – 2035 (USD Billion)
- 7.2.2. North America Green Hydrogen Market Revenue, By Technology, 2026 – 2035
- 7.2.3. North America Green Hydrogen Market Revenue, By Application, 2026 – 2035
- 7.2.4. North America Green Hydrogen Market Revenue, By Distribution Channel, 2026 – 2035
- 7.2.5. U.S. Green Hydrogen Market Revenue, 2026 – 2035 (USD Billion)
- 7.2.6. Canada Green Hydrogen Market Revenue, 2026 – 2035 (USD Billion)
- 7.2.7. Mexico Green Hydrogen Market Revenue, 2026 – 2035 (USD Billion)
- 7.2.8. Rest of North America Green Hydrogen Market Revenue, 2026 – 2035 (USD Billion)
- 7.3. Europe
- 7.3.1. Europe Green Hydrogen Market Revenue, By Country, 2026 – 2035 (USD Billion)
- 7.3.2. Europe Green Hydrogen Market Revenue, By Technology, 2026 – 2035
- 7.3.3. Europe Green Hydrogen Market Revenue, By Application, 2026 – 2035
- 7.3.4. Europe Green Hydrogen Market Revenue, By Distribution Channel, 2026 – 2035
- 7.3.5. Germany Green Hydrogen Market Revenue, 2026 – 2035 (USD Billion)
- 7.3.6. France Green Hydrogen Market Revenue, 2026 – 2035 (USD Billion)
- 7.3.7. U.K. Green Hydrogen Market Revenue, 2026 – 2035 (USD Billion)
- 7.3.8. Russia Green Hydrogen Market Revenue, 2026 – 2035 (USD Billion)
- 7.3.9. Italy Green Hydrogen Market Revenue, 2026 – 2035 (USD Billion)
- 7.3.10. Spain Green Hydrogen Market Revenue, 2026 – 2035 (USD Billion)
- 7.3.11. Netherlands Green Hydrogen Market Revenue, 2026 – 2035 (USD Billion)
- 7.3.12. Rest of Europe Green Hydrogen Market Revenue, 2026 – 2035 (USD Billion)
- 7.4. Asia Pacific
- 7.4.1. Asia Pacific Green Hydrogen Market Revenue, By Country, 2026 – 2035 (USD Billion)
- 7.4.2. Asia Pacific Green Hydrogen Market Revenue, By Technology, 2026 – 2035
- 7.4.3. Asia Pacific Green Hydrogen Market Revenue, By Application, 2026 – 2035
- 7.4.4. Asia Pacific Green Hydrogen Market Revenue, By Distribution Channel, 2026 – 2035
- 7.4.5. China Green Hydrogen Market Revenue, 2026 – 2035 (USD Billion)
- 7.4.6. Japan Green Hydrogen Market Revenue, 2026 – 2035 (USD Billion)
- 7.4.7. India Green Hydrogen Market Revenue, 2026 – 2035 (USD Billion)
- 7.4.8. New Zealand Green Hydrogen Market Revenue, 2026 – 2035 (USD Billion)
- 7.4.9. Australia Green Hydrogen Market Revenue, 2026 – 2035 (USD Billion)
- 7.4.10. South Korea Green Hydrogen Market Revenue, 2026 – 2035 (USD Billion)
- 7.4.11. Taiwan Green Hydrogen Market Revenue, 2026 – 2035 (USD Billion)
- 7.4.12. Rest of Asia Pacific Green Hydrogen Market Revenue, 2026 – 2035 (USD Billion)
- 7.5. The Middle-East and Africa
- 7.5.1. The Middle-East and Africa Green Hydrogen Market Revenue, By Country, 2026 – 2035 (USD Billion)
- 7.5.2. The Middle-East and Africa Green Hydrogen Market Revenue, By Technology, 2026 – 2035
- 7.5.3. The Middle-East and Africa Green Hydrogen Market Revenue, By Application, 2026 – 2035
- 7.5.4. The Middle-East and Africa Green Hydrogen Market Revenue, By Distribution Channel, 2026 – 2035
- 7.5.5. Saudi Arabia Green Hydrogen Market Revenue, 2026 – 2035 (USD Billion)
- 7.5.6. UAE Green Hydrogen Market Revenue, 2026 – 2035 (USD Billion)
- 7.5.7. Egypt Green Hydrogen Market Revenue, 2026 – 2035 (USD Billion)
- 7.5.8. Kuwait Green Hydrogen Market Revenue, 2026 – 2035 (USD Billion)
- 7.5.9. South Africa Green Hydrogen Market Revenue, 2026 – 2035 (USD Billion)
- 7.5.10. Rest of the Middle East & Africa Green Hydrogen Market Revenue, 2026 – 2035 (USD Billion)
- 7.6. Latin America
- 7.6.1. Latin America Green Hydrogen Market Revenue, By Country, 2026 – 2035 (USD Billion)
- 7.6.2. Latin America Green Hydrogen Market Revenue, By Technology, 2026 – 2035
- 7.6.3. Latin America Green Hydrogen Market Revenue, By Application, 2026 – 2035
- 7.6.4. Latin America Green Hydrogen Market Revenue, By Distribution Channel, 2026 – 2035
- 7.6.5. Brazil Green Hydrogen Market Revenue, 2026 – 2035 (USD Billion)
- 7.6.6. Argentina Green Hydrogen Market Revenue, 2026 – 2035 (USD Billion)
- 7.6.7. Rest of Latin America Green Hydrogen Market Revenue, 2026 – 2035 (USD Billion)
- 7.1. Green Hydrogen Market Overview, By Region Segment
- Chapter 8. Competitive Landscape
- 8.1. Company Market Share Analysis – 2025
- 8.1.1. Global Green Hydrogen Market: Company Market Share, 2025
- 8.2. Global Green Hydrogen Market Company Market Share, 2024
- 8.1. Company Market Share Analysis – 2025
- Chapter 9. Company Profiles
- 9.1. Siemens Energy
- 9.1.1. Company Overview
- 9.1.2. Key Executives
- 9.1.3. Product Portfolio
- 9.1.4. Financial Overview
- 9.1.5. Operating Business Segments
- 9.1.6. Business Performance
- 9.1.7. Recent Developments
- 9.2. Nel ASA
- 9.3. ITM Power
- 9.4. Ballard Power Systems
- 9.5. Plug Power
- 9.6. McPhy Energy
- 9.7. Air Products and Chemicals Inc.
- 9.8. Air Liquide
- 9.9. Linde plc
- 9.10. Engie
- 9.11. Mitsubishi Power
- 9.12. Cummins Inc.
- 9.13. Thyssenkrupp Nucera
- 9.14. Enapter
- 9.15. Green Hydrogen Systems
- 9.16. Others.
- 9.1. Siemens Energy
- Chapter 10. Research Methodology
- 10.1. Research Methodology
- 10.2. Secondary Research
- 10.3. Primary Research
- 10.3.1. Analyst Tools and Models
- 10.4. Research Limitations
- 10.5. Assumptions
- 10.6. Insights From Primary Respondents
- 10.7. Why Custom Market Insights
- Chapter 11. Standard Report Commercials & Add-Ons
- 11.1. Customization Options
- 11.2. Subscription Module For Market Research Reports
- 11.3. Client Testimonials
List Of Figures
Figures No 1 to 24
List Of Tables
Tables No 1 to 46
Prominent Players
- Siemens Energy
- Nel ASA
- ITM Power
- Ballard Power Systems
- Plug Power
- McPhy Energy
- Air Products and Chemicals Inc.
- Air Liquide
- Linde plc
- Engie
- Mitsubishi Power
- Cummins Inc.
- Thyssenkrupp Nucera
- Enapter
- Green Hydrogen Systems
- Others
FAQs
The key players in the market are Siemens Energy, Nel ASA, ITM Power, Ballard Power Systems, Plug Power, McPhy Energy, Air Products and Chemicals Inc., Air Liquide, Linde plc, Engie, Mitsubishi Power, Cummins Inc., Thyssenkrupp Nucera, Enapter, Green Hydrogen Systems, Others.
Government regulations play a crucial role in shaping the green hydrogen market by establishing policy frameworks, providing subsidies and incentives, setting carbon reduction targets, and funding infrastructure development, which collectively reduce investment risks and accelerate large-scale adoption.
The price point significantly impacts market growth and adoption, as high production costs of green hydrogen currently limit large-scale uptake, while declining costs through technological advancements and subsidies are accelerating its competitiveness with fossil-based hydrogen.
According to the present analysis and forecast modeling, the market of green hydrogen will witness a significant growth of about USD 188.9 billion in the year 2035 with the growing innovative product launch, increasing collaboration, and growing government initiatives for green technology with a CAGR of 31.2% between the years 2026 and 2035.
It is projected that Europe will hold the largest market share in the green hydrogen market in the forecast period, with a share of about 47% of the global market share, which is attributed to the presence of major players and increasing investment in advanced technology.
The Asia Pacific is expected to grow at the highest rate during the forecast period. The growth in the region is owing to the increasing investment by the government.
The green hydrogen market is primarily driven by global decarbonization goals, falling renewable energy costs, supportive government policies, technological advancements in electrolyzers, and rising demand for clean energy across industries and transportation sectors.