Methane Monitoring Market Size, Trends and Insights By Component (Hardware, Software, Services), By Technology (Remote Sensing, Optical Gas Imaging, Laser-based Detection, Satellite Monitoring, UAV/Drone-based Monitoring, Others), By Application (Oil & Gas, Agriculture, Waste Management, Mining, Others), By End-User (Industrial, Commercial, Government, Others), and By Region - Global Industry Overview, Statistical Data, Competitive Analysis, Share, Outlook, and Forecast 2026 – 2035
Report Snapshot
CAGR: 7.9%
| Study Period: | 2026-2035 |
| Fastest Growing Market: | Asia Pacific |
| Largest Market: | North America |
Major Players
- GHGSat
- Kairos Aerospace
- ExxonMobil
- Shell
- Others
Reports Description
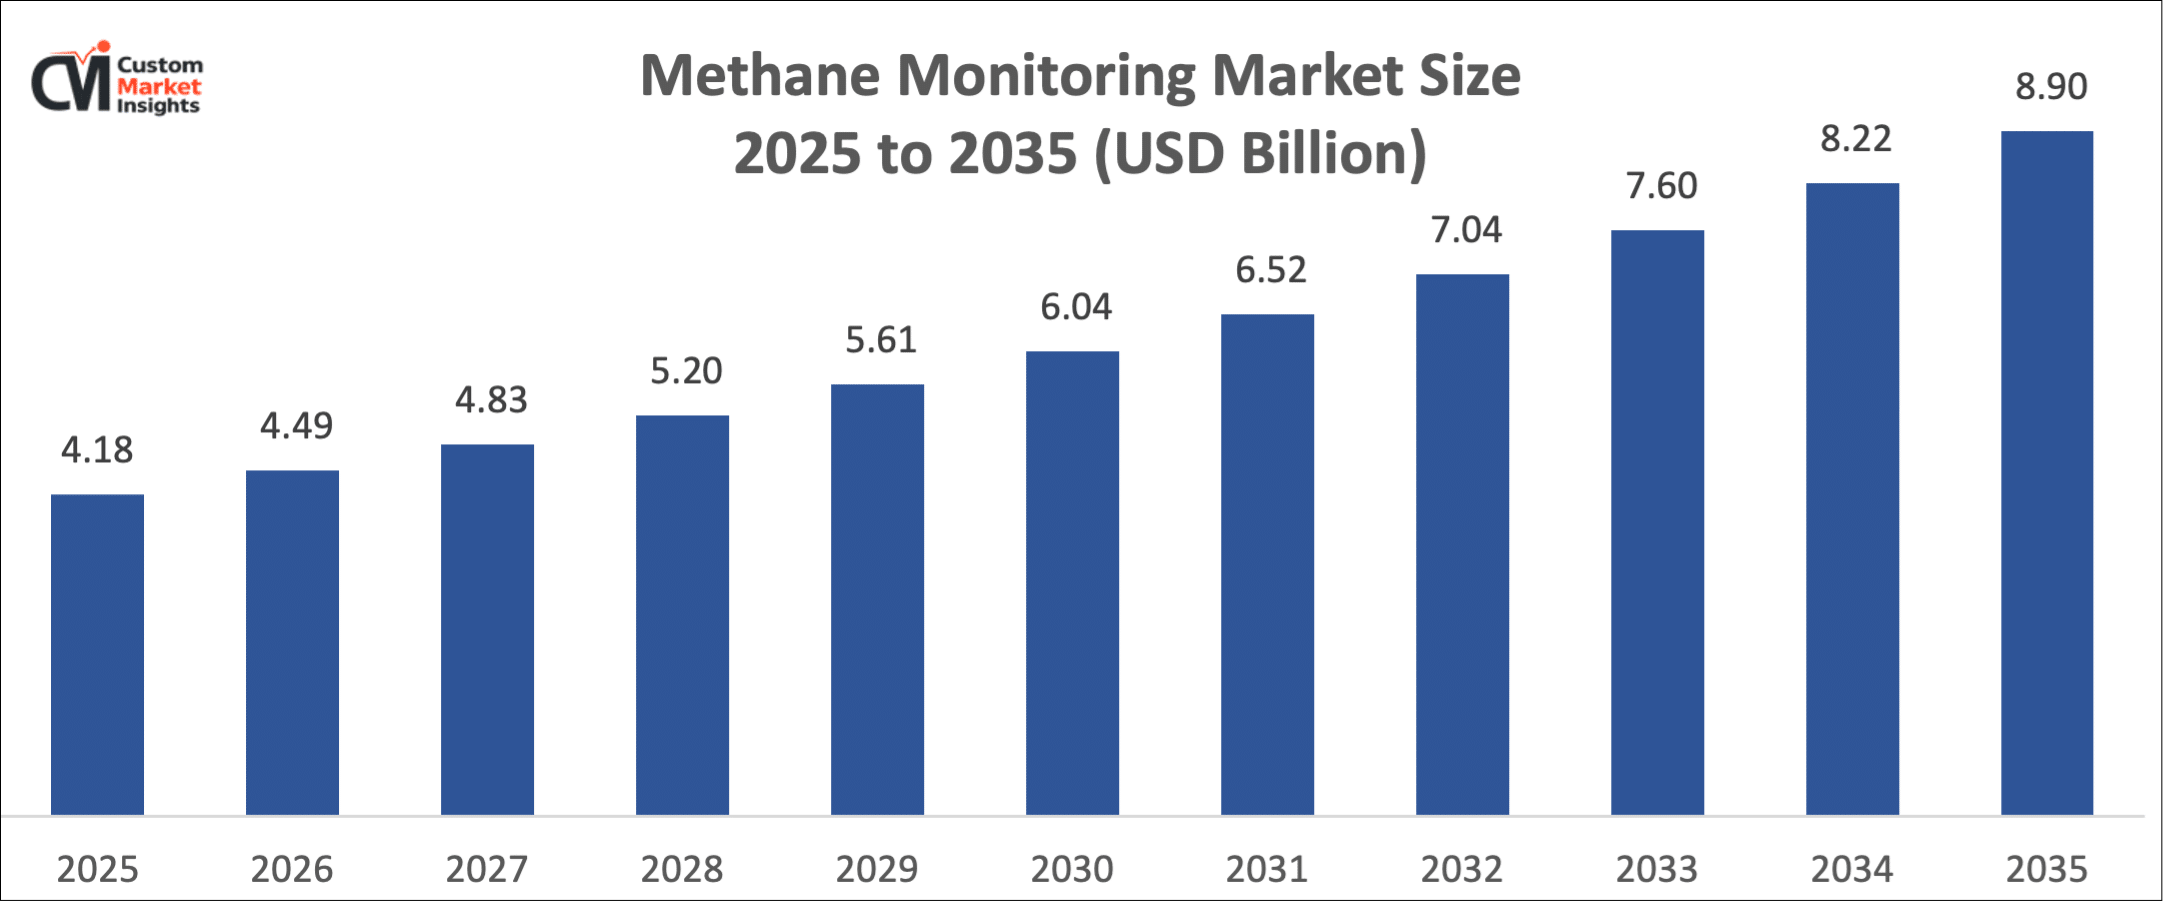
Methane monitoring market is projected to be USD 4.49 billion in the year 2026, USD 8.90 billion in the year 2035 and at a projected CAGR of 7.9% between the years 2026 and 2035. The market development is mostly facilitated by the increase in interest in reducing methane emissions in the world given their contribution to climate change. International climate initiatives, governments, and environmental agencies are also implementing tougher detection and reporting regulations of methane in industries. Oil and gas, waste management, agriculture, and energy production are some of the sectors where more sophisticated methane monitoring technologies are being applied, which include satellite-based technologies, ground sensors, and the use of drone-based technologies, among others, to detect leaks, enhance operational performance, and complement decarbonization and sustainability promises.
Market Highlight
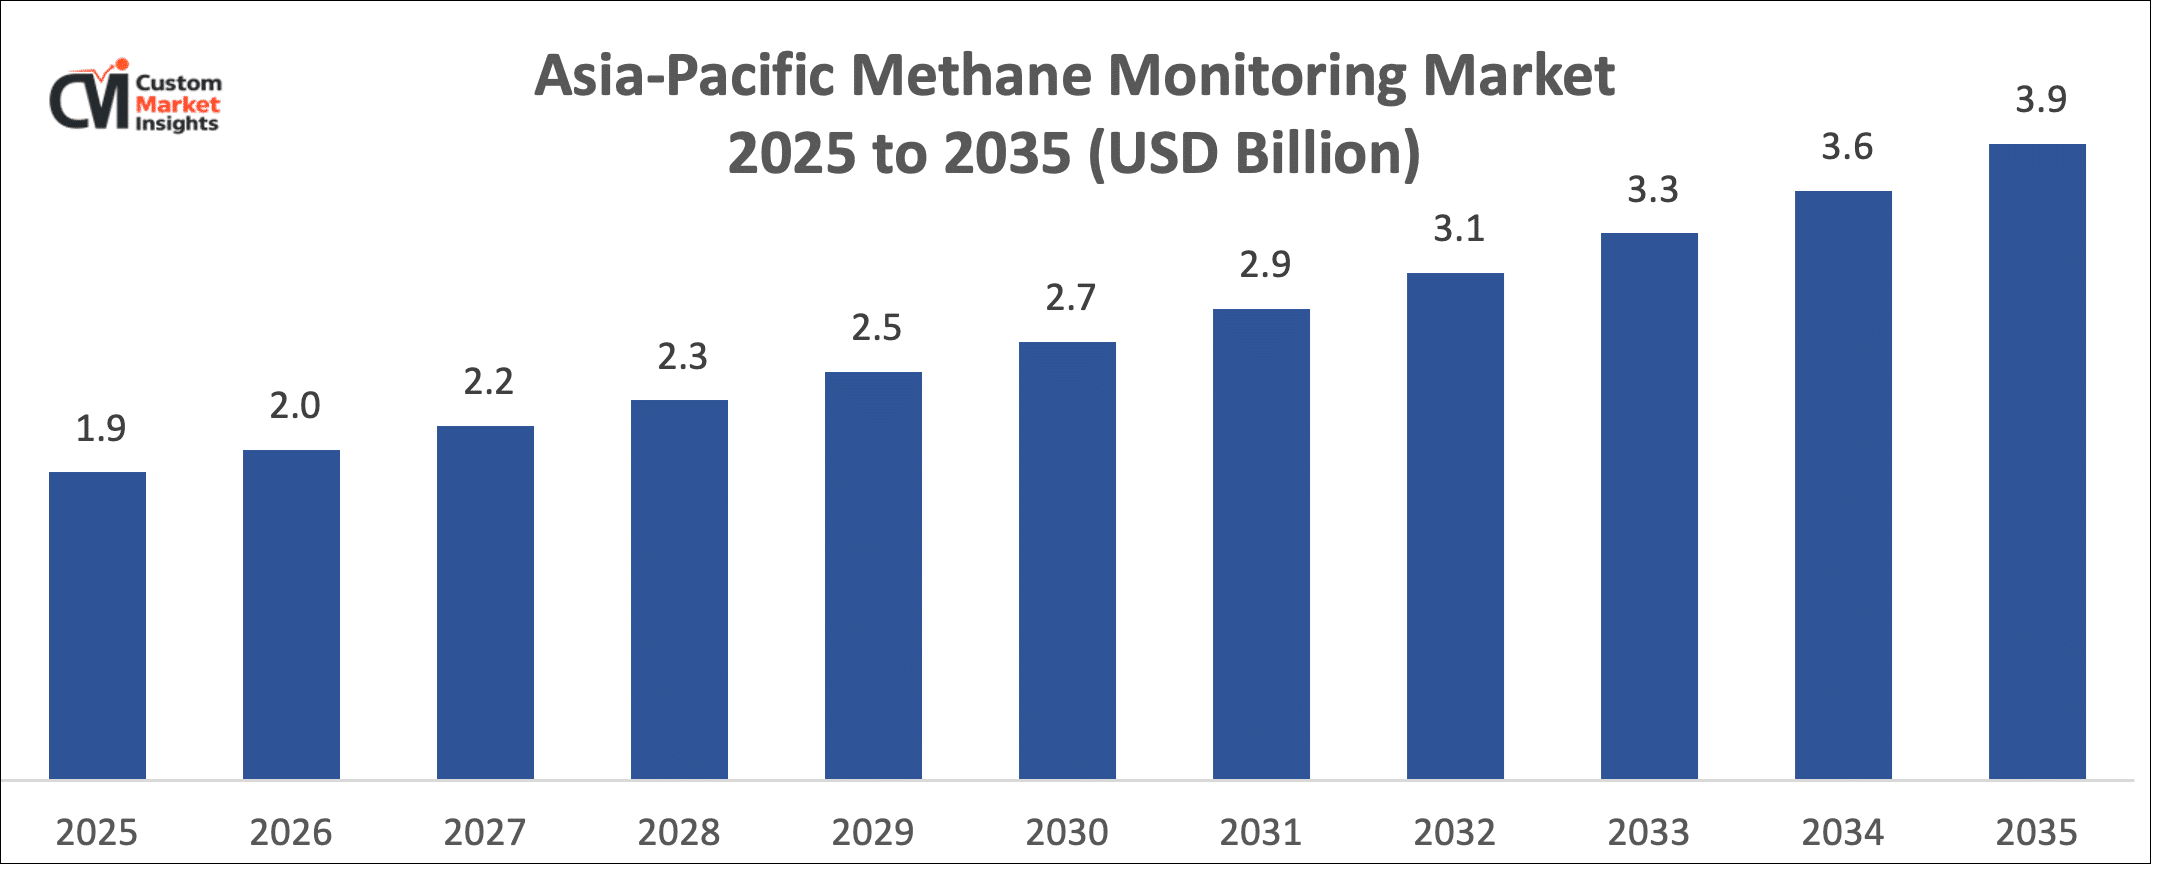
- Asia Pacific was the market leader of methane monitoring with a 45% market share in 2025.
- North America will grow by 8.3% in the period between 2026 and 2035.
- The Hardware segment had taken over 65% of the market share in 2025 by component.
- By Technology, Satellite Monitoring segment will experience the highest CAGR of 8.2% between 2026 and 2035.
- Application-wise, the Oil & Gas segment will be the largest market share of 45.6% in 2025
Significant Growth Factors
The Methane Monitoring Market Trends present significant growth opportunities due to several factors:
- Expanding International Methane Reduction Pledges: The rising international pledges to cut methane emissions are boosting the calls to methane monitoring technologies to a large extent. One of the strongest greenhouse gases is methane, and it is seen to have a warming potential that is approximately more than 80 times that of carbon dioxide within a 20 year time span. The International Energy Agency reported that the global energy sector emitted more than 120 million tonnes of methane in 2023, which is why more vigorous monitoring and mitigation measures are necessary. The international programs, like the Global Methane Pledge, are intended to cut down on the emissions of methane by at least 30 percent of the current levels by 2030. To meet these targets, the correct identification and reporting of methane emissions are necessary, and this is compelling the use of advanced methane monitoring technologies in all industrial sectors.
- Situating Demand Leak Detection in Oil and Gas Industry: The oil and gas industry is among the biggest contributors to global methane emissions through the leaks witnessed in production plants, pipelines, storage tanks, and processing plants. The oil and gas industry, according to the International Energy Agency, is the source of approximately 40 percent of the human-related methane emissions in the world. Another one is the fact that about 75 percent of all methane gas escaping oil and gas activities can be captured through the available techniques. The regulatory authorities of the key energy producing nations are thus coming up with more stringent monitoring conditions to check and avoid leakages. Consequently, energy firms are incorporating innovative methane detection technologies, including infrared gas imaging cameras, fixed monitoring systems, and mobile detection systems, as a measure to enhance leak detection and minimize environmental effects.
- Increased Embracement of Satellite, Drone, and Remote Sensing Solutions: Technological change is enhancing the efficiency of methane monitoring significantly by the adoption of satellite monitoring, drones, and high-end remote sensing. Methane plumes in extensive geographic regions can be detected using satellite technologies, and large sources of emissions can be identified with high precision. The United Nations Environment Programme has already noted, using satellite monitoring platforms, that hundreds of major events of methane emissions are already being detected in the world every year, especially through oil and gas infrastructure and landfills. Drones are also becoming more and more popular in the inspection of pipelines and industrial facilities, which allows the leakage to be detected sooner than on the ground. These modern surveillance systems enable the governments and businesses to monitor the levels of methane emissions at vast scales, making the process much more efficient in environmental monitoring and making it possible to act more rapidly.
What are the single Biggest Developments Reshaping the Methane monitoring market Today?
- Global Methane Reduction Regulations: Governments and international environmental agencies are coming up with stricter methane emission regulations to counter climate change and air pollution. Methane is approximated to contribute approximately 30 percent of global warming since the period before industrialization and, therefore, is a key subject of climate policy. The regulatory systems have now established rules that compel producers of energy, waste management sites, and agricultural activities to track and record the emission of methane more precisely. Some of the efforts being made include the Global Methane Pledge, which urges the nations to cut down the emission of methane by 2030 by a considerable margin. Such regulatory developments are pushing industries to seek the latest technologies in methane monitoring that can detect, measure, and report methane leakage in large and complex facilities of operation.
- Quick Innovation of Satellite-based Methane Detection Technology: Satellite surveillance is changing the situation in methane monitoring as it allows detection of methane emissions in large geographic regions on a large scale. The modern earth-observation satellites now have the capability of detecting the methane plumes of the industrial facilities, pipelines, landfills, and agricultural activities with high accuracy. Satellite missions that will allow organizations to monitor the environment through the provision of precise methane emissions information are being sponsored by organizations like the European Space Agency and the National Aeronautics and Space Administration. Such technologies help governments and businesses to detect the sources of emissions previously not identified and enhance environmental reporting. Due to the increasing access to satellite data, methane monitoring is transforming by making it possible to detect it with increased speed as well as verify the effectiveness of emission reductions.
- Investing More in Industry in Leak Detection and Repair Systems: Industry and energy companies are investing more in methane leak detection and repair (LDAR) programs to mitigate emissions and enhance energy efficiency in their operations. Oil and gas alone emit tens of millions of tonnes of methane each year, the majority of which is caused by equipment spillage and inefficiency in operation. With the implementation of hi-tech methane tracking devices (infrared cameras, fixed gas sensors, drone-based inspection systems, etc.), businesses can detect any leaks very fast and fix them prior to their development. The investments also assist organizations in satisfying the regulatory requirements besides minimizing product losses and enhancing safety. With the reduction of methane becoming a strategic focus of energy companies, the investments in continuous monitoring and leak-detecting technologies become more and more common.
-
Modern Methane Monitoring Systems Are Beginning To Integrate Artificial Intelligence And Data Analytics Into The Monitoring Systems: The contemporary systems of methane monitoring are becoming more and more integrated with digital technologies, including artificial intelligence (AI), machine learning, and sophisticated data analytics, to enhance detection accuracy and efficiency in the systems. Because AI-facilitated platforms are capable of working with massive amounts of data on the environment, it is possible to detect patterns of emissions and anomalies and predict possible leaks before they happen. It is also through these intelligent monitoring systems that automated reporting and remote system diagnostics can be achieved, and therefore the manual inspections are minimized. With the method of digital transformation and the use of smart infrastructure technologies in the industries, the incorporation of AI-driven analytics is turning out to be a significant trend that is determining the market of methane monitoring, enriching real-time monitoring features and opportunities to manage the environment on a more active basis.
Category Wise Insights
By Component
Why is Hardware the Market Leader?
The largest portion of the market to monitor methane is hardware, as methane detection involves special devices like gas sensors, one of the cameras of infrared, laser analyzers, and satellite-linked devices of detection that are spread out in the industrial infrastructures. The use of monitoring equipment is the key to identifying the leaks of methane over oil fields, pipelines, landfills, and agricultural plants. It is approximated that around 610 million tonnes of methane are released into the atmosphere every year, and human activities are the cause of about two-thirds of total emissions, which has led to a high need for proper detection equipment. Also, the energy sector alone is a major contributor to human-induced methane gas emissions of more than 35 percent, and there is a need to implement large-scaled hardware deployment to carry out continuous monitoring over industrial establishments. The high volume of emissions involves numerous sensors and monitoring equipment in several locations of work, which intensifies the domination of hardware in terms of revenue distribution.
Why is Software the Fastest-Growing Segment?
Software is becoming the most rapidly developing part in the methane monitoring market since the present-day monitoring systems produce considerable amounts of environmental data, which need to be processed, analyzed, and reported in real-time. Digital monitoring systems enable businesses to visualize the emission data, identify any abnormal emission patterns, and automate the reporting of the regulatory compliance. The global climate assessments have found that since the Industrial Revolution, methane emissions have contributed approximately 30% of the global temperature increase, which shows the significance of proper monitoring and reporting systems. Due to this, firms are shifting to cloud-based environmental management software and AI-enhanced analytics platforms to process sensor, drone, satellite, and sensor-collected data on methane monitoring. The increasing demand for ESG reporting and computerized environment compliance is further fuelling the need to use smart monitoring software programs.
By Technology
Why is Optical Gas Imaging the Market Leader?
Optical gas imaging (OGI) has become a very popular technique in monitoring methane since the technique allows prompt visualization of leaks of methane without necessarily having to touch the industrial machinery. Such systems normally involve the infrared cameras that have the ability to capture the methane gas plumes that cannot be seen by the human eye. This is especially necessary in oil and gas plants, where leakages may be witnessed throughout pipelines, compressor stations, and storage tanks. In 2023, the oil and gas industry was the biggest contributor of more than 78 million tonnes of methane, which is why leak cleaning technologies have become essential to lower the emission levels. OGI technology enables operators to scan big facilities fast and detect the presence of leaks during regular checks to enhance efficiency in maintenance and adherence to the environment.
Why are Satellite Monitoring the Fastest-Growing Segment?
Satellite monitoring is rapidly transforming the methane monitoring market because it allows emissions to be detected across large geographic areas that traditional ground monitoring systems cannot easily cover. Satellite technologies can identify methane plumes from oil fields, pipelines, landfills, and industrial sites with increasing precision. Global methane emissions are estimated at around 610 million tonnes annually, and many emissions originate from large industrial clusters or remote energy production areas.
By Application
Why is Oil & Gas the Largest Application Segment?
The oil and gas industry is the largest application area in the methane monitoring market since it is among the main sources of methane emissions in the world. Methane leakages are experienced in the processes of drilling, processing, transportation, and storage of natural gas. Approximately 40 percent of all human-generated methane emissions are attributed to the global energy sector, and a sizeable portion of these emissions is associated with oil and gas operations. These leaks do not only lead to climate change but also are a source of losses to the energy companies, as the major part of the natural gas is methane. With governments enacting tougher measures on methane emissions and the energy companies undertaking to reduce their emissions by a set amount, the use of modern methane monitoring devices both in upstream, midstream, and downstream operations is on the rise.
Why is Waste Management the Fastest-Growing Application Segment?
The growing production of municipal solid waste and organic waste in the world is making waste management one of the fastest-growing areas of methane monitoring applications. Landfill sites contribute significantly to methane emissions because organic waste that decomposes in anaerobic conditions in landfills produces methane. The ground-level ozone also forms as a result of methane emissions and can result in about one million premature deaths every year because of air pollution, and therefore the role of emission monitoring and control should not be underestimated. Governments are also placing landfill gas monitoring laws and promoting methane capture to use in the generation of energy. With the rise in urban populations and the growth of wastes in the world today, it is time to consider the use of methane monitoring technologies so that landfill emissions can be managed and help in providing sustainable waste management techniques.
By End Use
Why is Industrial Sector the Largest Segment?
The industrial sector has the highest proportion of methane monitoring demand due to the high rate at which most of the industries produce and consume energy, thus emitting methane. Oil and gas, chemical manufacturing, mining, and energy production are some of the industries that have intricate infrastructure, and leaks of methane can be experienced in many points of operation. The energy sector alone contains methane emissions of approximately 145 million tonnes every year throughout the whole world, comprising a large portion of human-induced emissions of methane. This is the reason why industrial operators use monitoring technologies to identify leaks at their initial stage, enhance the safety of their operations, and guarantee the adherence to environmental standards. With the growing interest of companies in sustainability plans and carbon reduction when pursuing these plans, industrial demands for methane monitoring systems keep rising.
Why is Government the Fastest-Growing Segment?
As the government organizations intensify the regulation of the environment and the mitigation of climate change, the use of methane monitoring technologies is becoming increasingly significant. Methane monitoring systems help governments monitor the emissions of industrial facilities, agricultural production, and waste management facilities. Methane gas contributes approximately 17-25 percent of the total global greenhouse gas emissions, thus being an important subject of environmental policy across the world. National strategies and environmental surveillance programs are also being launched by many countries to fulfill climate obligations. Such projects need enormous monitoring facilities, such as satellite surveillance systems and local observation systems. The government as a significant end-user of methane monitoring technologies is also growing in number as governments are investing heavily in environmental monitoring and the enforcement of climate policies.
Report Scope
| Feature of the Report | Details |
| Market Size in 2026 | USD 4.49 billion |
| Projected Market Size in 2035 | USD 8.90 billion |
| Market Size in 2025 | USD 4.18 billion |
| CAGR Growth Rate | 7.9% CAGR |
| Base Year | 2025 |
| Forecast Period | 2026-2035 |
| Key Segment | By Component, Technology, Application, End-User and Region |
| Report Coverage | Revenue Estimation and Forecast, Company Profile, Competitive Landscape, Growth Factors and Recent Trends |
| Regional Scope | North America, Europe, Asia Pacific, Middle East & Africa, and South & Central America |
| Buying Options | Request tailored purchasing options to fulfil your requirements for research. |
Regional Analysis
Why did Asia Pacific Dominate the Market in 2025?
In 2025, the Asia-Pacific region controlled most of the market on methane monitoring because of its vast industrial base and also the ever-increasing energy consumption. The top 10 countries like China and India contribute more than 35 percent of the total emission of greenhouse gases in the world, and as a result, monitoring of methane gas has become a key environmental concern. Over 50 percent of the world’s coal production is also produced in the region and is one of the largest contributors of methane emissions through mining activities. Asian-pacific governments are tightening environmental laws and launching programs to cut methane emissions as a way of dealing with climate issues. These policies will necessitate the use of advanced methods of monitoring leakage of methane by industries that are able to detect leakage of methane in energy infrastructure, industrial plants, and waste management facilities.
China Market Trends
China is one of the biggest markets to monitor the use of methane because of the nature of industrial activities and the presence of the huge energy production sector. The nation contributes to about 27-30% of the total production in the world’s manufacturing, and as such, there is a heightened demand on environmental monitoring in heavy industries, including the production of steel, chemicals, and cement. China is also a major coal producer in the world, and coal mines are a significant source of methane emissions. In order to overcome the problem of environmental issues, the government has introduced strict air pollution control programs, and the government has pledged to have carbon neutrality in the year 2060. Such efforts are pushing industries to implement highly innovative methane monitoring systems, such as remote sensing systems and automated environmental monitoring systems.
Why is North America Experiencing Steady Growth?
The market in methane monitoring is steadily increasing in North America as a result of robust regulatory systems and developed environmental monitoring systems. The present power generation in the region generates more than 900 million metric tons of CO₂ annually, and this has necessitated the strict monitoring of energy facilities in terms of emission. Also, the North American oil and gas sector is among the largest in the world and has been the cause of a high level of methane emissions through production and pipeline networks. Regulatory agencies and governments are enforcing more stringent requirements on the detection of methane leakages, and companies are being encouraged to use more advanced methods to detect such leakages, like infrared imaging cameras and drones as well as satellite detection methods.
What is the Size of the U.S. Market?
In the U.S., the market size of methane monitoring is estimated at USD 840.2 million in the year 2025 and is anticipated to grow at an accelerating rate of 8.2% between the years 2026 and 2035.
U.S. Market Trends
The United States has a considerable portion of the world’s demand for methane-monitoring technologies because of its high energy industries and high environmental policies. The emission of greenhouse gases in the country is more than 4 billion metric tons per year, establishing a powerful necessity of monitoring and emission decrease efforts. Energy companies in the United States have been mandated by regulatory regimes of the United States Environmental Protection Agency to adopt methane leakage and repair measures. Also, the U.S. has over 7,000 power generation plants, most of which demand environmental monitoring technologies to facilitate adherence to the rules of emissions.
Why is Europe Focusing on Sustainability and Efficiency?
One of the major markets in the methane monitoring industry is Europe since it has very good environmental policies and ambitious climate objectives. One of the climate policy frameworks in the region is to curb greenhouse gas emissions by 55 percent of the 1990 level by 2030. More than 10,000 large industrial facilities operating in Europe are also covered by stringent monitoring and reporting requirements of emissions. The trend of investing more in renewable energy and carbon capture technologies as well as environmental monitoring infrastructure is compelling industries to consider adopting sophisticated methane monitoring systems that will enhance compliance and environmental transparency.
Germany Market Trends
Germany has become one of the top markets in Europe in terms of monitoring of methane because of a high industrial base and environmental regulations. Germany contributes approximately a quarter of total industrial output in Europe, with some of the key industries in that country being chemicals, steel, car manufacturing, and energy production. The nation has over 400 large industrial emission facilities, most of which have to have continuous monitoring systems to be in agreement with the environmental regulations. In Germany, there are also some ambitious climate policies that can be followed to reach a net-zero level of emissions in 2045.
Why is the Middle East & Africa Region Experiencing Growth?
There is an increasing need in the Middle East and Africa region to adopt methane monitoring technologies, and this is because of the growing oil and gas production in the region and the growing awareness of the environment. The Middle East takes almost a third of the total global crude oil production, with countries like Saudi Arabia and the United Arab Emirates boasting large-scale refining and petrochemical plants to produce methane. To monitor these facilities, they need sophisticated monitoring systems to identify leakages and ensure that the environment is not defiled as well, some African nations are growing mining and energy industries that are contributing to methane emissions during the industrial processes. The governments of the region are slowly tightening environmental laws, and this move is likely to increase the use of methane monitoring devices.
Top Players in the Market and Their Offerings
- GHGSat
- Kairos Aerospace
- ExxonMobil
- Shell
- Chevron
- BP
- TotalEnergies
- Sierra Instruments
- ABB Ltd.
- FLIR Systems
- Picarro Inc.
- Bridger Photonics
- Rebellion Photonics
- Honeywell International Inc.
- Siemens AG
- Envirosuite
- SeekOps Inc.
- OptaSense (a Luna company)
- Teledyne Technologies
- SENSIA Solutions
- Others
Key Developments
The methane monitoring market is undergoing fast innovation in technology and augmenting strategic partnerships as organizations look at enhancing methane leak detection, emission transparency, and regulatory conformity. Businesses are also working on high-tech surveillance systems like satellite monitors, drones, laser spectroscopy systems, and AI-based data analytics systems to enhance the accuracy of methane measurements in large industries and energy infrastructure.
- In March 2025, GHGSat put into space an advanced methane-detection satellite that is meant to detect small methane leakages in oil and gas infrastructure with high spatial resolution. The satellite will allow the energy operators and environmental regulators to track the emission of methane in the world and enhance leakage detection in the pipelines, production plants, and industrial locations.
- In April 2025, Honeywell International introduced a new laser-based methane detection solution designed for continuous monitoring of industrial facilities. The technology uses tunable diode laser spectroscopy to detect methane concentrations with high accuracy, enabling energy and manufacturing companies to quickly identify leaks and comply with strict environmental monitoring regulations.
- In February 2025, the European Space Agency increased its satellite-based methane monitoring programs with the increased use of Earth-observation schemes that would monitor global methane emissions in landfills, oil and gas fields, and agricultural areas. The project is expected to give governments and industries credible data on emissions to help in climate policy formulation and to help reduce methane.
These trends reveal the growing attention to the use of satellite monitoring, AI-based analytics, and a sophisticated set of sensors in methane monitoring systems. It is anticipated that in the forecast period, the integration of methane monitoring technologies in energy, agricultural, and waste sectors will have a rapid pace due to continuous development in accuracy of detection, automated emission reporting, and large-scale environmental surveillance.
The Methane Monitoring Market is segmented as follows:
By Component
- Hardware
- Software
- Services
By Technology
- Remote Sensing
- Optical Gas Imaging
- Laser-based Detection
- Satellite Monitoring
- UAV/Drone-based Monitoring
- Others
By Application
- Oil & Gas
- Agriculture
- Waste Management
- Mining
- Others
By End-User
- Industrial
- Commercial
- Government
- Others
Regional Coverage:
North America
- U.S.
- Canada
- Mexico
- Rest of North America
Europe
- Germany
- France
- U.K.
- Russia
- Italy
- Spain
- Netherlands
- Rest of Europe
Asia Pacific
- China
- Japan
- India
- New Zealand
- Australia
- South Korea
- Taiwan
- Rest of Asia Pacific
The Middle East & Africa
- Saudi Arabia
- UAE
- Egypt
- Kuwait
- South Africa
- Rest of the Middle East & Africa
Latin America
- Brazil
- Argentina
- Rest of Latin America
Table of Contents
- Chapter 1. Report Introduction
- 1.1. Report Description
- 1.1.1. Purpose of the Report
- 1.1.2. USP & Key Offerings
- 1.2. Key Benefits For Stakeholders
- 1.3. Target Audience
- 1.4. Report Scope
- 1.1. Report Description
- Chapter 2. Market Overview
- 2.1. Report Scope (Segments And Key Players)
- 2.1.1. Methane Monitoring by Segments
- 2.1.2. Methane Monitoring by Region
- 2.2. Executive Summary
- 2.2.1. Market Size & Forecast
- 2.2.2. Methane Monitoring Market Attractiveness Analysis, By Component
- 2.2.3. Methane Monitoring Market Attractiveness Analysis, By Technology
- 2.2.4. Methane Monitoring Market Attractiveness Analysis, By Application
- 2.2.5. Methane Monitoring Market Attractiveness Analysis, By End-User
- 2.1. Report Scope (Segments And Key Players)
- Chapter 3. Market Dynamics (DRO)
- 3.1. Market Drivers
- 3.1.1. Expanding International Methane Reduction Pledges
- 3.1.2. Situating Demand Leak Detection in Oil and Gas Industry
- 3.1.3. Increased Embracement of Satellite, Drone, and Remote Sensing Solutions
- 3.2. Market Restraints
- 3.3. Market Opportunities
- 3.5. Pestle Analysis
- 3.6. Porter Forces Analysis
- 3.7. Technology Roadmap
- 3.8. Value Chain Analysis
- 3.9. Government Policy Impact Analysis
- 3.10. Pricing Analysis
- 3.1. Market Drivers
- Chapter 4. Methane Monitoring Market – By Component
- 4.1. Component Market Overview, By Component Segment
- 4.1.1. Methane Monitoring Market Revenue Share, By Component, 2025 & 2035
- 4.1.2. Hardware
- 4.1.3. Methane Monitoring Share Forecast, By Region (USD Billion)
- 4.1.4. Comparative Revenue Analysis, By Country, 2025 & 2035
- 4.1.5. Key Market Trends, Growth Factors, & Opportunities
- 4.1.6. Software
- 4.1.7. Methane Monitoring Share Forecast, By Region (USD Billion)
- 4.1.8. Comparative Revenue Analysis, By Country, 2025 & 2035
- 4.1.9. Key Market Trends, Growth Factors, & Opportunities
- 4.1.10. Services
- 4.1.11. Methane Monitoring Share Forecast, By Region (USD Billion)
- 4.1.12. Comparative Revenue Analysis, By Country, 2025 & 2035
- 4.1.13. Key Market Trends, Growth Factors, & Opportunities
- 4.1. Component Market Overview, By Component Segment
- Chapter 5. Methane Monitoring Market – By Technology
- 5.1. Technology Market Overview, By Technology Segment
- 5.1.1. Methane Monitoring Market Revenue Share, By Technology, 2025 & 2035
- 5.1.2. Remote Sensing
- 5.1.3. Methane Monitoring Share Forecast, By Region (USD Billion)
- 5.1.4. Comparative Revenue Analysis, By Country, 2025 & 2035
- 5.1.5. Key Market Trends, Growth Factors, & Opportunities
- 5.1.6. Optical Gas Imaging
- 5.1.7. Methane Monitoring Share Forecast, By Region (USD Billion)
- 5.1.8. Comparative Revenue Analysis, By Country, 2025 & 2035
- 5.1.9. Key Market Trends, Growth Factors, & Opportunities
- 5.1.10. Laser-based Detection
- 5.1.11. Methane Monitoring Share Forecast, By Region (USD Billion)
- 5.1.12. Comparative Revenue Analysis, By Country, 2025 & 2035
- 5.1.13. Key Market Trends, Growth Factors, & Opportunities
- 5.1.14. Satellite Monitoring
- 5.1.15. Methane Monitoring Share Forecast, By Region (USD Billion)
- 5.1.16. Comparative Revenue Analysis, By Country, 2025 & 2035
- 5.1.17. Key Market Trends, Growth Factors, & Opportunities
- 5.1.18. UAV/Drone-based Monitoring
- 5.1.19. Methane Monitoring Share Forecast, By Region (USD Billion)
- 5.1.20. Comparative Revenue Analysis, By Country, 2025 & 2035
- 5.1.21. Key Market Trends, Growth Factors, & Opportunities
- 5.1.22. Others
- 5.1.23. Methane Monitoring Share Forecast, By Region (USD Billion)
- 5.1.24. Comparative Revenue Analysis, By Country, 2025 & 2035
- 5.1.25. Key Market Trends, Growth Factors, & Opportunities
- 5.1. Technology Market Overview, By Technology Segment
- Chapter 6. Methane Monitoring Market – By Application
- 6.1. Application Market Overview, By Application Segment
- 6.1.1. Methane Monitoring Market Revenue Share, By Application, 2025 & 2035
- 6.1.2. Oil & Gas
- 6.1.3. Methane Monitoring Share Forecast, By Region (USD Billion)
- 6.1.4. Comparative Revenue Analysis, By Country, 2025 & 2035
- 6.1.5. Key Market Trends, Growth Factors, & Opportunities
- 6.1.6. Agriculture
- 6.1.7. Methane Monitoring Share Forecast, By Region (USD Billion)
- 6.1.8. Comparative Revenue Analysis, By Country, 2025 & 2035
- 6.1.9. Key Market Trends, Growth Factors, & Opportunities
- 6.1.10. Waste Management
- 6.1.11. Methane Monitoring Share Forecast, By Region (USD Billion)
- 6.1.12. Comparative Revenue Analysis, By Country, 2025 & 2035
- 6.1.13. Key Market Trends, Growth Factors, & Opportunities
- 6.1.14. Mining
- 6.1.15. Methane Monitoring Share Forecast, By Region (USD Billion)
- 6.1.16. Comparative Revenue Analysis, By Country, 2025 & 2035
- 6.1.17. Key Market Trends, Growth Factors, & Opportunities
- 6.1.18. Others
- 6.1.19. Methane Monitoring Share Forecast, By Region (USD Billion)
- 6.1.20. Comparative Revenue Analysis, By Country, 2025 & 2035
- 6.1.21. Key Market Trends, Growth Factors, & Opportunities
- 6.1. Application Market Overview, By Application Segment
- Chapter 7. Methane Monitoring Market – By End-User
- 7.1. End-User Market Overview, By End-User Segment
- 7.1.1. Methane Monitoring Market Revenue Share, By End-User, 2025 & 2035
- 7.1.2. Industrial
- 7.1.3. Methane Monitoring Share Forecast, By Region (USD Billion)
- 7.1.4. Comparative Revenue Analysis, By Country, 2025 & 2035
- 7.1.5. Key Market Trends, Growth Factors, & Opportunities
- 7.1.6. Commercial
- 7.1.7. Methane Monitoring Share Forecast, By Region (USD Billion)
- 7.1.8. Comparative Revenue Analysis, By Country, 2025 & 2035
- 7.1.9. Key Market Trends, Growth Factors, & Opportunities
- 7.1.10. Government
- 7.1.11. Methane Monitoring Share Forecast, By Region (USD Billion)
- 7.1.12. Comparative Revenue Analysis, By Country, 2025 & 2035
- 7.1.13. Key Market Trends, Growth Factors, & Opportunities
- 7.1.14. Others
- 7.1.15. Methane Monitoring Share Forecast, By Region (USD Billion)
- 7.1.16. Comparative Revenue Analysis, By Country, 2025 & 2035
- 7.1.17. Key Market Trends, Growth Factors, & Opportunities
- 7.1. End-User Market Overview, By End-User Segment
- Chapter 8. Methane Monitoring Market – Regional Analysis
- 8.1. Methane Monitoring Market Overview, By Region Segment
- 8.1.1. Global Methane Monitoring Market Revenue Share, By Region, 2025 & 2035
- 8.1.2. Global Methane Monitoring Market Revenue, By Region, 2026 – 2035 (USD Billion)
- 8.1.3. Global Methane Monitoring Market Revenue, By Component, 2026 – 2035
- 8.1.4. Global Methane Monitoring Market Revenue, By Technology, 2026 – 2035
- 8.1.5. Global Methane Monitoring Market Revenue, By Application, 2026 – 2035
- 8.1.6. Global Methane Monitoring Market Revenue, By End-User, 2026 – 2035
- 8.2. North America
- 8.2.1. North America Methane Monitoring Market Revenue, By Country, 2026 – 2035 (USD Billion)
- 8.2.2. North America Methane Monitoring Market Revenue, By Component, 2026 – 2035
- 8.2.3. North America Methane Monitoring Market Revenue, By Technology, 2026 – 2035
- 8.2.4. North America Methane Monitoring Market Revenue, By Application, 2026 – 2035
- 8.2.5. North America Methane Monitoring Market Revenue, By End-User, 2026 – 2035
- 8.2.6. U.S. Methane Monitoring Market Revenue, 2026 – 2035 (USD Billion)
- 8.2.7. Canada Methane Monitoring Market Revenue, 2026 – 2035 (USD Billion)
- 8.2.8. Mexico Methane Monitoring Market Revenue, 2026 – 2035 (USD Billion)
- 8.2.9. Rest of North America Methane Monitoring Market Revenue, 2026 – 2035 (USD Billion)
- 8.3. Europe
- 8.3.1. Europe Methane Monitoring Market Revenue, By Country, 2026 – 2035 (USD Billion)
- 8.3.2. Europe Methane Monitoring Market Revenue, By Component, 2026 – 2035
- 8.3.3. Europe Methane Monitoring Market Revenue, By Technology, 2026 – 2035
- 8.3.4. Europe Methane Monitoring Market Revenue, By Application, 2026 – 2035
- 8.3.5. Europe Methane Monitoring Market Revenue, By End-User, 2026 – 2035
- 8.3.6. Germany Methane Monitoring Market Revenue, 2026 – 2035 (USD Billion)
- 8.3.7. France Methane Monitoring Market Revenue, 2026 – 2035 (USD Billion)
- 8.3.8. U.K. Methane Monitoring Market Revenue, 2026 – 2035 (USD Billion)
- 8.3.9. Russia Methane Monitoring Market Revenue, 2026 – 2035 (USD Billion)
- 8.3.10. Italy Methane Monitoring Market Revenue, 2026 – 2035 (USD Billion)
- 8.3.11. Spain Methane Monitoring Market Revenue, 2026 – 2035 (USD Billion)
- 8.3.12. Netherlands Methane Monitoring Market Revenue, 2026 – 2035 (USD Billion)
- 8.3.13. Rest of Europe Methane Monitoring Market Revenue, 2026 – 2035 (USD Billion)
- 8.4. Asia Pacific
- 8.4.1. Asia Pacific Methane Monitoring Market Revenue, By Country, 2026 – 2035 (USD Billion)
- 8.4.2. Asia Pacific Methane Monitoring Market Revenue, By Component, 2026 – 2035
- 8.4.3. Asia Pacific Methane Monitoring Market Revenue, By Technology, 2026 – 2035
- 8.4.4. Asia Pacific Methane Monitoring Market Revenue, By Application, 2026 – 2035
- 8.4.5. Asia Pacific Methane Monitoring Market Revenue, By End-User, 2026 – 2035
- 8.4.6. China Methane Monitoring Market Revenue, 2026 – 2035 (USD Billion)
- 8.4.7. Japan Methane Monitoring Market Revenue, 2026 – 2035 (USD Billion)
- 8.4.8. India Methane Monitoring Market Revenue, 2026 – 2035 (USD Billion)
- 8.4.9. New Zealand Methane Monitoring Market Revenue, 2026 – 2035 (USD Billion)
- 8.4.10. Australia Methane Monitoring Market Revenue, 2026 – 2035 (USD Billion)
- 8.4.11. South Korea Methane Monitoring Market Revenue, 2026 – 2035 (USD Billion)
- 8.4.12. Taiwan Methane Monitoring Market Revenue, 2026 – 2035 (USD Billion)
- 8.4.13. Rest of Asia Pacific Methane Monitoring Market Revenue, 2026 – 2035 (USD Billion)
- 8.5. The Middle-East and Africa
- 8.5.1. The Middle-East and Africa Methane Monitoring Market Revenue, By Country, 2026 – 2035 (USD Billion)
- 8.5.2. The Middle-East and Africa Methane Monitoring Market Revenue, By Component, 2026 – 2035
- 8.5.3. The Middle-East and Africa Methane Monitoring Market Revenue, By Technology, 2026 – 2035
- 8.5.4. The Middle-East and Africa Methane Monitoring Market Revenue, By Application, 2026 – 2035
- 8.5.5. The Middle-East and Africa Methane Monitoring Market Revenue, By End-User, 2026 – 2035
- 8.5.6. Saudi Arabia Methane Monitoring Market Revenue, 2026 – 2035 (USD Billion)
- 8.5.7. UAE Methane Monitoring Market Revenue, 2026 – 2035 (USD Billion)
- 8.5.8. Egypt Methane Monitoring Market Revenue, 2026 – 2035 (USD Billion)
- 8.5.9. Kuwait Methane Monitoring Market Revenue, 2026 – 2035 (USD Billion)
- 8.5.10. South Africa Methane Monitoring Market Revenue, 2026 – 2035 (USD Billion)
- 8.5.11. Rest of the Middle East & Africa Methane Monitoring Market Revenue, 2026 – 2035 (USD Billion)
- 8.6. Latin America
- 8.6.1. Latin America Methane Monitoring Market Revenue, By Country, 2026 – 2035 (USD Billion)
- 8.6.2. Latin America Methane Monitoring Market Revenue, By Component, 2026 – 2035
- 8.6.3. Latin America Methane Monitoring Market Revenue, By Technology, 2026 – 2035
- 8.6.4. Latin America Methane Monitoring Market Revenue, By Application, 2026 – 2035
- 8.6.5. Latin America Methane Monitoring Market Revenue, By End-User, 2026 – 2035
- 8.6.6. Brazil Methane Monitoring Market Revenue, 2026 – 2035 (USD Billion)
- 8.6.7. Argentina Methane Monitoring Market Revenue, 2026 – 2035 (USD Billion)
- 8.6.8. Rest of Latin America Methane Monitoring Market Revenue, 2026 – 2035 (USD Billion)
- 8.1. Methane Monitoring Market Overview, By Region Segment
- Chapter 9. Competitive Landscape
- 9.1. Company Market Share Analysis – 2025
- 9.1.1. Global Methane Monitoring Market: Company Market Share, 2025
- 9.2. Global Methane Monitoring Market Company Market Share, 2024
- 9.1. Company Market Share Analysis – 2025
- Chapter 10. Company Profiles
- 10.1. GHGSat
- 10.1.1. Company Overview
- 10.1.2. Key Executives
- 10.1.3. Product Portfolio
- 10.1.4. Financial Overview
- 10.1.5. Operating Business Segments
- 10.1.6. Business Performance
- 10.1.7. Recent Developments
- 10.2. Kairos Aerospace
- 10.3. ExxonMobil
- 10.4. Shell
- 10.5. Chevron
- 10.6. BP
- 10.7. TotalEnergies
- 10.8. Sierra Instruments
- 10.9. ABB Ltd.
- 10.10. FLIR Systems
- 10.11. Picarro Inc.
- 10.12. Bridger Photonics
- 10.13. Rebellion Photonics
- 10.14. Honeywell International Inc.
- 10.15. Siemens AG
- 10.16. Envirosuite
- 10.17. SeekOps Inc.
- 10.18. OptaSense (a Luna company)
- 10.19. Teledyne Technologies
- 10.20. SENSIA Solutions
- 10.21. Others.
- 10.1. GHGSat
- Chapter 11. Research Methodology
- 11.1. Research Methodology
- 11.2. Secondary Research
- 11.3. Primary Research
- 11.3.1. Analyst Tools and Models
- 11.4. Research Limitations
- 11.5. Assumptions
- 11.6. Insights From Primary Respondents
- 11.7. Why Custom Market Insights
- Chapter 12. Standard Report Commercials & Add-Ons
- 12.1. Customization Options
- 12.2. Subscription Module For Market Research Reports
- 12.3. Client Testimonials
List Of Figures
Figures No 1 to 36
List Of Tables
Tables No 1 to 51
Prominent Player
- GHGSat
- Kairos Aerospace
- ExxonMobil
- Shell
- Chevron
- BP
- TotalEnergies
- Sierra Instruments
- ABB Ltd.
- FLIR Systems
- Picarro Inc.
- Bridger Photonics
- Rebellion Photonics
- Honeywell International Inc.
- Siemens AG
- Envirosuite
- SeekOps Inc.
- OptaSense (a Luna company)
- Teledyne Technologies
- SENSIA Solutions
- Others
FAQs
The key players in the market are GHGSat, Kairos Aerospace, ExxonMobil, Shell, Chevron, BP, TotalEnergies, Sierra Instruments, ABB Ltd., FLIR Systems, Picarro Inc., Bridger Photonics, Rebellion Photonics, Honeywell International Inc., Siemens AG, Envirosuite, SeekOps Inc., OptaSense (a Luna company), Teledyne Technologies, SENSIA Solutions, Others.
The market for methane monitoring is largely affected by the government regulations. Policies that will mitigate the emission of greenhouse gases will ensure that industries identify and monitor the emission of methane gas through energy facilities, landfills, and agricultural activities. Countries are also being encouraged to go an extra mile in monitoring systems and emission reduction programs by international measures like the Global Methane Pledge.
Methane monitoring technologies are influenced by pricing. Large oil and gas companies tend to invest in high-tech monitoring systems, and smaller industrial premises might not have the financial capacity. Nevertheless, the cost of methane detection solutions is becoming more affordable in industries due to the gradual introduction of sensors, drones, and satellite monitoring solutions.
According to the market, by 2035, the market will have attained USD 8.90 billion, owing to the adoption of clouds, digital health, and AI-based healthcare facilities.
Strict regulatory frameworks and high-quality environmental monitoring structures are likely to ensure that North America is the leading party in the methane monitoring market. Laws that have been put in place by the United States Environmental Protection Agency stipulate that energy companies should have systems in place to detect and report methane leakages, and these have a high adoption rate in oil and gas production, pipeline networks, and industrial facilities.
Asia-Pacific is deemed to experience the highest CAGR in the methane monitoring market. It is going to be embraced by rapid industrial growth, the development of natural gas infrastructure, and increased environmental concerns. The nations like China and India are enhancing the policies to regulate methane emissions and investing in environmental monitoring technologies in oil and gas, waste collections, and industrial sectors.
The main forces behind the market of methane monitoring are the tighter environmental regulations against the emission of methane in the oil and gas industry, waste management, and the agricultural industry. Governments have been putting in place methane remediation initiatives and reporting of emissions. Moreover, the growth in corporate ESG commitments and climate ambitions are compelling industries to embrace new and sophisticated methane detection schemes, including satellite monitoring, laser sensors, and drone-based leak detection schemes.