Online Education Market Size, Trends and Insights By Course Type (Certification Courses, Degree Programs, Skill Development Courses, Professional Development Courses), By Learning Format (Synchronous Learning, Asynchronous Learning, Blended Learning, Self-Paced Learning), By Target Audience (K-12 Students, Working Professionals, Higher Education Students, Lifelong Learners), By Technology (Mobile Learning, Virtual Reality Learning, Artificial Intelligence Learning, Gamified Learning), By Delivery Method (Video Lectures, Discussion Forums, Interactive Quizzes, E-Books), and By Region - Global Industry Overview, Statistical Data, Competitive Analysis, Share, Outlook, and Forecast 2026 – 2035
Report Snapshot
CAGR: 21.5%
| Study Period: | 2026-2035 |
| Fastest Growing Market: | Asia Pacific |
| Largest Market: | North America |
Major Players
- Adobe Inc.
- Alphabet Inc.
- Udemy
- Pearsons Inc.
- Others
Reports Description
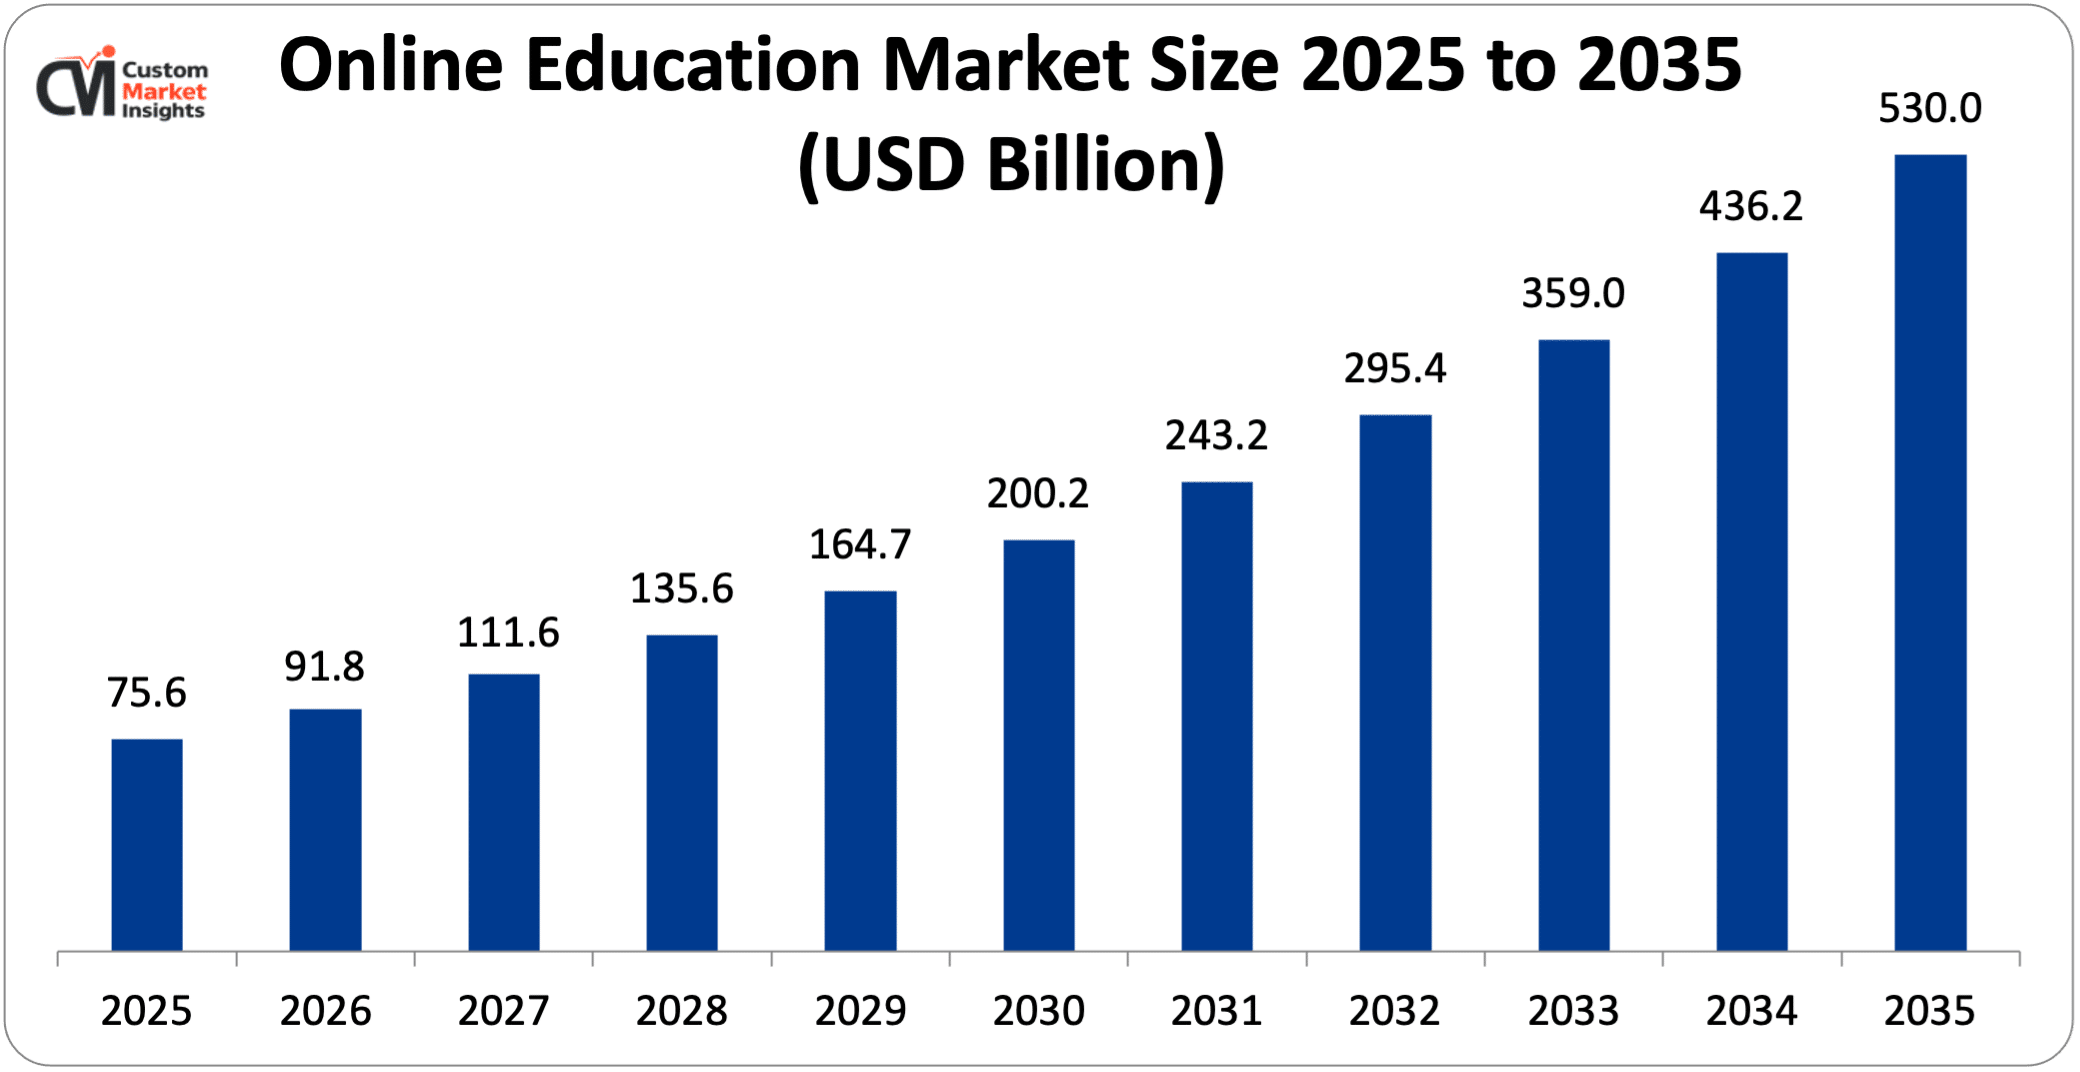
The market size of global online education will be estimated at USD 75.6 billion in 2025 and is expected to grow to between USD 91.8 billion in 2026 and about USD 530 billion by 2035, with a current CAGR (compound annual growth rate) of 21.5% during the period of 2026 to 2035. Online education encompasses a learning process that utilizes electronic resources via the internet to provide tutorials, classes, and degrees.
In online education, students, working professionals, and other learners can access all the course material anytime & anywhere. They can learn at their convenience on their own, self-paced or instructor-led. It is enabled by using sophisticated technology like learning management systems (LMS), mobile/web applications, cloud computing, and artificial intelligence. Online education can be used at academies or universities, for corporate training, and for skill development programs, but it is very flexible, cheap, and tailorable.
Market Highlight
- In 2025, North America will dominate the global market with an estimated market share of 35%. Presence of a major player drives the regional expansion.
- The Asia Pacific is growing at the highest CAGR over the analysis period. The increasing digitalization especially in India and China drives the industry growth.
- By course type, the certification courses segment accounted for the highest revenue share in 2025.
- By learning format, the synchronous learning segment will have the highest share of the market in 2025.
- By target audience, the K-12 students’ segment would have the highest share of the market in 2025.
- By technology, the mobile learning segment would have the highest share of the market in 2025.
- By delivery method, the video lectures segment would have the highest share of the market in 2025.
Significant Growth Factors
The online education market trends present significant growth opportunities due to several factors:
- Demand for Flexible & Affordable Learning: With the internet revolution, there is a growing necessity of flexible and affordable learning. Today’s learners want studying to be flexible; they want to study at their own pace, choose the learning schedules that suit them, and learn anytime from anywhere. The online courses are comprehensive and require significantly lower prices than traditional hours, as they save money on infrastructure, travel, printed materials, or other irrelevant expenses and make it affordable to large masses that have become uneconomical for traditional education, such as students living in remote areas and working professionals. Modular courses are also offered as a pre-packaged version, on a subscription basis, or as freely available learning resources on a wider scale to make it more accessible to all. The ease and affordability offered by online education have bolstered the ever-growing market for online courses.
- Government Initiatives & Digital Education Policies: Government initiatives and digital education policies are another key driver of growth in the online education industry. Countries across the globe are focusing on e-learning by spending heavily on digital infrastructure for learning, promoting broadband connectivity, and encouraging students’ usage of online education portals. Countries are also creating a required regulatory environment for the online education mode by providing approval for online degrees and creating digital education portals. They are also providing subsidies for virtual classrooms. India’s government has been very active in encouraging digital education through the Digital India program and several government-level e-learning initiatives. These initiatives have improved access to better quality education facilities for the masses, especially people in the rural and backward areas. Public-private partnerships in skill development and other government skill upgradation initiatives are further enhancing the scope of the online education industry.
What are the Major Advances Changing the Online Education Market Today?
- AI-powered Personalized Learning: AI-based personalized learning is arguably one of the most disruptive innovations that are transforming the online education industry by enabling deeply personalized learning that adapts to each learner. Using artificial intelligence, online learning systems can now capture learner data and personalize content, tests, recommendations, and others. According to the learner’s preferences, preferences, and extrapolate this knowledge to the next steps in the learner’s journey in real time, in place of treating all learners according to the same predetermined design. In essence, moving from a generic approach to a personalized one results in higher learner engagement, knowledge retention, and efficiency. Product launches illustrate this optimal integration of AI and learner-centered design: for example, Google’s Gemini “Guided Learning” offers an AI enabled “tutoring” with question generation and step-by-step reasoning, whereas new platforms like Alice. Tech and Oboe analyze responses and generate personalized study plans, flashcards, and entire curriculums. AI-based language learning platforms, such as Talkpal AI, or immersive experiences like Praktika, create personalized online learning through interaction-based responses and speech. Such innovations demonstrate how online education is evolving from providing content to enabling personalized, scalable, intelligent education.
- Gamification & Game-based Learning: The use of gamification and game-based learning has been a revolution in the online learning industry, and that too because they offer a better, colorful, interactive learning experience with game mechanisms, such as points, badges, achievement boards, rewards, and challenges. Learners are motivated and actively involved and remember better due to the experience-based learning experience. Instead of merely consuming content, learners interact with it in the form of quizzes, interactions, simulators, competitive activities, and others, enabling deeper understanding and better retention of information. Some recent examples of product innovations serving this trend are Duolingo, which uses learner streaks, levels, and rewards to encourage daily learning; Kahoot! Where learners participate using interactive game-based quizzes in a classroom or corporate setting, Quizizz and BYJU‘S use gamified assessments and storytelling techniques to help learners comprehend complex concepts. These can be seen as a few innovative developments brought out by gamification techniques, which have shifted online learning from a passive consumption of content to an interactive experience-based model, contributing towards the growth of the segment.
Category Wise Insights
By Course Type
Why Certification Courses Hold a Prominent Position in the Market?
The certification courses segment accounted for the highest revenue share in 2025. The certification courses segment has become a largely significant part of revenue in the online education space and has shown robust and continuing upward growth trends as professionals and learners have increasingly begun seeking skill-based and career-specific content. Globally, this segment has seen double-digit growth, especially in developing economies (e.g., India), where professionals and students are eager to earn certifications in fields such as data science, information technology, AI/ML and graphic design, which are inclusive of industry-recognized certifications. Accordingly, like Udemy, Coursera and edX have expanded their offerings in certification-based paradigms in fields like data science, analytics, AI/ML, cybersecurity, and digital marketing, to name a few, which has helped the revenue growth of the platforms. This segment is also growing rapidly because lifelong upskilling and reskilling are becoming an increasing demand in a world where traditional education is no longer enough.
The degree programs segment is growing at the highest CAGR during the forecast period. The growth is occurring due to the rapid acceptance of fully online and hybrid academic degrees worldwide. Universities, as well as edtech giants such as Coursera, edX, and FutureLearn, have increased the number of online bachelor’s and master’s degrees in families such as business, computer science, or healthcare and have attracted tremendous learners. The segment’s growth is mainly attributed to growth in the demand for flexible higher education options that would facilitate students and working professionals to pursue degree studies without relocating or quitting their jobs. It is also more affordable than traditional on-campus education in terms of tuition, traveling, and accommodation expenses. The credibility of online degrees has also increased significantly, and renowned organizations and governments worldwide have approved online degrees.
By Learning Format
Why Synchronous Learning Capture the Highest Market Share in the Online Education Market?
The synchronous learning segment would have the highest share of the market in 2025. The growth is increasing because of the growing dominance of the live and interactive learning model that duplicates the classroom learning environment. Synchronous learning, where instructor-to-learner has to be in touch in real time through Webinars/online sessions and live classes, provides a scope of informing and getting feedback from learners. The support of Zoom Video Communications Inc., Microsoft (through Microsoft Teams), and Google (through Google Meet) proved the growth of this segment as they supplied scalable online “live virtual classroom” instruments. The leap for this growth comes mostly from the simple “scheduled” leaning, better interactivity, and engagement with instructors.
The asynchronous learning segment is growing at a rapid rate over the projected period. Cost and scalability drive this category, enabling global content scaling without time zone restrictions. Furthermore, new emerging trends like content delivery technology, mobile learning, and AI Recommendations provides more value with content by providing easy access to learning, personalization, and optimized delivery of content.
By Target Audience
Why Do K-12 Students Capture the Highest Market Share in the Online Education Market?
The K-12 students’ segment would have the highest share of the market in 2025. Growth for this segment is expected to be driven by higher smartphone and internet penetration, heightened awareness among parents about digital education, and the need for customized curriculum-based content.
The lifelong learner’s segment is growing at a rapid rate over the projected period. This growth has been driven by increased demand for continuous skills development in an increasingly dynamic global economy. Individuals of all ages are engaging in informal lifelong learning as a way of maintaining their employability, changing career paths, and pursuing personal interests.
By Technology
Why Does Mobile Learning Capture the Highest Market Share in the Online Education Market?
The mobile learning segment would have the highest share of the market in 2025. The rapid proliferation of smartphones and the high penetration of the internet across both developed and emerging economies primarily drive growth. Learners are finding mobile learning solutions to be more convenient and flexible, providing on-the-go access whenever required.
The virtual reality learning segment is growing at a rapid rate over the projected period. The growth is driven by the increasing demand for immersive and experiential learning solutions.
By Delivery Method
Why Do Video Lectures Capture the Highest Market Share in the Online Education Market?
The video lectures segment would have the highest share of the market in 2025. The growth is driven by the increasing preference for visual and easily accessible learning formats.
The interactive quizzes segment is growing at a rapid rate over the projected period. The growth is driven by the increasing emphasis on active learning, real-time assessment, and learner engagement.
Report Scope
| Feature of the Report | Details |
| Market Size in 2026 | USD 91.8 billion |
| Projected Market Size in 2035 | USD 530 billion |
| Market Size in 2025 | USD 75.6 billion |
| CAGR Growth Rate | 21.5% CAGR |
| Base Year | 2025 |
| Forecast Period | 2026-2035 |
| Key Segment | By Course Type, Learning Format, Target Audience, Technology, Delivery Method and Region |
| Report Coverage | Revenue Estimation and Forecast, Company Profile, Competitive Landscape, Growth Factors and Recent Trends |
| Regional Scope | North America, Europe, Asia Pacific, Middle East & Africa, and South & Central America |
| Buying Options | Request tailored purchasing options to fulfil your requirements for research. |
Regional Analysis
How Big is North America Online Education Market Size?
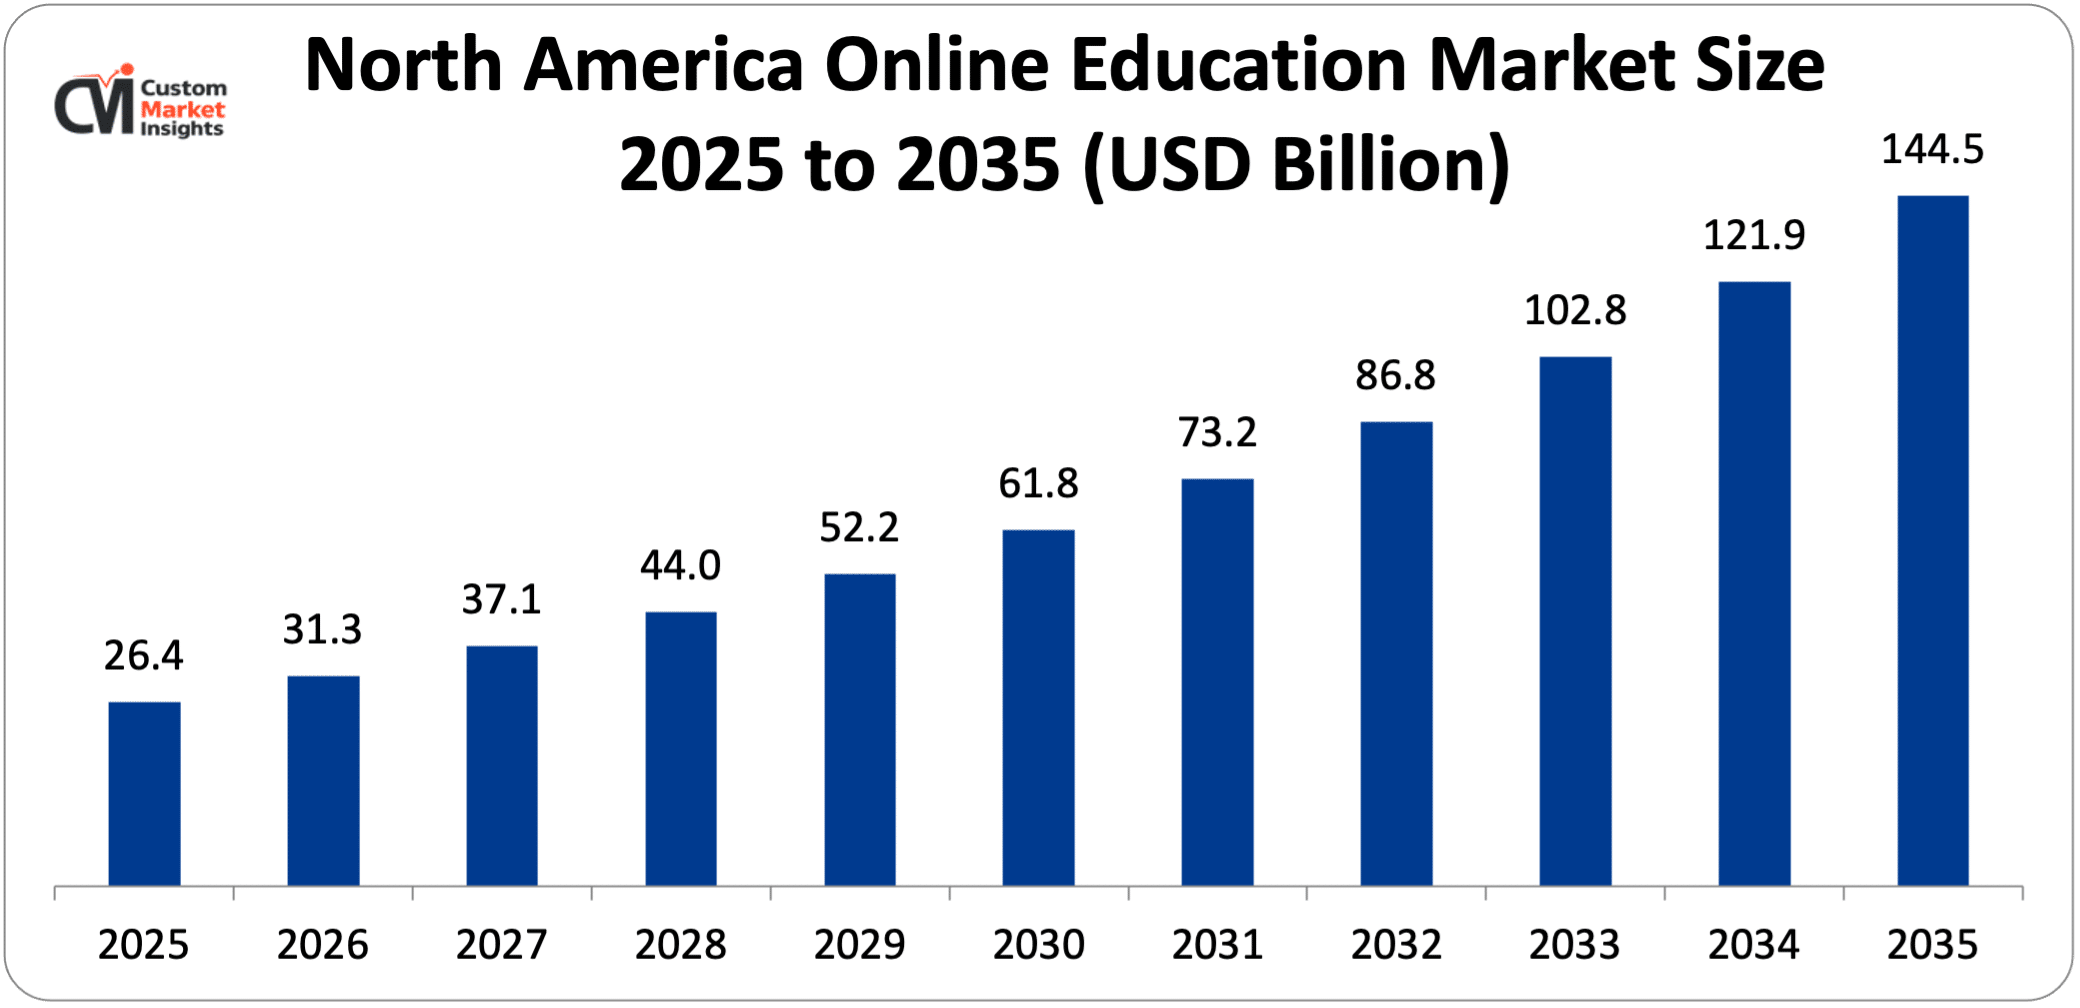
Its market size, in terms of North America online education, is projected to be USD 26.4 billion in 2025 with a growth of about USD 144.5 billion in 2035 with a CAGR of 18.5% between 2026 and 2035.
Why did North America Dominate the Online Education Market in 2025?
In 2025, North America will dominate the global market with an estimated market share of 35%. The North American region has experienced growth owing to high penetration of digital infrastructure and high levels of connectivity coupled with early adoption of various edtech courses and platforms. The increase in the number of various popular fixed and flexible edtech courses and companies on the popular marketplaces such as coursera, udemy, edX, and others has further fueled the growth of the edtech market in this region. Furthermore, the growing need to reskill and upskill working professionals for a modern skill set required to stay competitive, especially in tech-related domains, is another reason for the upswing in demand for online courses and certifications. The educational institutions and companies are capitalizing on high-powered digital learning tools such as virtual classrooms and AI based platforms to enhance learning efficiency and workforce productivity.
US Online Education Market Trends
In the North American region, the US is growing at a significant rate over the projected period. Market growth has been driven by strong investments in innovation, government policies, and the accepted use of all online degrees and certifications.
Why is Europe Experiencing Significant Growth in the Online Education Market?
Europe holds a significant market share in 2025. The growth is primarily driven by the increasing trend of digitalization in education systems and government support for e-learning. The countries in Europe are employing their resources towards building smart classrooms, digital infrastructure, and online platforms for education.
UK Online Education Market Trends
The UK held the dominant position in the market in 2025. The growing need for upskilling and reskilling in the workforce (especially digital and technical skills) and the increased adoption of flexible learning solutions by students and workers.
Why is the Asia Pacific Growing at the Highest Rate in the Online Education Market?
The Asia Pacific is expected to grow at the highest rate over the projected period. The growth is owing to the rising adoption of smartphones and increasing internet penetration.
India Online Education Market Trends
India holds the prominent market share in the industry. The favorable government initiatives and increasing digitalization drive the growth of the market.
Why is the Middle East & Africa Region is growing rapidly in the Online Education?
The MEA region is growing at a steady rate over the projected period. The increased growth is mainly due to an improvement in internet connectivity, increased availability of smartphones, and increased favor for digital transformation of learning by governments. Many countries in the region are implementing e-learning platforms/digital infrastructure to increase access to education even in remote and hard-to-reach areas.
UAE Online Education Market Trends
The UAE is growing at the highest CAGR during the forecast period. The increasing partnership drives the market growth. For instance, in December 2025, ADQ, an active sovereign investor focused on critical infrastructure and global supply chains, and the Gates Foundation announced a landmark partnership to accelerate the responsible and high-impact adoption of artificial intelligence (AI) and education technology (EdTech) to improve learning outcomes for children across sub-Saharan Africa. The announcement was made on the sidelines of Abu Dhabi Finance Week, during Bill Gates’s visit to the UAE as chair of the Gates Foundation.
Top Players in the Online Education Market and Their Offerings
- Coursera Inc
- Instructure Holding Inc.
- Adobe Inc.
- Alphabet Inc.
- Udemy
- Pearsons Inc.
- Stride Inc.
- NetEase Inc.
- LinkedIn Learning (Microsoft)
- Pluralsight Inc.
- edX (2U Inc.)
- Skillshare Inc.
- Byju’s (India)
- Duolingo Inc.
- Khan Academy
- Blackboard Inc.
- Simplilearn Solutions
- Teachable Inc.
- Thinkific Labs Inc.
- Udacity Inc.
- Others
Key Developments
Online education market has experienced considerable changes in the last two years as the market players are trying to diversify their technological aspects and develop product portfolios using strategic approaches.
- In November 2025, Coursera, a leading global online learning platform, announced two new Specializations from its new partner Anthropic, one of the world’s leading AI research companies. The two Specializations — Building with the Claude API and Real-World AI for Everyone — will teach developers and professionals how to effectively work with Claude, Anthropic’s trusted AI assistant.
These strategic measures have enabled the companies to reinforce their competitive positions, increase the product line, boost their technological competencies and also seize growth opportunities in the fast-growing online education market.
The Online Education Market is segmented as follows:
By Course Type
- Certification Courses
- Degree Programs
- Skill Development Courses
- Professional Development Courses
By Learning Format
- Synchronous Learning
- Asynchronous Learning
- Blended Learning
- Self-Paced Learning
By Target Audience
- K-12 Students
- Working Professionals
- Higher Education Students
- Lifelong Learners
By Technology
- Mobile Learning
- Virtual Reality Learning
- Artificial Intelligence Learning
- Gamified Learning
By Delivery Method
- Video Lectures
- Discussion Forums
- Interactive Quizzes
- E-Books
Regional Coverage:
North America
- U.S.
- Canada
- Mexico
- Rest of North America
Europe
- Germany
- France
- U.K.
- Russia
- Italy
- Spain
- Netherlands
- Rest of Europe
Asia Pacific
- China
- Japan
- India
- New Zealand
- Australia
- South Korea
- Taiwan
- Rest of Asia Pacific
The Middle East & Africa
- Saudi Arabia
- UAE
- Egypt
- Kuwait
- South Africa
- Rest of the Middle East & Africa
Latin America
- Brazil
- Argentina
- Rest of Latin America
Table of Contents
- Chapter 1. Report Introduction
- 1.1. Report Description
- 1.1.1. Purpose of the Report
- 1.1.2. USP & Key Offerings
- 1.2. Key Benefits For Stakeholders
- 1.3. Target Audience
- 1.4. Report Scope
- 1.1. Report Description
- Chapter 2. Market Overview
- 2.1. Report Scope (Segments And Key Players)
- 2.1.1. Online Education by Segments
- 2.1.2. Online Education by Region
- 2.2. Executive Summary
- 2.2.1. Market Size & Forecast
- 2.2.2. Online Education Market Attractiveness Analysis, By Course Type
- 2.2.3. Online Education Market Attractiveness Analysis, By Learning Format
- 2.2.4. Online Education Market Attractiveness Analysis, By Target Audience
- 2.2.5. Online Education Market Attractiveness Analysis, By Technology
- 2.2.6. Online Education Market Attractiveness Analysis, By Delivery Method
- 2.1. Report Scope (Segments And Key Players)
- Chapter 3. Market Dynamics (DRO)
- 3.1. Market Drivers
- 3.1.1. Demand for Flexible & Affordable Learning
- 3.1.2. Government Initiatives & Digital Education Policies
- 3.2. Market Restraints
- 3.3. Market Opportunities
- 3.5. Pestle Analysis
- 3.6. Porter Forces Analysis
- 3.7. Technology Roadmap
- 3.8. Value Chain Analysis
- 3.9. Government Policy Impact Analysis
- 3.10. Pricing Analysis
- 3.1. Market Drivers
- Chapter 4. Online Education Market – By Course Type
- 4.1. Course Type Market Overview, By Course Type Segment
- 4.1.1. Online Education Market Revenue Share, By Course Type, 2025 & 2035
- 4.1.2. Certification Courses
- 4.1.3. Online Education Share Forecast, By Region (USD Billion)
- 4.1.4. Comparative Revenue Analysis, By Country, 2025 & 2035
- 4.1.5. Key Market Trends, Growth Factors, & Opportunities
- 4.1.6. Degree Programs
- 4.1.7. Online Education Share Forecast, By Region (USD Billion)
- 4.1.8. Comparative Revenue Analysis, By Country, 2025 & 2035
- 4.1.9. Key Market Trends, Growth Factors, & Opportunities
- 4.1.10. Skill Development Courses
- 4.1.11. Online Education Share Forecast, By Region (USD Billion)
- 4.1.12. Comparative Revenue Analysis, By Country, 2025 & 2035
- 4.1.13. Key Market Trends, Growth Factors, & Opportunities
- 4.1.14. Professional Development Courses
- 4.1.15. Online Education Share Forecast, By Region (USD Billion)
- 4.1.16. Comparative Revenue Analysis, By Country, 2025 & 2035
- 4.1.17. Key Market Trends, Growth Factors, & Opportunities
- 4.1. Course Type Market Overview, By Course Type Segment
- Chapter 5. Online Education Market – By Learning Format
- 5.1. Learning Format Market Overview, By Learning Format Segment
- 5.1.1. Online Education Market Revenue Share, By Learning Format, 2025 & 2035
- 5.1.2. Synchronous Learning
- 5.1.3. Online Education Share Forecast, By Region (USD Billion)
- 5.1.4. Comparative Revenue Analysis, By Country, 2025 & 2035
- 5.1.5. Key Market Trends, Growth Factors, & Opportunities
- 5.1.6. Asynchronous Learning
- 5.1.7. Online Education Share Forecast, By Region (USD Billion)
- 5.1.8. Comparative Revenue Analysis, By Country, 2025 & 2035
- 5.1.9. Key Market Trends, Growth Factors, & Opportunities
- 5.1.10. Blended Learning
- 5.1.11. Online Education Share Forecast, By Region (USD Billion)
- 5.1.12. Comparative Revenue Analysis, By Country, 2025 & 2035
- 5.1.13. Key Market Trends, Growth Factors, & Opportunities
- 5.1.14. Self-Paced Learning
- 5.1.15. Online Education Share Forecast, By Region (USD Billion)
- 5.1.16. Comparative Revenue Analysis, By Country, 2025 & 2035
- 5.1.17. Key Market Trends, Growth Factors, & Opportunities
- 5.1. Learning Format Market Overview, By Learning Format Segment
- Chapter 6. Online Education Market – By Target Audience
- 6.1. Target Audience Market Overview, By Target Audience Segment
- 6.1.1. Online Education Market Revenue Share, By Target Audience, 2025 & 2035
- 6.1.2. K-12 Students
- 6.1.3. Online Education Share Forecast, By Region (USD Billion)
- 6.1.4. Comparative Revenue Analysis, By Country, 2025 & 2035
- 6.1.5. Key Market Trends, Growth Factors, & Opportunities
- 6.1.6. Working Professionals
- 6.1.7. Online Education Share Forecast, By Region (USD Billion)
- 6.1.8. Comparative Revenue Analysis, By Country, 2025 & 2035
- 6.1.9. Key Market Trends, Growth Factors, & Opportunities
- 6.1.10. Higher Education Students
- 6.1.11. Online Education Share Forecast, By Region (USD Billion)
- 6.1.12. Comparative Revenue Analysis, By Country, 2025 & 2035
- 6.1.13. Key Market Trends, Growth Factors, & Opportunities
- 6.1.14. Lifelong Learners
- 6.1.15. Online Education Share Forecast, By Region (USD Billion)
- 6.1.16. Comparative Revenue Analysis, By Country, 2025 & 2035
- 6.1.17. Key Market Trends, Growth Factors, & Opportunities
- 6.1. Target Audience Market Overview, By Target Audience Segment
- Chapter 7. Online Education Market – By Technology
- 7.1. Technology Market Overview, By Technology Segment
- 7.1.1. Online Education Market Revenue Share, By Technology, 2025 & 2035
- 7.1.2. Mobile Learning
- 7.1.3. Online Education Share Forecast, By Region (USD Billion)
- 7.1.4. Comparative Revenue Analysis, By Country, 2025 & 2035
- 7.1.5. Key Market Trends, Growth Factors, & Opportunities
- 7.1.6. Virtual Reality Learning
- 7.1.7. Online Education Share Forecast, By Region (USD Billion)
- 7.1.8. Comparative Revenue Analysis, By Country, 2025 & 2035
- 7.1.9. Key Market Trends, Growth Factors, & Opportunities
- 7.1.10. Artificial Intelligence Learning
- 7.1.11. Online Education Share Forecast, By Region (USD Billion)
- 7.1.12. Comparative Revenue Analysis, By Country, 2025 & 2035
- 7.1.13. Key Market Trends, Growth Factors, & Opportunities
- 7.1.14. Gamified Learning
- 7.1.15. Online Education Share Forecast, By Region (USD Billion)
- 7.1.16. Comparative Revenue Analysis, By Country, 2025 & 2035
- 7.1.17. Key Market Trends, Growth Factors, & Opportunities
- 7.1. Technology Market Overview, By Technology Segment
- Chapter 8. Online Education Market – By Delivery Method
- 8.1. Delivery Method Market Overview, By Delivery Method Segment
- 8.1.1. Online Education Market Revenue Share, By Delivery Method, 2025 & 2035
- 8.1.2. Video Lectures
- 8.1.3. Online Education Share Forecast, By Region (USD Billion)
- 8.1.4. Comparative Revenue Analysis, By Country, 2025 & 2035
- 8.1.5. Key Market Trends, Growth Factors, & Opportunities
- 8.1.6. Discussion Forums
- 8.1.7. Online Education Share Forecast, By Region (USD Billion)
- 8.1.8. Comparative Revenue Analysis, By Country, 2025 & 2035
- 8.1.9. Key Market Trends, Growth Factors, & Opportunities
- 8.1.10. Interactive Quizzes
- 8.1.11. Online Education Share Forecast, By Region (USD Billion)
- 8.1.12. Comparative Revenue Analysis, By Country, 2025 & 2035
- 8.1.13. Key Market Trends, Growth Factors, & Opportunities
- 8.1.14. E-Books
- 8.1.15. Online Education Share Forecast, By Region (USD Billion)
- 8.1.16. Comparative Revenue Analysis, By Country, 2025 & 2035
- 8.1.17. Key Market Trends, Growth Factors, & Opportunities
- 8.1. Delivery Method Market Overview, By Delivery Method Segment
- Chapter 9. Online Education Market – Regional Analysis
- 9.1. Online Education Market Overview, By Region Segment
- 9.1.1. Global Online Education Market Revenue Share, By Region, 2025 & 2035
- 9.1.2. Global Online Education Market Revenue, By Region, 2026 – 2035 (USD Billion)
- 9.1.3. Global Online Education Market Revenue, By Course Type, 2026 – 2035
- 9.1.4. Global Online Education Market Revenue, By Learning Format, 2026 – 2035
- 9.1.5. Global Online Education Market Revenue, By Target Audience, 2026 – 2035
- 9.1.6. Global Online Education Market Revenue, By Technology, 2026 – 2035
- 9.1.7. Global Online Education Market Revenue, By Delivery Method, 2026 – 2035
- 9.2. North America
- 9.2.1. North America Online Education Market Revenue, By Country, 2026 – 2035 (USD Billion)
- 9.2.2. North America Online Education Market Revenue, By Course Type, 2026 – 2035
- 9.2.3. North America Online Education Market Revenue, By Learning Format, 2026 – 2035
- 9.2.4. North America Online Education Market Revenue, By Target Audience, 2026 – 2035
- 9.2.5. North America Online Education Market Revenue, By Technology, 2026 – 2035
- 9.2.6. North America Online Education Market Revenue, By Delivery Method, 2026 – 2035
- 9.2.7. U.S. Online Education Market Revenue, 2026 – 2035 (USD Billion)
- 9.2.8. Canada Online Education Market Revenue, 2026 – 2035 (USD Billion)
- 9.2.9. Mexico Online Education Market Revenue, 2026 – 2035 (USD Billion)
- 9.2.10. Rest of North America Online Education Market Revenue, 2026 – 2035 (USD Billion)
- 9.3. Europe
- 9.3.1. Europe Online Education Market Revenue, By Country, 2026 – 2035 (USD Billion)
- 9.3.2. Europe Online Education Market Revenue, By Course Type, 2026 – 2035
- 9.3.3. Europe Online Education Market Revenue, By Learning Format, 2026 – 2035
- 9.3.4. Europe Online Education Market Revenue, By Target Audience, 2026 – 2035
- 9.3.5. Europe Online Education Market Revenue, By Technology, 2026 – 2035
- 9.3.6. Europe Online Education Market Revenue, By Delivery Method, 2026 – 2035
- 9.3.7. Germany Online Education Market Revenue, 2026 – 2035 (USD Billion)
- 9.3.8. France Online Education Market Revenue, 2026 – 2035 (USD Billion)
- 9.3.9. U.K. Online Education Market Revenue, 2026 – 2035 (USD Billion)
- 9.3.10. Russia Online Education Market Revenue, 2026 – 2035 (USD Billion)
- 9.3.11. Italy Online Education Market Revenue, 2026 – 2035 (USD Billion)
- 9.3.12. Spain Online Education Market Revenue, 2026 – 2035 (USD Billion)
- 9.3.13. Netherlands Online Education Market Revenue, 2026 – 2035 (USD Billion)
- 9.3.14. Rest of Europe Online Education Market Revenue, 2026 – 2035 (USD Billion)
- 9.4. Asia Pacific
- 9.4.1. Asia Pacific Online Education Market Revenue, By Country, 2026 – 2035 (USD Billion)
- 9.4.2. Asia Pacific Online Education Market Revenue, By Course Type, 2026 – 2035
- 9.4.3. Asia Pacific Online Education Market Revenue, By Learning Format, 2026 – 2035
- 9.4.4. Asia Pacific Online Education Market Revenue, By Target Audience, 2026 – 2035
- 9.4.5. Asia Pacific Online Education Market Revenue, By Technology, 2026 – 2035
- 9.4.6. Asia Pacific Online Education Market Revenue, By Delivery Method, 2026 – 2035
- 9.4.7. China Online Education Market Revenue, 2026 – 2035 (USD Billion)
- 9.4.8. Japan Online Education Market Revenue, 2026 – 2035 (USD Billion)
- 9.4.9. India Online Education Market Revenue, 2026 – 2035 (USD Billion)
- 9.4.10. New Zealand Online Education Market Revenue, 2026 – 2035 (USD Billion)
- 9.4.11. Australia Online Education Market Revenue, 2026 – 2035 (USD Billion)
- 9.4.12. South Korea Online Education Market Revenue, 2026 – 2035 (USD Billion)
- 9.4.13. Taiwan Online Education Market Revenue, 2026 – 2035 (USD Billion)
- 9.4.14. Rest of Asia Pacific Online Education Market Revenue, 2026 – 2035 (USD Billion)
- 9.5. The Middle-East and Africa
- 9.5.1. The Middle-East and Africa Online Education Market Revenue, By Country, 2026 – 2035 (USD Billion)
- 9.5.2. The Middle-East and Africa Online Education Market Revenue, By Course Type, 2026 – 2035
- 9.5.3. The Middle-East and Africa Online Education Market Revenue, By Learning Format, 2026 – 2035
- 9.5.4. The Middle-East and Africa Online Education Market Revenue, By Target Audience, 2026 – 2035
- 9.5.5. The Middle-East and Africa Online Education Market Revenue, By Technology, 2026 – 2035
- 9.5.6. The Middle-East and Africa Online Education Market Revenue, By Delivery Method, 2026 – 2035
- 9.5.7. Saudi Arabia Online Education Market Revenue, 2026 – 2035 (USD Billion)
- 9.5.8. UAE Online Education Market Revenue, 2026 – 2035 (USD Billion)
- 9.5.9. Egypt Online Education Market Revenue, 2026 – 2035 (USD Billion)
- 9.5.10. Kuwait Online Education Market Revenue, 2026 – 2035 (USD Billion)
- 9.5.11. South Africa Online Education Market Revenue, 2026 – 2035 (USD Billion)
- 9.5.12. Rest of the Middle East & Africa Online Education Market Revenue, 2026 – 2035 (USD Billion)
- 9.6. Latin America
- 9.6.1. Latin America Online Education Market Revenue, By Country, 2026 – 2035 (USD Billion)
- 9.6.2. Latin America Online Education Market Revenue, By Course Type, 2026 – 2035
- 9.6.3. Latin America Online Education Market Revenue, By Learning Format, 2026 – 2035
- 9.6.4. Latin America Online Education Market Revenue, By Target Audience, 2026 – 2035
- 9.6.5. Latin America Online Education Market Revenue, By Technology, 2026 – 2035
- 9.6.6. Latin America Online Education Market Revenue, By Delivery Method, 2026 – 2035
- 9.6.7. Brazil Online Education Market Revenue, 2026 – 2035 (USD Billion)
- 9.6.8. Argentina Online Education Market Revenue, 2026 – 2035 (USD Billion)
- 9.6.9. Rest of Latin America Online Education Market Revenue, 2026 – 2035 (USD Billion)
- 9.1. Online Education Market Overview, By Region Segment
- Chapter 10. Competitive Landscape
- 10.1. Company Market Share Analysis – 2025
- 10.1.1. Global Online Education Market: Company Market Share, 2025
- 10.2. Global Online Education Market Company Market Share, 2024
- 10.1. Company Market Share Analysis – 2025
- Chapter 11. Company Profiles
- 11.1. Coursera Inc
- 11.1.1. Company Overview
- 11.1.2. Key Executives
- 11.1.3. Product Portfolio
- 11.1.4. Financial Overview
- 11.1.5. Operating Business Segments
- 11.1.6. Business Performance
- 11.1.7. Recent Developments
- 11.2. Instructure Holding Inc.
- 11.3. Adobe Inc.
- 11.4. Alphabet Inc.
- 11.5. Udemy
- 11.6. Pearsons Inc.
- 11.7. Stride Inc.
- 11.8. NetEase Inc.
- 11.9. LinkedIn Learning (Microsoft)
- 11.10. Pluralsight Inc.
- 11.11. edX (2U Inc.)
- 11.12. Skillshare Inc.
- 11.13. Byju’s (India)
- 11.14. Duolingo Inc.
- 11.15. Khan Academy
- 11.16. Blackboard Inc.
- 11.17. Simplilearn Solutions
- 11.18. Teachable Inc.
- 11.19. Thinkific Labs Inc.
- 11.20. Udacity Inc.
- 11.21. Others.
- 11.1. Coursera Inc
- Chapter 12. Research Methodology
- 12.1. Research Methodology
- 12.2. Secondary Research
- 12.3. Primary Research
- 12.3.1. Analyst Tools and Models
- 12.4. Research Limitations
- 12.5. Assumptions
- 12.6. Insights From Primary Respondents
- 12.7. Why Custom Market Insights
- Chapter 13. Standard Report Commercials & Add-Ons
- 13.1. Customization Options
- 13.2. Subscription Module For Market Research Reports
- 13.3. Client Testimonials
List Of Figures
Figures No 1 to 40
List Of Tables
Tables No 1 to 56
Prominent Players
- Coursera Inc
- Instructure Holding Inc.
- Adobe Inc.
- Alphabet Inc.
- Udemy
- Pearsons Inc.
- Stride Inc.
- NetEase Inc.
- LinkedIn Learning (Microsoft)
- Pluralsight Inc.
- edX (2U Inc.)
- Skillshare Inc.
- Byju’s (India)
- Duolingo Inc.
- Khan Academy
- Blackboard Inc.
- Simplilearn Solutions
- Teachable Inc.
- Thinkific Labs Inc.
- Udacity Inc.
- Others
FAQs
The key players in the market are Coursera Inc., Instructure Holdings Inc., Adobe Inc., Alphabet Inc., Udemy, Pearson Inc., Stride Inc., NetEase Inc., LinkedIn Learning (Microsoft), Pluralsight Inc., edX (2U Inc.), Skillshare Inc., Byju’s (India), Duolingo Inc., Khan Academy, Blackboard Inc., Simplilearn Solutions, Teachable Inc., Thinkific Labs Inc., Udacity Inc., and Others.
Government regulations play a crucial role in shaping the online education market by ensuring quality standards, accrediting programs, and promoting digital learning initiatives, which together enhance credibility, drive adoption, and support sustainable market growth.
Lower price points increase accessibility and adoption by attracting a wider user base, while higher pricing may limit uptake but can enhance perceived value and revenue per user.
According to the present analysis and forecast modeling, the market of online education will witness a significant growth of about USD 530.0 billion in the year 2035 with the growing innovative product launch, increasing collaboration, and rising disposable income with a CAGR of 21.5% between the years 2026 and 2035.
It is projected that North America will hold the largest market share in the online education market in the forecast period, with a share of about 35% of the global market share, which is attributed to the increasing product launches.
The Asia Pacific is expected to grow at the highest rate during the forecast period. The growth in the region is owing to the increasing government initiatives.
The key factors driving the market are growing investments in digital education technology development, increased internet penetration, and high demand for microlearning.