Process Lifecycle Management Market Size, Trends and Insights By Deployment (Cloud-based, On-premise, Hybrid), By Organization Size (Large Enterprises, Small and Medium Enterprises), By Application (Product Design and Development, Manufacturing Process Management, Quality Management, Compliance Management, Supply Chain Collaboration, Service and Maintenance Management, Other Applications), By End-User Industry (Automotive, Aerospace and Defense, Electronics and Semiconductors, Industrial Machinery, Consumer Goods, Pharmaceuticals, Food and Beverage, Energy and Utilities, Other Industries), and By Region - Global Industry Overview, Statistical Data, Competitive Analysis, Share, Outlook, and Forecast 2026 – 2035
Report Snapshot
| Study Period: | 2026-2035 |
| Fastest Growing Market: | Asia Pacific |
| Largest Market: | North America |
Major Players
- Siemens AG
- Dassault Systèmes SE
- PTC Inc.
- SAP SE
- Others
Reports Description
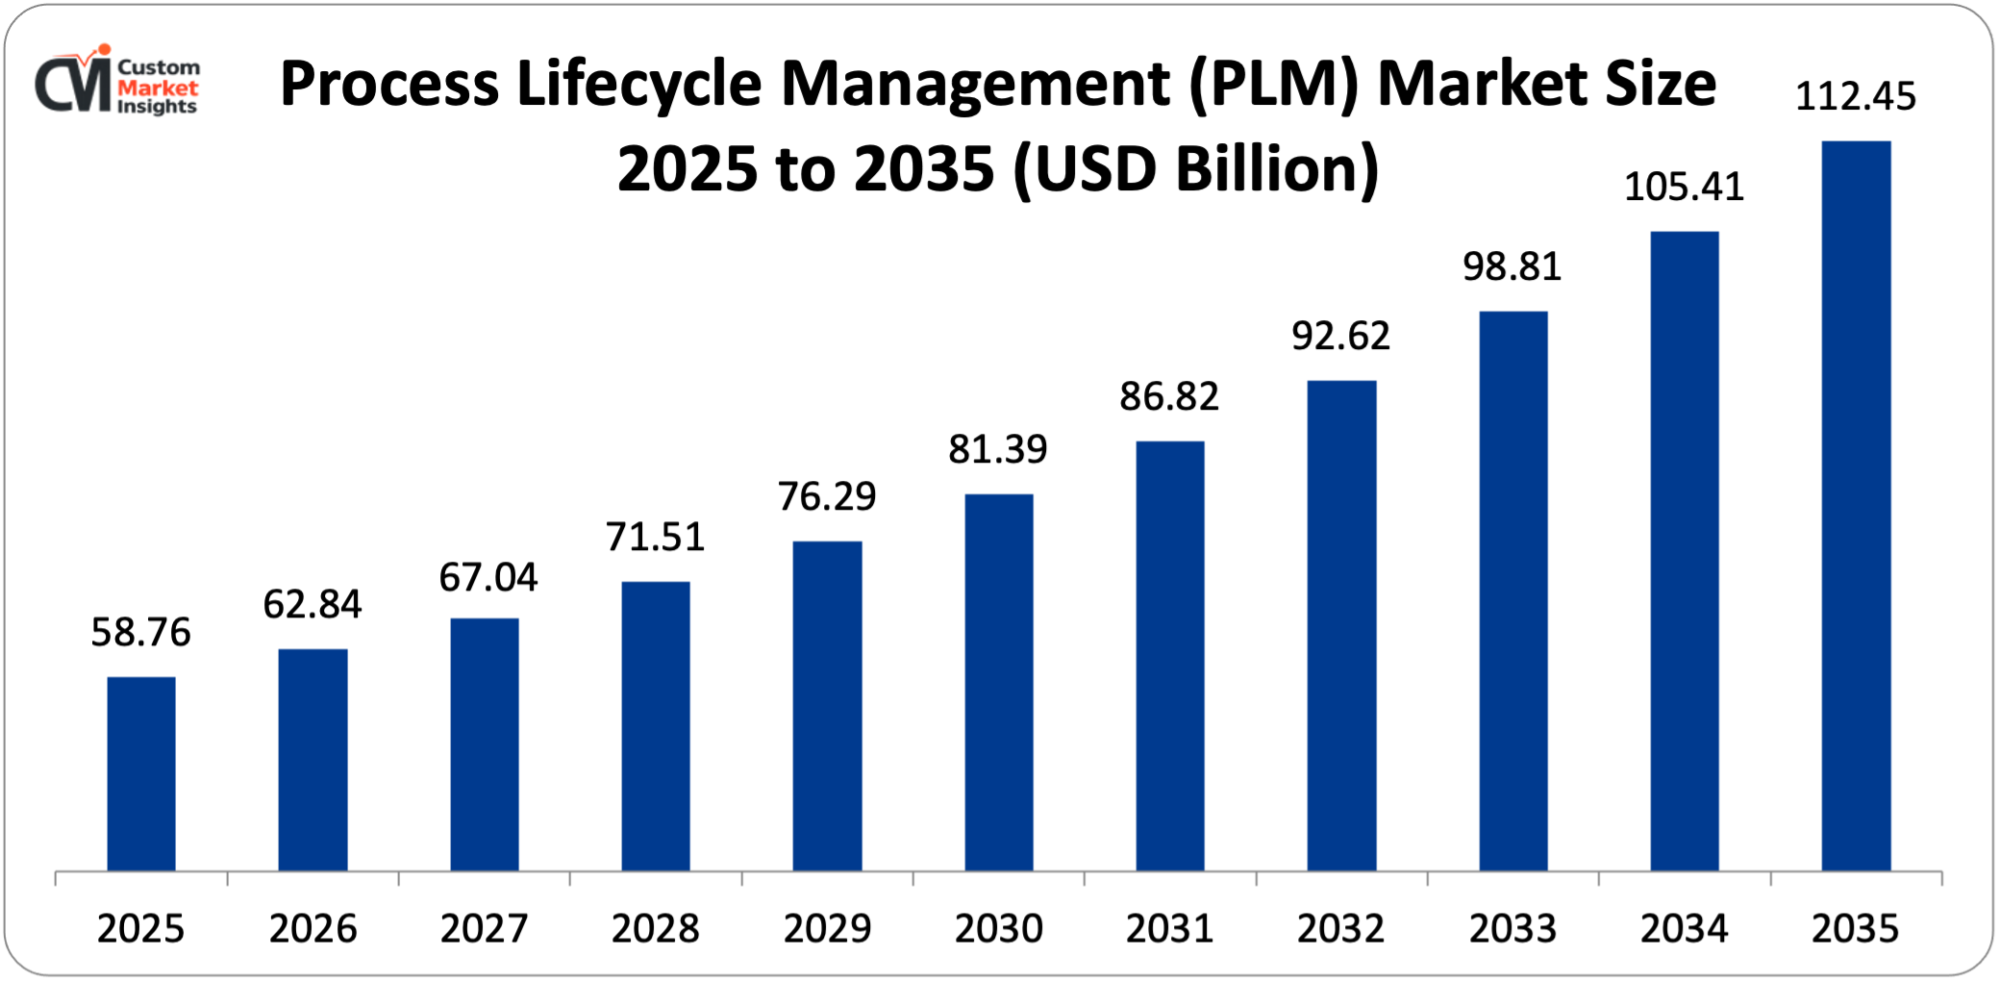
The global Process Lifecycle Management (PLM) market is estimated to grow to USD 58.76 billion in the year 2025 and the market size is projected to grow to USD 62.84 billion in the year 2026 and to approximately USD 112.45 billion in the period between 2026 and 2035 at a CAGR rate of 6.95%. The market is expanding due to the augmented complexity of product development in each industry, the rising implementation of digital transformation efforts, augmented demand and quality management and control and regulation, the advancement of teamwork engineering, and technological innovations such as artificial intelligence, machine learning, and cloud computing.
Market Highlight
- North America the market leader of Process Lifecycle Management had 39% of the market share in 2025.
- Asia Pacific will develop with a growth rate of 8.2% during the years 2026 to 2035.
- By type of deployment, the cloud-based deployment segment had already controlled 42% of the market share by 2025.
- The highest growth rate of CAGR of 8.1% during the period 2026-2035 will be in the cloud-based segment.
- The size of organization: The large enterprises segment occupied 71% market share in 2025.
- At the 2024 market, 68.5% of the total product lifecycle management market was covered by process-oriented PLM solutions.
Key Trends & Drivers
The Process Lifecycle Management Market Trends present significant growth opportunities due to several factors:
- Digital Transformation and Industry 4.0 Integration: The increasing pace of digital transformation programs within manufacturing sectors is the key motivating factor behind the PLM market where companies are seeking to digitize their whole product development and manufacturing processes through to the end of their lives. The 2025 survey by the Manufacturing Leadership Council revealed that 78% of manufacturers are already in the midst of undertaking entire digital transformation programs, and PLM systems are considered as the platform over which they manage product data, processes and collaboration. The manufacturing industry has an estimated USD 14.3 trillion worth in the year 2024 and it is making a radical transition to smart manufacturing with Industry 4.0 technologies building interconnected ecosystems in which PLM is the central nervous system. According to the World Economic Forum, manufacturers that introduced the new digital technologies, such as PLM, have realized productivity increases of 20-30% and a shorter time-to-market by 25-40%. Combining PLM with the new technologies that include the Internet of Things (IoT), artificial intelligence, and advanced analytics, organizations can use real-time data provided by connected products across the lifecycle to design improvements and anticipate maintenance requirements. The COVID-19 pandemic increased the pace of digital transformation by an estimated 5-7 years for the organizations that rapidly embraced cloud-based collaboration tools and digital engineering platforms to continue their operations with distributed workforces. At present, the digital threads built on modern PLM are connected to enterprise resource planning (ERP), manufacturing execution systems (MES), supply chain management (SCM), and customer relationship management (CRM) systems, which make the platform spaceful enough to unite each part of the product lifecycle. The semiconductor sector, which manufactured about 1.15 trillion units in 2024 with a value of USD 611 billion, needs the PLM systems to manage the design complexity of the chips containing billions of transistors besides coordinating the global supply chains and ensuring adherence to international standards.
- Increasing Product Complexity and Regulatory Requirements: The explosive increase of the complexity of products in every industry is promoting the use of PLM because organizations are finding it difficult to deal with millions of components, configurations, and compliance regulations via the traditional approach. This pattern is typified in the automotive industry whereby the new vehicles come full of parts and software code, in the case of the advanced models, they translate to be over 30,000 separate parts and 100 million software code lines, which is an increase of 10 times in the software complexity over a decade. The Electric cars introduce additional complexity in the form of battery management systems, power electronics and software-defined features which demand advanced lifecycle management capabilities. The aerospace industry encounters the same problems, whereby commercial planes such as the Boeing 787 have a total of around 2.3 million components from more than 5,400 suppliers in 50 countries and therefore requires powerful PLM systems to organize the designing, manufacturing, and maintenance of a service life of more than 30 years. The compliance requirements in the regulatory sectors are also escalating and the pharmaceutical sector is dealing with compliance of FDA 21 CFR Part 11 and the automotive industry with ISO 26262 functional safety and the medical device sector with ISO 13485 quality management requirements. One study discovered that compliance costs of up to 10-15% of the revenue of regulated industries are on compliance documentation, lowered by PLM systems by 40-60% by means of automated workflows and audit trails. Data governance requirements have been introduced in the European Union through the General Data Protection Regulation (GDPR) and in the California Consumer Privacy Act (CCPA) as far as handling product information with customer data is concerned, the PLM systems need to implement these requirements. Environmental laws like the Restriction of Hazardous Substances (RoHS) directive issued by the EU and the Registration, Evaluation, Authorization and Restriction of Chemicals (REACH) regulation demand that manufacturers monitor the composition of the materials used in the supply chain and the required visibility and documentation are offered by PLM systems. Consumer electronics industry, which shipped 2.87 billion smartphones worldwide in 2024, has to deal with short product cycles of 12-18 months and handle complex supply chains and make sure that the products meet safety certifications in 150 or more countries. PLM platforms allow companies to have detailed bills of materials (BOMs), engineering changes across thousands of product options and keep all the regulatory documents in line with the latest product specifications.
What are the Major Advances Changing the Process Lifecycle Management Market Today
- Artificial Intelligence and Machine Learning Integration: The most radical technological change is implementing artificial intelligence and machine learning algorithms in PLM environments, which allow predictive analytics, design optimization by algorithms, and intelligent decision support that increases productivity and innovativeness dramatically. Modern AI-driven PLM systems have natural language processing, which enables engineers to search product databases with semantic queries, automatic classification algorithms that sort and label CAD files and technical documents automatically, generative design, which generates optimized component designs in response to performance requirements and manufacturing constraints and predictive quality analytics, which can predict possible defects before they are manufactured. Gartner (2025 technology forecast) predicts that with AI-enhanced PLM systems, the design iteration cycle will be cut by 30-40% and the first-time-right production rate will improve by 25-35%. Machine learning algorithms work with historical product development data to find the patterns and propose design solutions, and Siemens stated that the AI-enhanced PLM tools have cut employee engineering time by one-fifth and raised quality metrics of design solutions by 15% in pilot applications. PLM systems with computer vision technologies automatically retrieve metadata of technical drawings and 3D models to allow quicker search and reuse of existing designs, which can save a company 18-22% in terms of cost to introduce a new product. The digital twin technology is an AI-driven tool used in the PLM systems that generates virtual proxies of physical products to mimic the behavior in the real world and forecast maintenance and refine the operational parameters during the lifecycle of the product. The adoption of digital twins in the GE industrial equipment has seen improvements of 10-20% in equipment uptime and 5-10% in maintenance expenses, as disclosed by the company. PLM systems can predict component failures with a 2–4-week lead time using predictive maintenance algorithms on sensor data on linked products and perform proactive service interventions to alleviate downtime by 35-50%, depending on industry case studies. AI-driven analysis of change impacts automatically evaluates the effect of proposed engineering changes on associated components, manufacturing processes, and supply chains, halting change order processing time, which otherwise would require days, and minimizing unintended effects.
- Cloud-based PLM and Software-as-a-Service Models: The trend towards cloud-based PLM implementations and Software-as-a-Service (SaaS) models of delivery has made more sophisticated PLM services accessible to more people and removed barriers to entry and facilitation of previously unseen levels of collaboration. PLM Solutions based on the cloud remove investments in on-premise infrastructure, such as USD 500,000 to USD 5 million to implement in some cases, and provide a subscription-based pricing structure based on USD 100-300 per user monthly, which helps users match costs with usage. The change has enabled PLM to be available to small and medium enterprises (SMEs), of which the SME segment is at 7.8% CAGR and projected to reach USD 32.6 billion in 2035 as cloud solutions have reduced the barriers of adoption. According to industry statistics, cloud PLM implementations take 50-60% less time to be deployed than traditional on-premise systems and the average time to go live is 3-6 months as opposed to 12-18 months to go live with similar on-premise projects. The cloud platforms offer natural scalability, which enables organizations to scale up and down user licenses and computing resources depending on the needs of the project, and the infrastructure limits are not a concern as it is especially useful in project-based sectors such as construction and shipbuilding. The global cloud PLM Market segment achieved 42% market share in 2025 and is predicted to have an 8.1% CAGR through 2035 due to multi-tenant architectures offering updated and additional functionalities without disruptive upgrade initiatives that used to eat 15-20% of the IT budgets in the past. Cloud-based PLM facilitates effective coordination among teams that are spread worldwide, with engineering teams in various time zones developing the same product model in real-time, cutting engineering cycle time by 20-30%, according to PTC customer case studies. Improved security features in the latest cloud PLM systems such as encryption at rest and in transit, MFA, and ISO 27001, SOC 2, and industry-specific certifications have resolved the security issues encountered earlier that inhibited cloud adoption. The COVID-19 crisis precipitated cloud PLM use in a new way indicating that cloud PLM appraisals surged by 300% in 2020-2021 as organizations implemented the capacity to empower remote collaboration amid spreading workforces. Hybrid cloud architectures are becoming a trendy compromise to implement sensitive intellectual property and legacy systems on-premise and use cloud features to collaborate, conduct analytics, and integrate suppliers.
- Model-Based Systems Engineering (MBSE) and Digital Thread: The adoption of the Model-Based Systems Engineering techniques with the PLM platforms is transforming product design, validation and manufacturing of complex products by substituting document-based processes with a digital representation that offers a single source of the truth. The MBSE techniques make use of standardized modeling languages such as SysML (Systems Modeling Language) to build up detailed digital models of systems, subsystems and components that reflect requirements, architecture, behavior and verification requirements in machine readable forms that can be seamlessly integrated with PLM repositories. The aerospace and defense community has also been an early follower, with NASA applying MBSE to large-scale programs and reporting 20-25% cost development savings and 30-40% quality improvements in traceability of requirements. Digital thread is not limited to a single organization but also establishes end-to-end connectivity between the need of a customer, through design, manufacture, operation, and even retirement with Lockheed Martin reporting a 50% cut in integration problems on the F-35 program due to taking digital thread. Companies that manufacture products with digital thread features record 35-45% cuts in manufacturing design period because product definitions move without manual data translation through design systems into computer-aided manufacturing (CAM), and manufacturing execution systems. Model-based definition (MBD) does not employ 2D engineering drawings, instead, all the manufacturing information (PMI) of products is directly incorporated into 3D CAD models, and Boeing has estimated 17% cost and 40% year-to-year cycle time cuts in manufacturing engineering workflows with the use of MBD. MBSE approaches are required in major acquisition programs by the U.S. Department of Defense, and the Digital Engineering Strategy was made available in 2019, aiming to achieve 95% hand-offs to digital by 2025, which will lead to substantial investments in the defense industrial base in terms of PLM. Digital threads of closed loop quality management enable the connectivity between design specification and manufacturing quality data and field performance data and enable engineers to match a design decision with actual results and implement cycles of continuous improvement which improve the reliability of the product by 15-25% based on industry implementations. The use of computer-aided engineering (CAE) simulation tools in PLM platforms has facilitated simulation-based design, in which virtual testing is done to confirm performance is validated prior to physical prototypes being prepared, which saves up to 30-50% in prototype costs and shortens the validation process by 2-4 months as indicated by surveys conducted by Ansys customers.
- Sustainability and Circular Economy Integration: The increased attention to the concept of environmental sustainability, as well as the ideas of the circular economy, is leading to the emergence of new functionalities of PLM that are strictly oriented towards environmental impact monitoring, sustainable decision-making, and the planning and recycling of products at their end of life. Environmental Product Declarations (EPDs) and Life Cycle Assessments (LCAs) are emerging as prerequisites and now PLM systems include carbon footprint calculators to estimate the environmental impact at every stage of the lifecycle, starting with the extraction of raw materials and then the manufacturing process, the use and the final disposal. The Corporate Sustainability Reporting Directive (CSRD) of the European Union that will cover around 50,000 companies in the year 2024 will require full sustainability reporting which must be facilitated by the PLM system through detailed material and process tracking. Automotive companies are also using PLM sustainability modules to help them become carbon neutral in their corporate operations, with General Motors pledging to achieve zero tailpipe emissions by 2035 and Volkswagen reducing vehicle lifecycle CO₂ emissions by 30% by 2030, both demanding advanced PLM to measure and optimize sustainability indicators. Management of material compliance in PLM systems has since developed to more than just tracking of restricted materials but to encompass material transparency in a broad sense, with systems now able to manage the 7,000+ materials employed in the average automotive development program and ensure compliance with both global regulations and corporate sustainability policies and commitments. Design tools that are sustainably designed (design for sustainability (DfS) tools) through PLM tools offer real-time feedback on environmental impacts in the design process and help engineers make informed decisions on material choice, manufacturing processes, and product structures that reduce environmental footprints. Circular economy needs PLM systems to consider the end-of-life of the product early in development and has the ability to designate a disassembly design and recyclability rating and to trace recycled materials that enable the objectives of large companies such as Apple, which reached 20% of all products with recycled content in 2024. The growing number of U.S. states and the longer producer responsibility laws of the European Union compel manufacturers to take responsibility for the product take-back and recycling, and the PLM systems can supply the product formula and the product disposition details that enable an efficient recycling process. An example of this is the global electric vehicle battery market, which is estimated to grow to 3,500 GWh by 2030, which will require the adoption of PLM systems that have the ability to trace battery components into the manufacturing process, vehicle operation, and their eventual reuse or recycling into other energy storage products, with battery passports being mandatory in the EU as of 2027.
Category Wise Insights
By Deployment
Why Cloud-based Solutions Lead the Market?
The biggest portion in 2025 will be the cloud-based deployment that will constitute approximately 42% of the market share. This domination can be explained by the quick digital transformation efforts within industries, the absence of large upfront infrastructure spending, the flexibility of the subscription-based pricing framework, and the increased collaboration opportunities enabled by cloud platforms for distributed teams worldwide. As per the report by Cloud Industry Forum (2025), the enterprises utilizing cloud services to host important business applications has reached 89%, and PLM is among the five leading applications migrating to the cloud. PLM solutions based on the cloud have deployment times of 3-6 months as opposed to 12-24 months with on-premise deployments and yield a 60-70% reduction in time-to-value over on-premise deployments. A cloud PLM will usually cost less by 5 years than an on-premise solution when considering the cost of infrastructure, maintenance, upgrade costs, and IT staff.
Cloud-based deployments are seeing the most rapid growth of CAGR of 8.1% between 2026 and 2035 with the ongoing digital transformation in industries, the maturity of cloud security and compliance certifications that provide confidence to enterprises, the adoption of emerging powerful technologies such as AI and machine learning that use cloud computing capabilities, and the compelling ROI that has been demonstrated by the early adopters. Siemens, PTC and Dassault Systèmes, followed by other key vendors of PLM, have all launched cloud-native platforms and PTC reports that 60% of new PLM bookings in 2024 were on its cloud platform, versus 25% in 2020. Hybrid cloud model is becoming the model of transition as organizations are able to retain sensitive intellectual property and old integrations on-premise and take advantage of the capabilities of the cloud to collaborate and develop advanced analytical solutions.
By End-User Industry
Why Automotive Dominates PLM Applications?
The largest segment will be the automotive applications which will have 28% in 2025. This leadership indicates the industry has been on the forefront in the use of PLM, the exceptionally difficult nature of the modern automotive vehicles with 30,000+ parts and 100 million lines of software code, the global nature of the automotive supply chains that have 2,500-5,000 suppliers per vehicle program and the aggressive product development cycles in the industry that have shrunk the development timelines to 24-36 months. One of the most challenging places where PLM systems are needed is the global automotive industry, which manufactured 88.1 million vehicles in 2024, according to the OICA statistics. The development of electric vehicles has increased the demand on PLM; such devices as battery systems comprise 2,000-5,000 individual cells that have to be managed in terms of design, production, and eventual recycling, and software-defined vehicles involving elaborated software architectures with over-the-air update capabilities have to be supported throughout vehicle operational lifetimes of 10-15 years.
The most robust growth will be in the pharmaceutical applications which will see a CAGR of 9.2% between 2026 and 2035 because the industry is becoming more sophisticated in its development of drugs, more extensive in its use of digital technologies in life sciences, and more demanding in its regulatory requirements of both the FDA and the EMA, and it is shifting towards personalized medicine and biologics. According to Tufts Center for the Study of Drug Development, the pharmaceutical industry spends 10-15 years with development costs of over USD 2.6 billion to develop a single approved drug, a feat that has become challenging due to the pandemic. Pharmaceutical PLM systems oversee formulation development, clinical trial protocols, regulatory submissions, manufacturing process validation, and post-market surveillance lifecycle products that may last 30+ years by considering both patent exclusivity and generic transition. The compliance requirements of Part 11 of 21 CFR regulations on electronic record integrity and audit trails that are inherent in the PLM systems demand constantly increasing biologics and cell and gene therapies, which require more advanced process management capabilities than the traditional pharmaceutical systems.
By Organization Size
Why Large Enterprises Dominate the Market?
Large enterprises of which they occupy some 71% market share in 2025 are the largest category. This is an example of the superiority of the large investment that will be necessary in any type of enterprise PLM implementation which can vary between USD 1 million and USD 50 million based on the scope of implementation and the size of the organization that will implement PLM and the complexity of the integration of PLM with existing enterprise systems such as ERP, MES, SCM and quality management systems and the fact that large-scale change management initiatives will be necessary to promote the use of PLM by thousands of engineers and manufacturing workers. Manufacturers in the fortune 500 have gained large returns on the investment made in the PLM field where a study conducted by McKinsey revealed that firms that had matured into the PLM models made 20-30 times faster on the time-to-market, 15-25 times lower in product development costs, and 10-20 times higher in product quality ratios than companies that had not developed into the PLM models.
Small and medium enterprise (SME) segment though it constitutes 29% of the present market share is growing at a spectacular rate of 7.8% CAGR as cloud based PLM removes adoption barriers and vendors are offering simplified packages that meet the requirements of SMEs. SMEs that have between 50-500 employees are realizing that the capabilities of PLM that could only be offered by large companies are now available on cloud platforms at reasonable subscription fees of USD 5,000 to USD 50,000 per year in full solutions. Competitive forces, forcing SMEs to enhance collaboration with larger customers requiring integration of PLM to coordinate the supply chain, increasing product complexity even in small organizations, and industry-specific PLM packages, which ease the need to customize and shorten implementation timespaces drive the SME segment.
Report Scope
| Feature of the Report | Details |
| Market Size in 2026 | USD 62.84 billion |
| Projected Market Size in 2035 | USD 112.45 billion |
| Market Size in 2025 | USD 58.76 billion |
| CAGR Growth Rate | 6.95% CAGR |
| Base Year | 2025 |
| Forecast Period | 2026-2035 |
| Key Segment | By Deployment, Organization Size, Application, End-User Industry and Region |
| Report Coverage | Revenue Estimation and Forecast, Company Profile, Competitive Landscape, Growth Factors and Recent Trends |
| Regional Scope | North America, Europe, Asia Pacific, Middle East & Africa, and South & Central America |
| Buying Options | Request tailored purchasing options to fulfil your requirements for research. |
Regional Analysis
How Big is the North America Market Size?
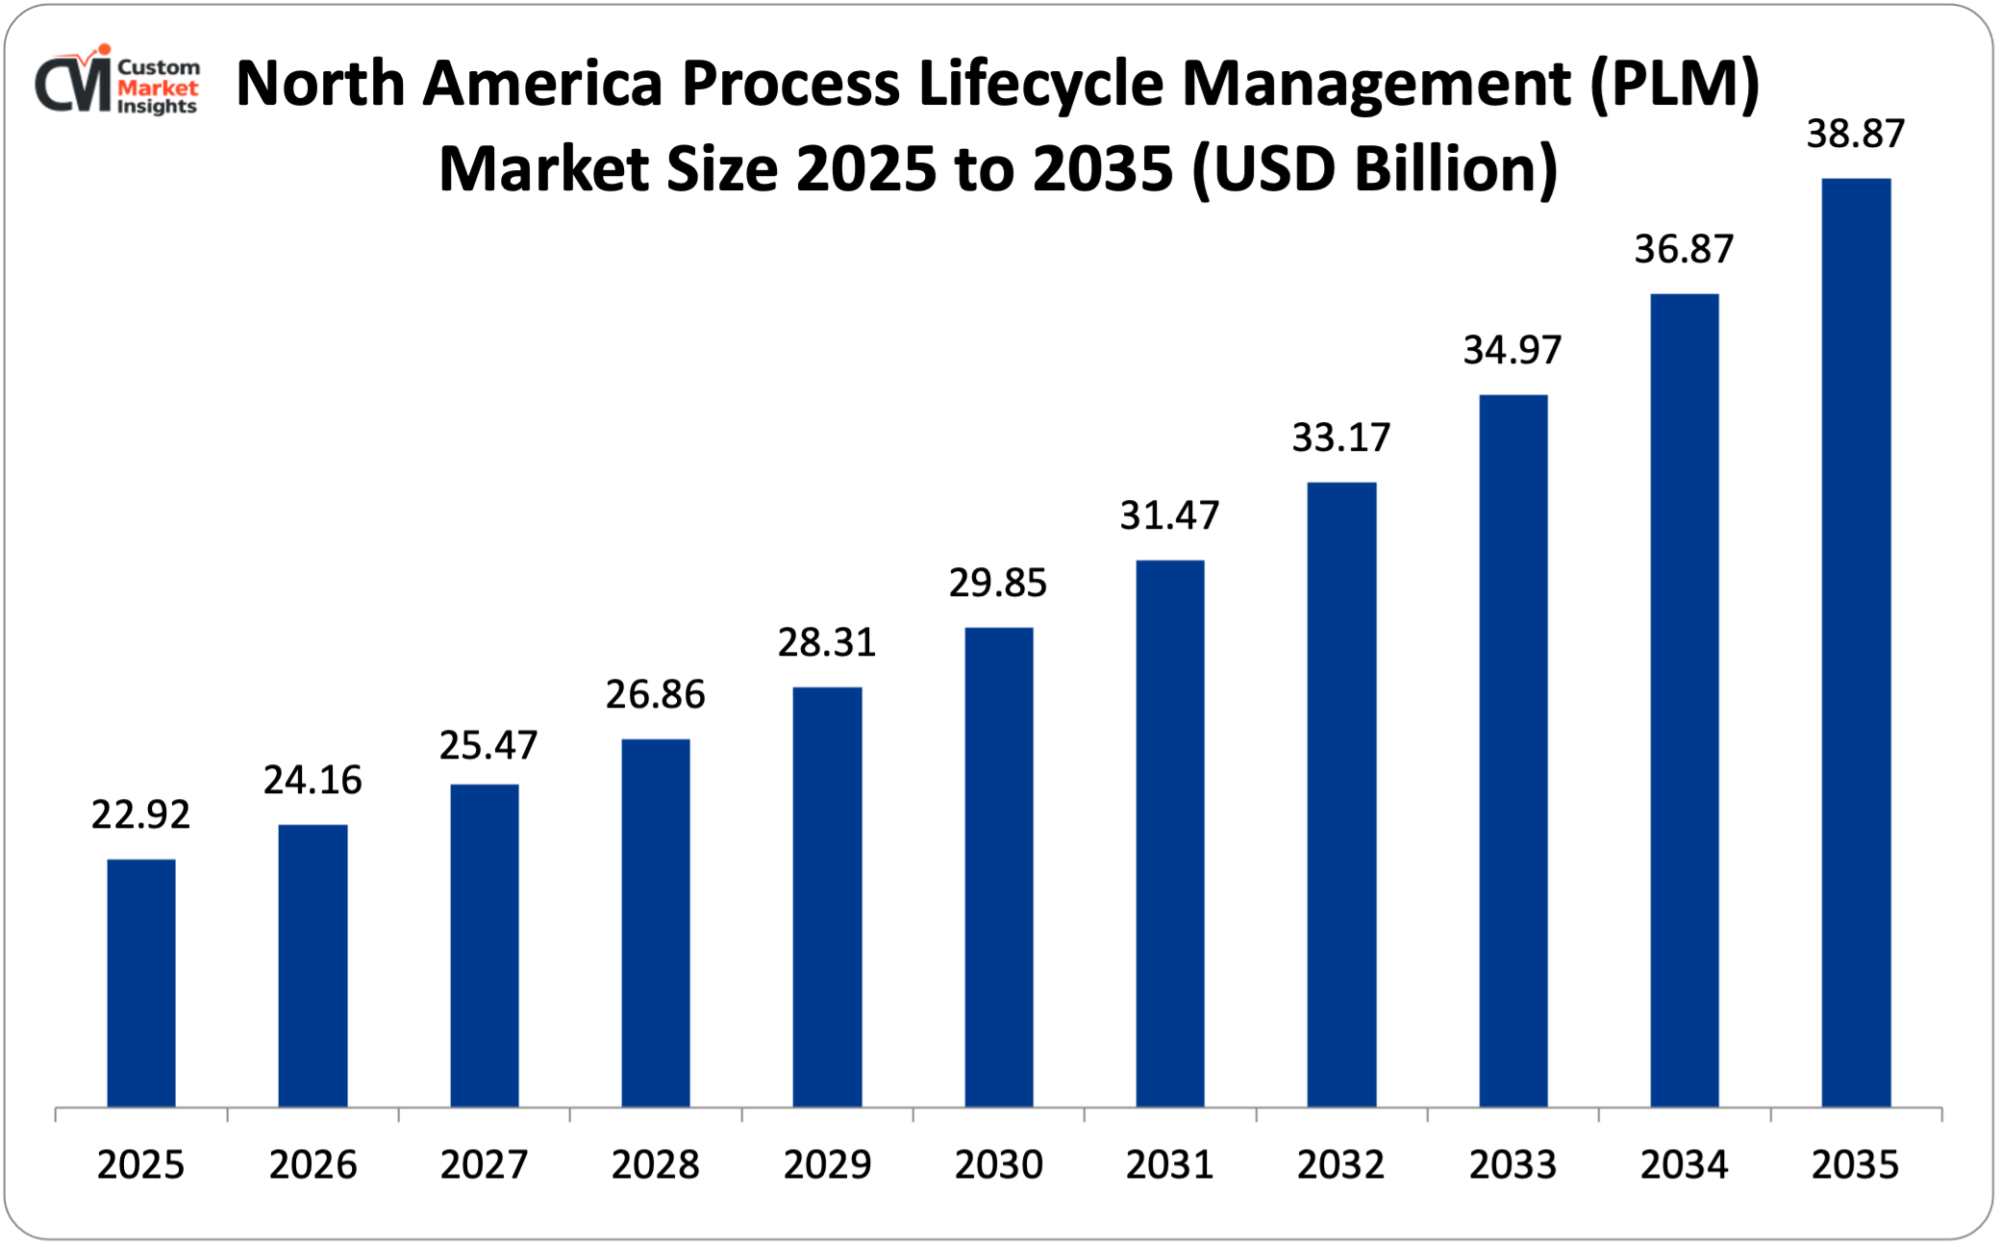
The North America Process Lifecycle Management market size is estimated at USD 22.92 billion in 2025 and is projected to reach approximately USD 38.87 billion by 2035, with a 6.4% CAGR from 2026 to 2035.
Why did North America Dominate the Market in 2025?
This and many other factors can see North America contributing significantly to the global aspect with an estimated market share of approximately 39% in 2025 since it has several factors affecting the same such as the concentration of advanced manufacturing industries including automotive, aerospace and electronics, early adoption of digital technologies and Industry 4.0 initiatives, major PLM software vendors and technology innovation centers, high overall R&D investments averaging 2.8% of GDP across the region and well-established quality and compliance standards which drive adoption of PLM. The area has an advanced manufacturing ecosystem where the United States alone produces 17% of the total manufacturing output worth USD 2.5 trillion per year according to the National Association of manufacturers. One of the most challenging PLM settings, the aerospace and defense industry, the main hub of which is the United States, with Boeing, Lockheed Martin, Northrop Grumman, and Raytheon Technologies, has 30-40-year-long programs, and the number of parts to be managed globally is in the millions. The medical device market, which is USD 180 billion in the U.S. market, is extremely regulated by the FDA regulations including 21 CFR Part 820 Quality System Regulations that impose extensive design control and traceability features that the PLM systems offer.
US Market Trends
The big automotive market, the clustering of aerospace and defense prime contractors, the pharmaceutical and medical device market with high compliance standards of the FDA, the existence of Silicon Valley and technology innovation centers that spurred the use of electronics PLM, and government programs favoring advanced manufacturing all cause the United States to be the most important market. The manufacturing industry in the U.S. has 12.9 million employees and provides USD 2.5 trillion to GDP, and capital equipment expenditure of USD 350 billion annually generates consistent demand for PLM solutions. The CHIPS and Science Act, which is providing USD 52 billion to semiconductor manufacturers, is also spurring PLM investment as intellectual companies such as Intel, TSMC and Samsung erect high-tech fabrication operations that need sophisticated product data management. PLM in construction equipment, industrial machinery, and energy industries is being propelled by the Infrastructure Investment and Jobs Act, which gives USD 1.2 trillion in infrastructure modernization.
Why is Asia Pacific Experiencing Rapid Growth?
Asia Pacific is the most developing with a projected CAGR of 8.2% in 2026-2035, an indicator of rapid industrialization and manufacturing growth in the region especially in China and India, the rising electronics and semiconductor manufacturing industries, advancing automotive manufacturing capacity with China manufacturing 30.2 million vehicles annually in 2024, government efforts to adopt digital manufacturing and Industry 4.0 and the surfacing of local PM vendors with competitive cost-effective solutions. In 2024, the output of manufacturing in China was USD 4.9 trillion, which is 28% of the world’s manufacturing, and this imposes massive demands on the PLM system in order to handle the complexity and quality of the products.
China Market Trends
The large production foundation which is a mix of automobile, electronics, machinery, and consumer products, the fast uptake of electric vehicles where BYD, NIO, and XPeng have advanced PLM systems, the government policies such as Made in China 2025 and Digital China which encourage smart manufacturing; and the progressive quality and compliance requirements leading to the adoption of PLM characterize the Chinese market. In 2024, China manufactured 30.2 million vehicles of which 9.5 million are EVs, and the advanced PLM is necessary to support the use of complex electrified powertrains and autonomous driving systems. Electronics industry (60% of all smartphones and computers worldwide) has adopted PLM to handle the product lifecycle of 12-18 months which involves thousands of variants of components.
Why is Europe Focusing on Sustainability and Regulatory Compliance?
Characteristics of the European market are the presence of strict regulatory demands such as REACH, RoHS, and the Corporate Sustainability Reporting Directive (CSRD); an effective automotive industry, which includes Volkswagen, BMW, Mercedes-Benz, and top suppliers, the focus on sustainability and circular economy concepts, which influences PLM investments, the aerospace industry, which is concentrated in France, Germany, and UK, and the pharmaceutical industry, which is located in Switzerland, Germany, and Ireland. PLM investments are being stimulated by the fact that Europe will produce 17.5 million vehicles in 2024, and the electric vehicle revolution as the EU requires 100.0% zero-emission vehicles by 2035. The Industry 4.0 initiative has established Germany as one of the pioneers of smart manufacturing and 72% of German manufacturers were adopting Industry 4.0 technologies, making Germany one of the driving forces behind adopting PLM as the entryway to digitalization.
Germany Market Trends
Germany has the largest European market due to the automotive industry, which is leading the world (especially Volkswagen Group with the production of 9.2 million vehicles worldwide in 2024), the sector of strong industrial machinery and equipment making (Siemens, Bosch, and Thyssenkrupp), the pharmaceutical sector (with large research and development centers); and the intention of the government to develop Industry 4.0 and advanced manufacturing. German manufacturers spend 3.1% of revenues on research and development, which is one of the highest in the world, and promote advanced PLM needs of complicated product development.
Why is the Middle East & Africa Region Experiencing Growth?
The region of LAMEA is marked by increasing market development owing to the industrialization efforts in the Gulf Cooperation Council countries, the emergence of the automotive assembly and manufacturing industries, government diversification programs that are less reliant on the oil revenues, infrastructure development projects that need management of the industrial equipment, and rising use of international quality standards. Vision 2030 of Saudi Arabia is putting huge investments in manufacturing diversification, whereas the UAE has positioned itself as a regional destination for aerospace maintenance, repair, and overhaul (MRO) activities that demand advanced PLM abilities.
Top Players in the Market and Their Offerings
- Siemens AG
- Dassault Systèmes SE
- PTC Inc.
- SAP SE
- Oracle Corporation
- Autodesk Inc.
- Aras Corporation
- Arena Solutions (PTC)
- Propel Software
- Infor Inc.
- Others
Key Developments
The market has undergone significant developments as industry participants seek to expand capabilities and enhance product portfolios.
- In April 2025: Siemens Digital Industries Software announced the expansion of their Teamcenter X cloud-native PLM platform with new AI-powered capabilities for automated design validation and predictive quality management, demonstrating the industry’s shift toward intelligent, cloud-based solutions. In May 2025: Dassault Systèmes released 3DEXperience Platform 2025x. It will have an improved sustainability evaluation application and digital twin that monitors the carbon footprint of a product in real-time through its lifecycle, in line with increased demand to enable environmental regulation features.
These strategic activities have allowed companies to strengthen market positions, expand product offerings, enhance technological capabilities, and capitalize on growth opportunities within the expanding market.
The Process Lifecycle Management Market is segmented as follows:
By Deployment
- Cloud-based
- On-premise
- Hybrid
By Organization Size
- Large Enterprises
- Small and Medium Enterprises
By Application
- Product Design and Development
- Manufacturing Process Management
- Quality Management
- Compliance Management
- Supply Chain Collaboration
- Service and Maintenance Management
- Other Applications
By End-User Industry
- Automotive
- Aerospace and Defense
- Electronics and Semiconductors
- Industrial Machinery
- Consumer Goods
- Pharmaceuticals
- Food and Beverage
- Energy and Utilities
- Other Industries
Regional Coverage:
North America
- U.S.
- Canada
- Mexico
- Rest of North America
Europe
- Germany
- France
- U.K.
- Russia
- Italy
- Spain
- Netherlands
- Rest of Europe
Asia Pacific
- China
- Japan
- India
- New Zealand
- Australia
- South Korea
- Taiwan
- Rest of Asia Pacific
The Middle East & Africa
- Saudi Arabia
- UAE
- Egypt
- Kuwait
- South Africa
- Rest of the Middle East & Africa
Latin America
- Brazil
- Argentina
- Rest of Latin America
Table of Contents
- Chapter 1. Preface
- 1.1 Report Description and Scope
- 1.2 Research scope
- 1.3 Research methodology
- 1.3.1 Market Research Type
- 1.3.2 Market research methodology
- Chapter 2. Executive Summary
- 2.1 Global Process Lifecycle Management Market, (2026 – 2035) (USD Billion)
- 2.2 Global Process Lifecycle Management Market: snapshot
- Chapter 3. Global Process Lifecycle Management Market – Industry Analysis
- 3.1 Process Lifecycle Management Market: Market Dynamics
- 3.2 Market Drivers
- 3.2.1 Digital Transformation and Industry 4.0 Integration
- 3.2.2 Increasing Product Complexity and Regulatory Requirements
- 3.3 Market Restraints
- 3.4 Market Opportunities
- 3.5 Market Challenges
- 3.6 Porter’s Five Forces Analysis
- 3.7 Market Attractiveness Analysis
- 3.7.1 Market attractiveness analysis By Deployment
- 3.7.2 Market attractiveness analysis By Organization Size
- 3.7.3 Market attractiveness analysis By Application
- 3.7.4 Market attractiveness analysis By End-User Industry
- Chapter 4. Global Process Lifecycle Management Market- Competitive Landscape
- 4.1 Company market share analysis
- 4.1.1 Global Process Lifecycle Management Market: company market share, 2025
- 4.2 Strategic development
- 4.2.1 Acquisitions & mergers
- 4.2.2 New Product launches
- 4.2.3 Agreements, partnerships, collaborations, and joint ventures
- 4.2.4 Research and development and Regional expansion
- 4.3 Price trend analysis
- 4.1 Company market share analysis
- Chapter 5. Global Process Lifecycle Management Market – Deployment Analysis
- 5.1 Global Process Lifecycle Management Market overview: By Deployment
- 5.1.1 Global Process Lifecycle Management Market share, By Deployment, 2025 and 2035
- 5.2 Cloud-based
- 5.2.1 Global Process Lifecycle Management Market by Cloud-based, 2026 – 2035 (USD Billion)
- 5.3 On-premise
- 5.3.1 Global Process Lifecycle Management Market by On-premise, 2026 – 2035 (USD Billion)
- 5.4 Hybrid
- 5.4.1 Global Process Lifecycle Management Market by Hybrid, 2026 – 2035 (USD Billion)
- 5.1 Global Process Lifecycle Management Market overview: By Deployment
- Chapter 6. Global Process Lifecycle Management Market – Organization Size Analysis
- 6.1 Global Process Lifecycle Management Market overview: By Organization Size
- 6.1.1 Global Process Lifecycle Management Market share, By Organization Size, 2025 and 2035
- 6.2 Large Enterprises
- 6.2.1 Global Process Lifecycle Management Market by Large Enterprises, 2026 – 2035 (USD Billion)
- 6.3 Small and Medium Enterprises
- 6.3.1 Global Process Lifecycle Management Market by Small and Medium Enterprises, 2026 – 2035 (USD Billion)
- 6.1 Global Process Lifecycle Management Market overview: By Organization Size
- Chapter 7. Global Process Lifecycle Management Market – Application Analysis
- 7.1 Global Process Lifecycle Management Market overview: By Application
- 7.1.1 Global Process Lifecycle Management Market share, By Application, 2025 and 2035
- 7.2 Product Design and Development
- 7.2.1 Global Process Lifecycle Management Market by Product Design and Development, 2026 – 2035 (USD Billion)
- 7.3 Manufacturing Process Management
- 7.3.1 Global Process Lifecycle Management Market by Manufacturing Process Management, 2026 – 2035 (USD Billion)
- 7.4 Quality Management
- 7.4.1 Global Process Lifecycle Management Market by Quality Management, 2026 – 2035 (USD Billion)
- 7.5 Compliance Management
- 7.5.1 Global Process Lifecycle Management Market by Compliance Management, 2026 – 2035 (USD Billion)
- 7.6 Supply Chain Collaboration
- 7.6.1 Global Process Lifecycle Management Market by Supply Chain Collaboration, 2026 – 2035 (USD Billion)
- 7.7 Service and Maintenance Management
- 7.7.1 Global Process Lifecycle Management Market by Service and Maintenance Management, 2026 – 2035 (USD Billion)
- 7.8 Other Applications
- 7.8.1 Global Process Lifecycle Management Market by Other Applications, 2026 – 2035 (USD Billion)
- 7.1 Global Process Lifecycle Management Market overview: By Application
- Chapter 8. Global Process Lifecycle Management Market – End-User Industry Analysis
- 8.1 Global Process Lifecycle Management Market overview: By End-User Industry
- 8.1.1 Global Process Lifecycle Management Market share, By End-User Industry, 2025 and 2035
- 8.2 Automotive
- 8.2.1 Global Process Lifecycle Management Market by Automotive, 2026 – 2035 (USD Billion)
- 8.3 Aerospace and Defense
- 8.3.1 Global Process Lifecycle Management Market by Aerospace and Defense, 2026 – 2035 (USD Billion)
- 8.4 Electronics and Semiconductors
- 8.4.1 Global Process Lifecycle Management Market by Electronics and Semiconductors, 2026 – 2035 (USD Billion)
- 8.5 Industrial Machinery
- 8.5.1 Global Process Lifecycle Management Market by Industrial Machinery, 2026 – 2035 (USD Billion)
- 8.6 Consumer Goods
- 8.6.1 Global Process Lifecycle Management Market by Consumer Goods, 2026 – 2035 (USD Billion)
- 8.7 Pharmaceuticals
- 8.7.1 Global Process Lifecycle Management Market by Pharmaceuticals, 2026 – 2035 (USD Billion)
- 8.8 Food and Beverage
- 8.8.1 Global Process Lifecycle Management Market by Food and Beverage, 2026 – 2035 (USD Billion)
- 8.9 Energy and Utilities
- 8.9.1 Global Process Lifecycle Management Market by Energy and Utilities, 2026 – 2035 (USD Billion)
- 8.10 Other Industries
- 8.10.1 Global Process Lifecycle Management Market by Other Industries, 2026 – 2035 (USD Billion)
- 8.1 Global Process Lifecycle Management Market overview: By End-User Industry
- Chapter 9. Process Lifecycle Management Market – Regional Analysis
- 9.1 Global Process Lifecycle Management Market Regional Overview
- 9.2 Global Process Lifecycle Management Market Share, by Region, 2025 & 2035 (USD Billion)
- 9.3. North America
- 9.3.1 North America Process Lifecycle Management Market, 2026 – 2035 (USD Billion)
- 9.3.1.1 North America Process Lifecycle Management Market, by Country, 2026 – 2035 (USD Billion)
- 9.3.1 North America Process Lifecycle Management Market, 2026 – 2035 (USD Billion)
- 9.4 North America Process Lifecycle Management Market, by Deployment, 2026 – 2035
- 9.4.1 North America Process Lifecycle Management Market, by Deployment, 2026 – 2035 (USD Billion)
- 9.5 North America Process Lifecycle Management Market, by Organization Size, 2026 – 2035
- 9.5.1 North America Process Lifecycle Management Market, by Organization Size, 2026 – 2035 (USD Billion)
- 9.6 North America Process Lifecycle Management Market, by Application, 2026 – 2035
- 9.6.1 North America Process Lifecycle Management Market, by Application, 2026 – 2035 (USD Billion)
- 9.7 North America Process Lifecycle Management Market, by End-User Industry, 2026 – 2035
- 9.7.1 North America Process Lifecycle Management Market, by End-User Industry, 2026 – 2035 (USD Billion)
- 9.8. Europe
- 9.8.1 Europe Process Lifecycle Management Market, 2026 – 2035 (USD Billion)
- 9.8.1.1 Europe Process Lifecycle Management Market, by Country, 2026 – 2035 (USD Billion)
- 9.8.1 Europe Process Lifecycle Management Market, 2026 – 2035 (USD Billion)
- 9.9 Europe Process Lifecycle Management Market, by Deployment, 2026 – 2035
- 9.9.1 Europe Process Lifecycle Management Market, by Deployment, 2026 – 2035 (USD Billion)
- 9.10 Europe Process Lifecycle Management Market, by Organization Size, 2026 – 2035
- 9.10.1 Europe Process Lifecycle Management Market, by Organization Size, 2026 – 2035 (USD Billion)
- 9.11 Europe Process Lifecycle Management Market, by Application, 2026 – 2035
- 9.11.1 Europe Process Lifecycle Management Market, by Application, 2026 – 2035 (USD Billion)
- 9.12 Europe Process Lifecycle Management Market, by End-User Industry, 2026 – 2035
- 9.12.1 Europe Process Lifecycle Management Market, by End-User Industry, 2026 – 2035 (USD Billion)
- 9.13. Asia Pacific
- 9.13.1 Asia Pacific Process Lifecycle Management Market, 2026 – 2035 (USD Billion)
- 9.13.1.1 Asia Pacific Process Lifecycle Management Market, by Country, 2026 – 2035 (USD Billion)
- 9.13.1 Asia Pacific Process Lifecycle Management Market, 2026 – 2035 (USD Billion)
- 9.14 Asia Pacific Process Lifecycle Management Market, by Deployment, 2026 – 2035
- 9.14.1 Asia Pacific Process Lifecycle Management Market, by Deployment, 2026 – 2035 (USD Billion)
- 9.15 Asia Pacific Process Lifecycle Management Market, by Organization Size, 2026 – 2035
- 9.15.1 Asia Pacific Process Lifecycle Management Market, by Organization Size, 2026 – 2035 (USD Billion)
- 9.16 Asia Pacific Process Lifecycle Management Market, by Application, 2026 – 2035
- 9.16.1 Asia Pacific Process Lifecycle Management Market, by Application, 2026 – 2035 (USD Billion)
- 9.17 Asia Pacific Process Lifecycle Management Market, by End-User Industry, 2026 – 2035
- 9.17.1 Asia Pacific Process Lifecycle Management Market, by End-User Industry, 2026 – 2035 (USD Billion)
- 9.18. Latin America
- 9.18.1 Latin America Process Lifecycle Management Market, 2026 – 2035 (USD Billion)
- 9.18.1.1 Latin America Process Lifecycle Management Market, by Country, 2026 – 2035 (USD Billion)
- 9.18.1 Latin America Process Lifecycle Management Market, 2026 – 2035 (USD Billion)
- 9.19 Latin America Process Lifecycle Management Market, by Deployment, 2026 – 2035
- 9.19.1 Latin America Process Lifecycle Management Market, by Deployment, 2026 – 2035 (USD Billion)
- 9.20 Latin America Process Lifecycle Management Market, by Organization Size, 2026 – 2035
- 9.20.1 Latin America Process Lifecycle Management Market, by Organization Size, 2026 – 2035 (USD Billion)
- 9.21 Latin America Process Lifecycle Management Market, by Application, 2026 – 2035
- 9.21.1 Latin America Process Lifecycle Management Market, by Application, 2026 – 2035 (USD Billion)
- 9.22 Latin America Process Lifecycle Management Market, by End-User Industry, 2026 – 2035
- 9.22.1 Latin America Process Lifecycle Management Market, by End-User Industry, 2026 – 2035 (USD Billion)
- 9.23. The Middle-East and Africa
- 9.23.1 The Middle-East and Africa Process Lifecycle Management Market, 2026 – 2035 (USD Billion)
- 9.23.1.1 The Middle-East and Africa Process Lifecycle Management Market, by Country, 2026 – 2035 (USD Billion)
- 9.23.1 The Middle-East and Africa Process Lifecycle Management Market, 2026 – 2035 (USD Billion)
- 9.24 The Middle-East and Africa Process Lifecycle Management Market, by Deployment, 2026 – 2035
- 9.24.1 The Middle-East and Africa Process Lifecycle Management Market, by Deployment, 2026 – 2035 (USD Billion)
- 9.25 The Middle-East and Africa Process Lifecycle Management Market, by Organization Size, 2026 – 2035
- 9.25.1 The Middle-East and Africa Process Lifecycle Management Market, by Organization Size, 2026 – 2035 (USD Billion)
- 9.26 The Middle-East and Africa Process Lifecycle Management Market, by Application, 2026 – 2035
- 9.26.1 The Middle-East and Africa Process Lifecycle Management Market, by Application, 2026 – 2035 (USD Billion)
- 9.27 The Middle-East and Africa Process Lifecycle Management Market, by End-User Industry, 2026 – 2035
- 9.27.1 The Middle-East and Africa Process Lifecycle Management Market, by End-User Industry, 2026 – 2035 (USD Billion)
- Chapter 10. Company Profiles
- 10.1 Siemens AG
- 10.1.1 Overview
- 10.1.2 Financials
- 10.1.3 Product Portfolio
- 10.1.4 Business Strategy
- 10.1.5 Recent Developments
- 10.2 Dassault Systèmes SE
- 10.2.1 Overview
- 10.2.2 Financials
- 10.2.3 Product Portfolio
- 10.2.4 Business Strategy
- 10.2.5 Recent Developments
- 10.3 PTC Inc.
- 10.3.1 Overview
- 10.3.2 Financials
- 10.3.3 Product Portfolio
- 10.3.4 Business Strategy
- 10.3.5 Recent Developments
- 10.4 SAP SE
- 10.4.1 Overview
- 10.4.2 Financials
- 10.4.3 Product Portfolio
- 10.4.4 Business Strategy
- 10.4.5 Recent Developments
- 10.5 Oracle Corporation
- 10.5.1 Overview
- 10.5.2 Financials
- 10.5.3 Product Portfolio
- 10.5.4 Business Strategy
- 10.5.5 Recent Developments
- 10.6 Autodesk Inc.
- 10.6.1 Overview
- 10.6.2 Financials
- 10.6.3 Product Portfolio
- 10.6.4 Business Strategy
- 10.6.5 Recent Developments
- 10.7 Aras Corporation
- 10.7.1 Overview
- 10.7.2 Financials
- 10.7.3 Product Portfolio
- 10.7.4 Business Strategy
- 10.7.5 Recent Developments
- 10.8 Arena Solutions (PTC)
- 10.8.1 Overview
- 10.8.2 Financials
- 10.8.3 Product Portfolio
- 10.8.4 Business Strategy
- 10.8.5 Recent Developments
- 10.9 Propel Software
- 10.9.1 Overview
- 10.9.2 Financials
- 10.9.3 Product Portfolio
- 10.9.4 Business Strategy
- 10.9.5 Recent Developments
- 10.10 Infor Inc.
- 10.10.1 Overview
- 10.10.2 Financials
- 10.10.3 Product Portfolio
- 10.10.4 Business Strategy
- 10.10.5 Recent Developments
- 10.11 Others.
- 10.11.1 Overview
- 10.11.2 Financials
- 10.11.3 Product Portfolio
- 10.11.4 Business Strategy
- 10.11.5 Recent Developments
- 10.1 Siemens AG
List Of Figures
Figures No 1 to 39
List Of Tables
Tables No 1 to 102
Prominent Player
- Siemens AG
- Dassault Systèmes SE
- PTC Inc.
- SAP SE
- Oracle Corporation
- Autodesk Inc.
- Aras Corporation
- Arena Solutions (PTC)
- Propel Software
- Infor Inc.
- Others
FAQs
The key players in the market are: Siemens AG, Dassault Systèmes SE, PTC Inc., SAP SE, Oracle Corporation, Autodesk Inc., Aras Corporation, Arena Solutions (PTC), Propel Software, Infor Inc., and others.
The government regulations are significant to the market as they affect product safety and compliance standards such as automotive ISO 26262 functional safety and medical device ISO 13485 quality management standards that requires detailed design traceability, environmental regulations such as EU REACH chemical compliance and RoHS restricted substances and WEEE waste electrical equipment requirements, industry specific compliance such as FDA 21 CFR Part 11 on pharmaceuticals requiring electronic record integrity and audit trails, aerospace AS9100 quality standards and ITAR export controls on defense products and sustainability reporting such as the EU Corporate Investment programs arranged by the government stimulate the use of PLM heavily, including the U.S. CHIPS and Science Act investing USD 52 billion in semiconductor production, the Infrastructure Investment and Jobs Act of 2021 investing USD 1.2 trillion in modern infrastructure development creating the industrial equipment PLM requirements, the European Green Deal with 55% emission reduction goals by 2030 that necessitate sustainability-focused PLM technologies, and the Made in China 2025 initiative of China that advances the idea of smart manufacturing and Industry.
Process Lifecycle Management systems are very serious investments whose prices are very differentiated based on the deployment model, size of the organization, and scope of functions. PLM subscriptions cost USD 100-300 per person per month based on the types of basic solutions, and USD 400-800 based on the advanced engineering solutions, with typical enterprise systems of 200-500 users costing USD 240,000 to USD 2.4 million per year in subscription costs. Enterprise PLM implementations have a minimum cost of USD 1 million when used by SMEs and USD 50 million and above when used by global Fortune 500 companies including software licenses (USD 500,000 to USD 10 million), implementation services (40-60% of license costs), infrastructure and hardware (USD 200,000 to USD 5 million), and training and change management (15-20% of total costs). However, these investments have strong reasons to support them, which include a 20-30% cut on product development expenditures, a 25-40% faster time-to-market so revenue generation can be done sooner, a 35-45% cut on manufacturing engineering time, a 30-50% cut on prototype expenses on the basis of simulation-based design, and 10-15 years operational life cycle where constant value delivery can be done. Enabling market growth into small-served markets Cloud-based models have opened access to PLM to SMEs whose entry fee of USD 5,000-50,000/year is significantly lower than conventional on-premise systems that have minimum entry fees of USD 500,000+, and they are expanding the market further into the untapped segment.
The current analysis has estimated that the market will grow to approximately USD 112.45 billion in 2035 with a high growth rate of 6.95% throughout 2026-35 which is attributed to the ongoing digital transformation process in manufacturing industries, the complexity of products that need more sophisticated lifecycle management, the expansion of cloud-based PLM which has lowered the barriers of adoption by SMEs, the integration of AI and machine learning that has improved PLM functionalities, the growing attention to sustainability and the circular economy that has contributed to the functions of environmental compliance, and the development of Model.
North America will remain at the top of the revenue share with an estimated 39% share of the global market primarily due to the concentration of advanced manufacturing sectors which include aerospace that produces USD 180 billion of annual output, the automotive sector with major OEMs and engineering centers, the presence of leading PLM vendors such as PTC, Siemens Digital Industries, and Oracle with headquarters in the region, the mature regulatory environment that generates compliance-based PLM adoption, the significant R&D expenditures of 2.8% of the average GDP generation of sophisticated product development.
The best growth rate is in the Asia-Pacific region with 8.2% CAGR and robust growth trend because of the rapid industrialization and manufacturing growth specifically in China and India, the large electronics and semiconductor industry, which manufactures 60% of all smartphones in the world, the automotive industry whereby China produces 30.2 million vehicles and 9.5 million EVs in 2024, the government policies like Made in China 2025 and Industry 4.0 adoption programs, the increasing middle class of the population that drives consumer goods demand, and investment.
The Global Process Lifecycle Management Market is projected to have mushrooming growth in the face of the accelerating rate of digital transformation programs in place with 78% of manufacturers having instituted comprehensive programs, the rising product complexity with modern vehicles containing 30,000+ parts and 100 million lines of code, the increasing rate of regulatory compliance programs in all industries, the USD 14.3 trillion global manufacturing industry adopting Industry 4.0 programs, the 20-30% productivity gains through implementation of the 5PLM approach, and the rapidly fast.