Recycled PET Market Size, Trends and Insights By Product (Clear, Colored), By End Use (Fiber, Strapping, Sheet and Film, Non-Food Containers and Bottles, Food & Beverage Containers and Bottles, Others), and By Region - Global Industry Overview, Statistical Data, Competitive Analysis, Share, Outlook, and Forecast 2026 – 2035
Report Snapshot
CAGR: 8.3%
| Study Period: | 2026-2035 |
| Fastest Growing Market: | Europe |
| Largest Market: | Asia Pacific |
Major Players
- Amcor Ltd
- PLACON
- PolyQuest
- Evergreen Plastics Inc.
- Others
Reports Description
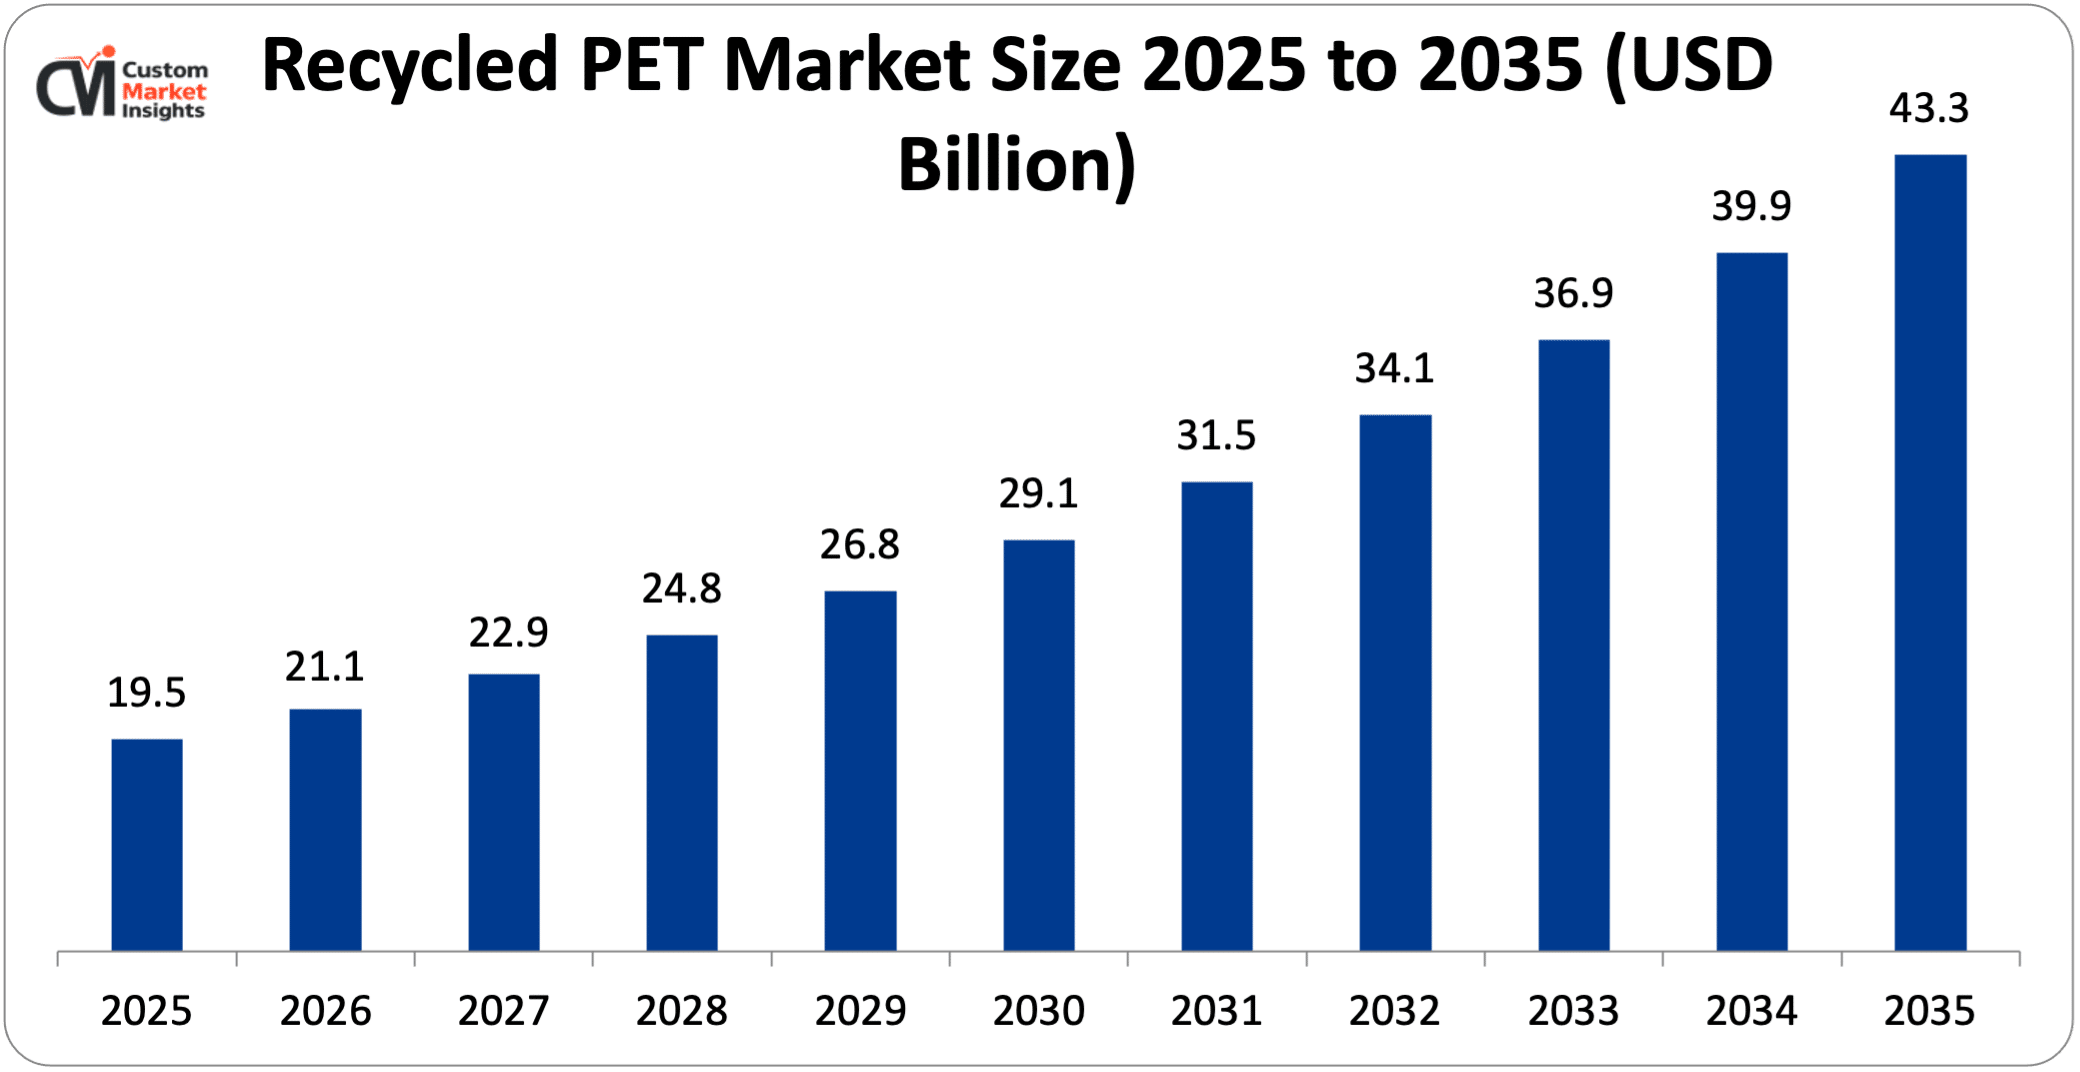
The market size of global recycled PET will be estimated at USD 19.5 billion in 2025 and is expected to grow to between USD 21.1 billion in 2026 and about USD 43.3 billion by 2035, with a current CAGR (compound annual growth rate) of 8.3% during the period of 2026 to 2035. PET recycled material or recycled polyethylene terephthalate (rPET). Producers make rPET by gathering and repurposing PET waste materials produced from packaging products and bottles.
The manufacturing of rPET through the recycling method transforms post-recycling and post-industrial waste to products in the form of flakes or pellets by using chemical and physical procedures that depend on virgin PET sources from the petrochemical industries. This material cannot affect the general PET properties, such as strength, lightweight, and transparent attitude, that have originally been applied to produce packaging, fiber textiles, auto parts, and consumer goods. It is the way for companies to achieve their hardest aim to reach the highest points of sustainability using rPET by reducing the replacement of virgin material and minimizing the emission of greenhouse gases.
Market Highlight
- In 2025, the Asia Pacific will dominate the global market with an estimated market share of 45%. Increasing innovative product launches drives the regional expansion.
- Europe is growing at the highest CAGR over the analysis period. The increasing circular economy trend drives the industry growth.
- By product, the clear segment accounted for the highest revenue share of over 75% in 2025.
- By end use, the fiber segment would have the highest share of the market in 2025 0f 40%.
Significant Growth Factors
The recycled PET market trends present significant growth opportunities due to several factors:
- Strong Environmental & Sustainability Pressure: Environmental and sustainability pressure is a critical incentive for the emergence of the rPET market. Growing international awareness and concern about global garbage patches, landfills, and floating sea waste has driven industry, business, and body politics to shift toward more sustainable, environmentally friendly alternatives. PET plastic, predominantly found in most bottles, along with many other package formats, is an enormous contributor to the depletion of the planet‘s supply of natural resources and has subsequently attracted regulatory and sustainability interests across the globe. Companies are increasingly opting to include rPET materials in their production balances in an effort to minimize carbon emissions and will ultimately help to reserve scarce natural supplies for future generations. However, points such as upcoming legislation e.g. recycled content standards and bans on single-use plastics, and increased eco-awareness of consumers and their subsequent choice of eco-friendly products are among the prevailing reasons originating the switch to rPET from virgin PET.
- Growing Demand From Packaging Industry: Demand from the packaging industry is also an important factor in the growth of the rPET market. Bottled drinks and food packaging are the largest demand pull for PET owing to its light weight, durability, and good barrier properties. A combination of regulatory pressure and companies’ commitments towards sustainability has been urging manufacturers to use rPET for bottles, containers, and trays. Major beverage and FPCCGs are clearly moving towards bottle-to-bottle recycling and are aiming to incorporate higher and higher percentages of recycled content in their packaging over time to stay aligned to societal and customer needs. Packaging consumption of the packaged goods is increasing due to urbanization, change of lifestyles, and e-commerce and delivery, which has led to more usage of sustainable packaging, which has been boosting the demand for recycled PET.
What are the Major Advances Changing the Recycled PET Market Today?
- Advanced Mechanical Recycling Improvements: Advances in mechanical recycling are now turning into a major propelling force driving innovations in rPET production, growth, and applications. Conventional mechanical recycling was often associated with inferior physical qualities, contamination, and a relatively narrow range of end-use applications. With advancements like optical sorting at the spot using AI and machine learning, conveyor sorting, near-infrared detection, and automated separation for higher sorting speeds and reduction of human error, there have been improvements in the reliability of sorting PET waste by color, grade, and purity levels; further improvements in washing, decontamination, separation, and filtration have helped to increase the purity of the recycled PET, subsequently reducing the admixture particles and labels in the PET flakes and, subsequently, the body and two-pack of the final PET bottles. If the technical parameters can be met and exceeded for the various regulatory standards for food contact applications, then PMMI is looking at a long-tracked road to success.
- Integration With Circular Economy Models: The integration with the models of the circular economy is one important trend that is pushing the development of the rPET market, as it is transforming the industry from a linear “produce–use–dispose” scheme to a sustainable one where bottles and packaging are continuously collected, recycled, and reincorporated again in the material stream. Systems like DRS schemes, landfill taxes, organized waste collection schemes, and EPR systems are promoting the enhancement of a feedstock with a higher quality, while companies are redesigning their packages to be more recyclable and increasing their use of rPET in their products. This integration with circular models is boosting the possibilities of the rPET market to develop and grow in the long term as stakeholders develop systems and processes to make the best use of the material.
Category Wise Insights
By Product
Why Does Clear Hold a Prominent Position in the Market?
The clear segment accounted for the highest revenue share of over 75% in 2025. The growth is due to its durability, lightweight nature, non-reactivity, and shatterproof properties. The growth will be driven by low energy requirements combined with easy bottle-to-bottle recycling. Clear rPET resists the growth of fungi, mold, and bacteria.
The colored segment is growing at the highest CAGR during the forecast period. Major end-use areas of colored rPET are automotive trays, in-process protective packaging, electronics & electrical packaging, containers, transit trays, healthcare packaging, and other plastic trays. Colored rPET is used in the production of fabrics & clothing, as well as various packaging end-uses. The ability of colored rPET to create a strong visual effect has made it increasingly important for food and non-food beverage manufacturers. The use of colored packaging helps brands establish their identity while creating distinct visual characteristics. Recent trends in the market have shown that milk and personal care packaging manufacturers are shifting from HDPE to colored rPET to reduce costs and move toward sustainability.
By End Use
Why Does Fiber Capture the Highest Market Share in the Recycled PET Market?
The fiber segment would have the highest share of the market in 2025 0f 40%. Various types of clothing, including t-shirts and jackets, utilize fiber produced from rPET. It is used to create automobile seat covers and sofa and chair seat covers and carpets. The low production cost of clothing combined with favorable government regulations will increase the demand for rPET.
The food & beverage containers and bottles segment is growing at a rapid rate over the projected period. The rising demand for food containers in developing markets of the Asia Pacific and the Middle East and Latin America will boost product requirements for sheet and film applications. The containers provide thermal insulation properties and visual appeal to products that they store. The sheet and film market is expanding because microwave-safe containers are increasing demand. Developed country customers choose microwave-safe food containers because they reduce their meal preparation time. The office environment uses these containers because their heat-resistant properties enable faster work. The demand for sheets and films in roof flooring applications is growing because these materials protect buildings from extreme temperature conditions through effective leakage control.
Report Scope
| Feature of the Report | Details |
| Market Size in 2026 | USD 21.1 billion |
| Projected Market Size in 2035 | USD 43.3 billion |
| Market Size in 2025 | USD 19.5 billion |
| CAGR Growth Rate | 8.3% CAGR |
| Base Year | 2025 |
| Forecast Period | 2026-2035 |
| Key Segment | By Product, End Use and Region |
| Report Coverage | Revenue Estimation and Forecast, Company Profile, Competitive Landscape, Growth Factors and Recent Trends |
| Regional Scope | North America, Europe, Asia Pacific, Middle East & Africa, and South & Central America |
| Buying Options | Request tailored purchasing options to fulfil your requirements for research. |
Regional Analysis
How Big is the Asia Pacific Recycled PET Market Size?
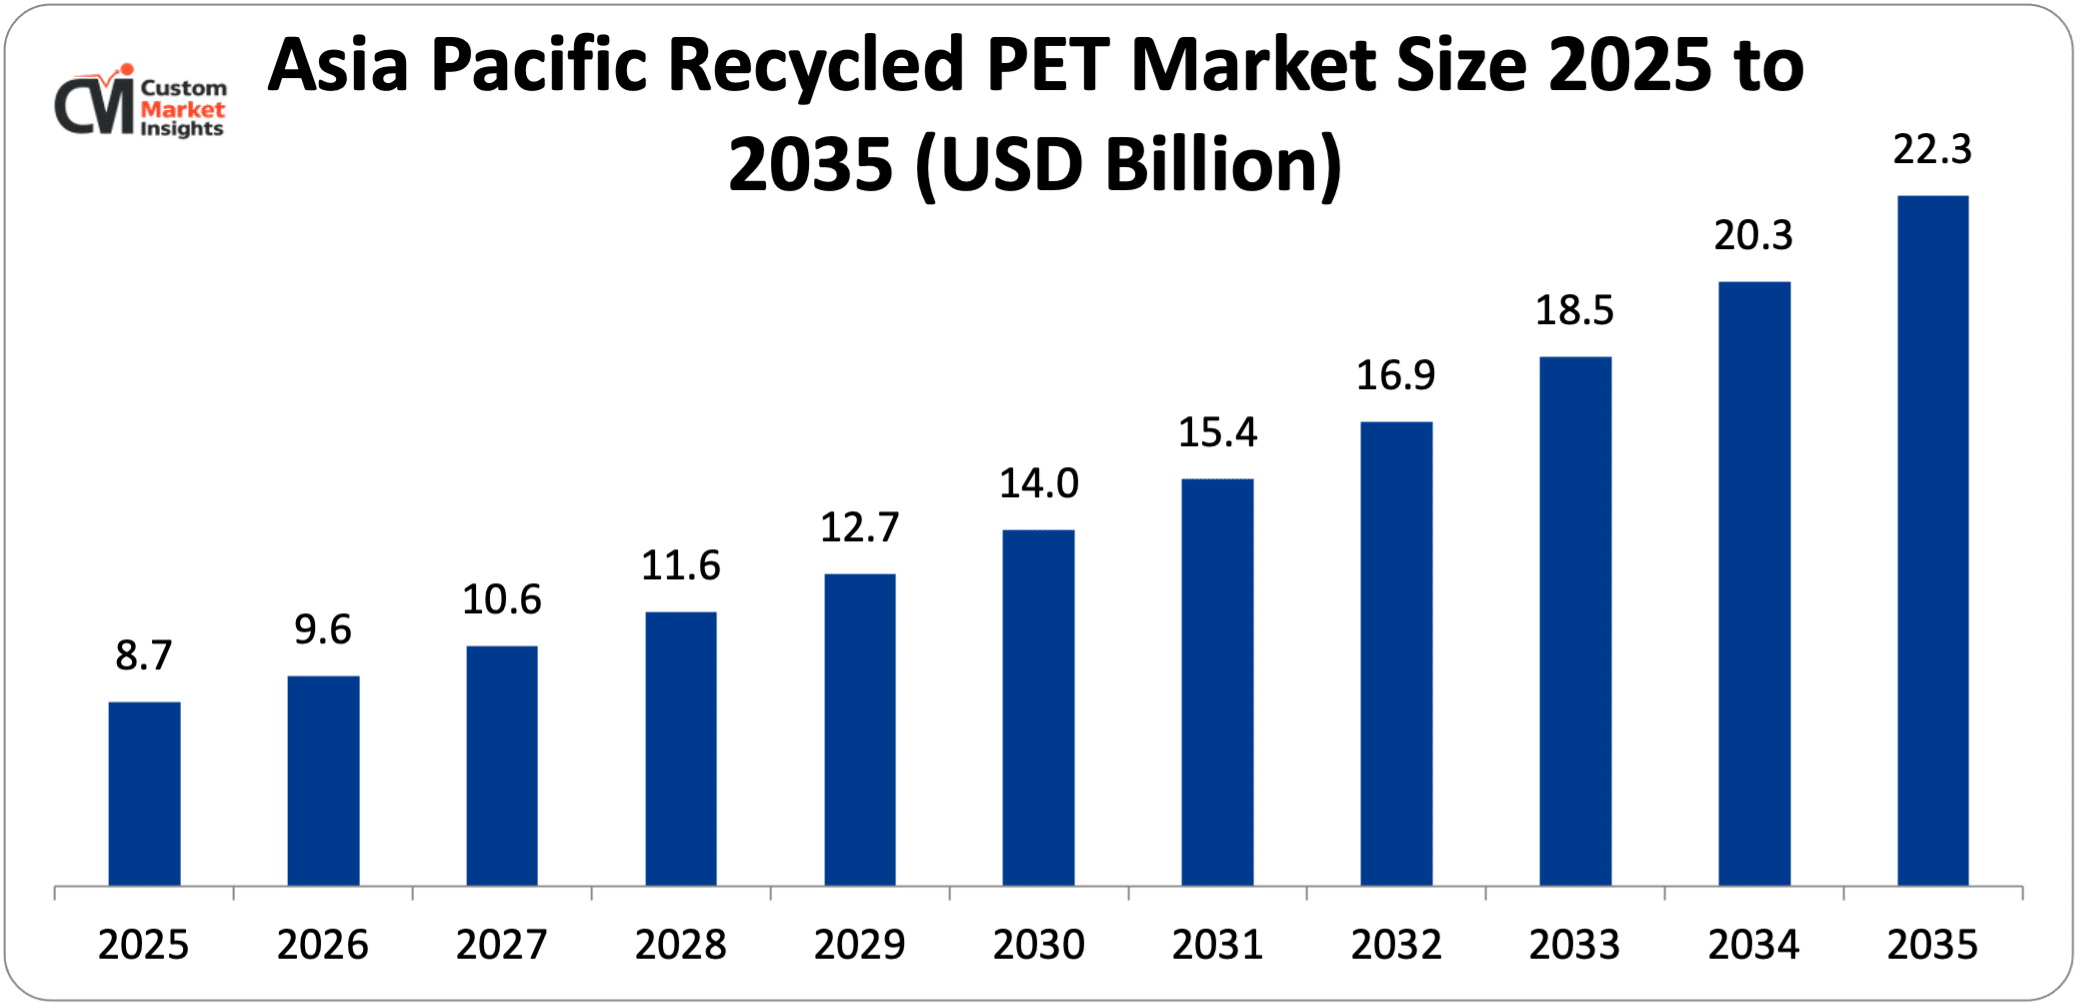
Its market size, in terms of the Asia Pacific recycled PET, is projected to be USD 8.7 billion in 2025 with a growth of about USD 22.3 billion in 2035 with a CAGR of 9.8% between 2026 and 2035.
Why did the Asia Pacific Dominate the Recycled PET Market in 2025?
In 2025, the Asia Pacific will dominate the global market with an estimated market share of 45%. The regional market consists of multiple active players who participate in its operations. Asia Pacific markets offer affordable access to large numbers of skilled workers and simple access to land. The production landscape has shifted toward emerging economies because of China’s and India’s economic growth, which will drive market expansion during the upcoming period. The region contains multiple fast-growing fields, such as construction and automotive and electronics, which offer extensive opportunities for rPET production companies.
China Recycled PET Market Trends
In the Asia Pacific region, China is growing at a significant rate over the projected period. The domestic policies in China, along with its industrial consolidation initiatives, have resulted in novel markets for PET recycling enterprises. It has reshaped the waste recycling values within the nation through setting up circular economy benchmarks and banning plastic imports. The contamination control pathway allows supply to fulfill the expanding trend of high-quality recycled content for home and international markets. The local mandates alone and high demand from packaging and apparel manufacturing industries sustain a steady appetite for food-grade rPET while tech innovation is enhancing product quality. Its industrial cluster building and investment in the contamination processing infrastructure have expanded its ability to manufacture high-end rPET.
Why is Europe Experiencing a Significant Growth in the Recycled PET Market?
Europe holds a significant market share in 2025. The European recycled polyethylene terephthalate industry has accelerated due to the EU regulation framework, with mandatory recycled-content requirements and strict waste export legislation redesigning supply chains. EU single-use plastics and packaging rules require producers to consistently include specific amounts of rPET, which stimulates the market for high-end flakes and pellets; effective EPR systems fund improvements in collection and sorting; common standards reduce quality friction and enable large-scale PET-to-PET recycling; and assurances from brands and retailers translate regulation into long-term commercial agreements.
UK Recycled PET Market Trends
The UK held the dominant position in the market in 2025. The UK’s rPET market growth stems from rising sustainable packaging needs across food and beverage and consumer goods industries, which receive support from improved recycling regulations that cut plastic waste. The UK market will receive sufficient plastic bottle material because collection rates are increasing and plastic bottle usage is rising while corporate needs for recycled materials and investments in advanced recycling technologies such as closed-loop systems will drive market expansion. The UK market will experience growth because of three factors, which include regulatory and CSR initiatives together with technological advancements and corporate demand.
Why is North America Growing at the Steady Rate in the Recycled PET Market?
North America is expected to grow at a steady rate over the projected period. The North American recycled polyethylene terephthalate market has experienced growth because of regulatory developments and brand procurement practices, which increased demand for rPET throughout the entire region. The implementation of state-level recycled-content requirements together with deposit return systems and developing EPR systems has compelled supply chains to modify their operations while increasing their basic standards for recyclables. Major beverage companies and consumer packaged goods firms are using science-based targets to obtain long-term material agreements that support their new sorting and reprocessing projects. Food-grade rPET capacity expansions have increased because of both established policies and corporate agreements.
US Recycled PET Market Trends
The US holds the prominent market share in the industry. The U.S. recycled polyethylene terephthalate industry has observed a patchwork of state mandates and commercial procurement rather than a single federal policy. Several states now require minimum PCR content for plastic packaging and are implementing producer responsibility rules that increase collection funding and design requirements. Beverage companies establish brand-level sourcing commitments, which generate stable market demand for domestic flake and pellet manufacturing. The current market conditions, which enhance feedstock economics, make advanced recycling and regional capacity investments more profitable.
Why is the Middle East & Africa Region is growing rapidly in the Recycled PET?
The MEA region is growing at a steady rate over the projected period. The rising demand for sustainable packaging solutions drives growth in the food, beverage, and personal care industries. The United Arab Emirates and South Africa have government programs that promote circular economy practices while decreasing plastic waste, and these programs drive the use of recycled materials.
UAE Recycled PET Market Trends
The UAE is growing at the highest CAGR during the forecast period. The increasing government initiatives and rising investment in the recycled PET market during the projected period.
Top Players in the Recycled PET Market and Their Offerings
- Amcor Ltd
- PLACON
- Clear Path Recycling LLC
- Verdeco Recycling Inc.
- Indorama Ventures Public Ltd.
- Zhejiang Anshun Pettechs Fibre Co. Ltd.
- PolyQuest
- Evergreen Plastics Inc.
- Phoenix Technologies
- Libolon
- Biffa
- PET RECYCLING TEAM
- MITSUI & CO. LTD.
- Revalyu
- TOMRA Systems ASA
- UL LLC
- Suez
- JB Ecotex
- Race Eco Chain Ltd.
- Dodhia Group
- CSR PLASTIC
- Polygenta
- Others
Key Developments
Recycled PET market has experienced considerable changes in the last two years as the market players are trying to diversify their technological aspects and develop product portfolios using strategic approaches.
- In July 2025, Mars, Incorporated, a global leader in pet care products and services, continues to make progress in recyclable pet food packaging with the launch of a new mono material pouch for its WHISKAS® brand in the UK and Germany. The new WHISKAS® pouches are designed to be recyclable and compatible with current or emerging recycling infrastructure. The switch to recyclable material has reduced the carbon footprint of the packaging by 46%. The innovative packaging moves away from traditional multi-material pouches which are difficult for consumers to recycle due to inseparable plastic and aluminum materials. The new mono material packaging, made with polypropylene, has heat-resistant characteristics that allow for high temperature sterilization and is possible to be recycled. The recyclable packaging, initially launched with WHISKAS® Tasty Mix Country Collection 12 Pack, is available through all UK retailers and through German retailer Rewe. (https://www.mars.com/news-and-stories/press-releases-statements/mars-debuts-recyclable-pet-food-pouches-for-whiskasr)
- In August 2025, Indorama Ventures Public Company Limited, a global sustainable chemical company, announced it has recycled more than 150 billion post-consumer PET bottles since 2011. This significant milestone underscores the company’s long-term commitment to circular economy practices and its sustained investment in global recycling infrastructure. With more than 20 recycling facilities across 11 countries, supported by strong business partnerships and optimized operations, Indorama Ventures collectively recycles 789 bottles every second1 — transforming used PET into high-quality recycled PET (rPET) resins and other circular materials. These are used across various industries globally, supporting Indorama Ventures and its customers in achieving their sustainability goals. (https://www.indoramaventures.com/en/updates/other-release/2280/indorama-ventures-reaches-150-billion-pet-bottles-recycling-milestone-advancing-circular-economy-across-global-operations)
These strategic measures have enabled the companies to reinforce their competitive positions, increase the product line, boost their technological competencies, and also seize growth opportunities in the fast-growing recycled PET market.
The Recycled PET Market is segmented as follows:
By Product
- Clear
- Colored
By End Use
- Fiber
- Strapping
- Sheet and Film
- Non-Food Containers and Bottles
- Food & Beverage Containers and Bottles
- Others
Regional Coverage:
North America
- U.S.
- Canada
- Mexico
- Rest of North America
Europe
- Germany
- France
- U.K.
- Russia
- Italy
- Spain
- Netherlands
- Rest of Europe
Asia Pacific
- China
- Japan
- India
- New Zealand
- Australia
- South Korea
- Taiwan
- Rest of Asia Pacific
The Middle East & Africa
- Saudi Arabia
- UAE
- Egypt
- Kuwait
- South Africa
- Rest of the Middle East & Africa
Latin America
- Brazil
- Argentina
- Rest of Latin America
Table of Contents
- Chapter 1. Report Introduction
- 1.1. Report Description
- 1.1.1. Purpose of the Report
- 1.1.2. USP & Key Offerings
- 1.2. Key Benefits For Stakeholders
- 1.3. Target Audience
- 1.4. Report Scope
- 1.1. Report Description
- Chapter 2. Market Overview
- 2.1. Report Scope (Segments And Key Players)
- 2.1.1. Recycled PET Market by Segments
- 2.1.2. Recycled PET Market by Region
- 2.2. Executive Summary
- 2.2.1. Market Size & Forecast
- 2.2.2. Recycled PET Market Attractiveness Analysis, By Product
- 2.2.3. Recycled PET Market Attractiveness Analysis, By End Use
- 2.1. Report Scope (Segments And Key Players)
- Chapter 3. Market Dynamics (DRO)
- 3.1. Market Drivers
- 3.1.1. Strong Environmental & Sustainability Pressure
- 3.1.2. Growing Demand From Packaging Industry
- 3.2. Market Restraints
- 3.3. Market Opportunities
- 3.5. Pestle Analysis
- 3.6. Porter Forces Analysis
- 3.7. Technology Roadmap
- 3.8. Value Chain Analysis
- 3.9. Government Policy Impact Analysis
- 3.10. Pricing Analysis
- 3.1. Market Drivers
- Chapter 4. Recycled PET Market – By Product
- 4.1. Product Market Overview, By Product Segment
- 4.1.1. Recycled PET Market Revenue Share, By Product, 2025 & 2035
- 4.1.2. Clear
- 4.1.3. Recycled PET Market Share Forecast, By Region (USD Billion)
- 4.1.4. Comparative Revenue Analysis, By Country, 2025 & 2035
- 4.1.5. Key Market Trends, Growth Factors, & Opportunities
- 4.1.6. Colored
- 4.1.7. Recycled PET Market Share Forecast, By Region (USD Billion)
- 4.1.8. Comparative Revenue Analysis, By Country, 2025 & 2035
- 4.1.9. Key Market Trends, Growth Factors, & Opportunities
- 4.1. Product Market Overview, By Product Segment
- Chapter 5. Recycled PET Market – By End Use
- 5.1. End Use Market Overview, By End Use Segment
- 5.1.1. Recycled PET Market Revenue Share, By End Use, 2025 & 2035
- 5.1.2. Fiber
- 5.1.3. Recycled PET Market Share Forecast, By Region (USD Billion)
- 5.1.4. Comparative Revenue Analysis, By Country, 2025 & 2035
- 5.1.5. Key Market Trends, Growth Factors, & Opportunities
- 5.1.6. Strapping
- 5.1.7. Recycled PET Market Share Forecast, By Region (USD Billion)
- 5.1.8. Comparative Revenue Analysis, By Country, 2025 & 2035
- 5.1.9. Key Market Trends, Growth Factors, & Opportunities
- 5.1.10. Sheet and Film
- 5.1.11. Recycled PET Market Share Forecast, By Region (USD Billion)
- 5.1.12. Comparative Revenue Analysis, By Country, 2025 & 2035
- 5.1.13. Key Market Trends, Growth Factors, & Opportunities
- 5.1.14. Non-Food Containers and Bottles
- 5.1.15. Recycled PET Market Share Forecast, By Region (USD Billion)
- 5.1.16. Comparative Revenue Analysis, By Country, 2025 & 2035
- 5.1.17. Key Market Trends, Growth Factors, & Opportunities
- 5.1.18. Food & Beverage Containers and Bottles
- 5.1.19. Recycled PET Market Share Forecast, By Region (USD Billion)
- 5.1.20. Comparative Revenue Analysis, By Country, 2025 & 2035
- 5.1.21. Key Market Trends, Growth Factors, & Opportunities
- 5.1.22. Others
- 5.1.23. Recycled PET Market Share Forecast, By Region (USD Billion)
- 5.1.24. Comparative Revenue Analysis, By Country, 2025 & 2035
- 5.1.25. Key Market Trends, Growth Factors, & Opportunities
- 5.1. End Use Market Overview, By End Use Segment
- Chapter 6. Recycled PET Market – Regional Analysis
- 6.1. Recycled PET Market Overview, By Region Segment
- 6.1.1. Global Recycled PET Market Revenue Share, By Region, 2025 & 2035
- 6.1.2. Global Recycled PET Market Revenue, By Region, 2026 – 2035 (USD Billion)
- 6.1.3. Global Recycled PET Market Revenue, By Product, 2026 – 2035
- 6.1.4. Global Recycled PET Market Revenue, By End Use, 2026 – 2035
- 6.2. North America
- 6.2.1. North America Recycled PET Market Revenue, By Country, 2026 – 2035 (USD Billion)
- 6.2.2. North America Recycled PET Market Revenue, By Product, 2026 – 2035
- 6.2.3. North America Recycled PET Market Revenue, By End Use, 2026 – 2035
- 6.2.4. U.S. Recycled PET Market Revenue, 2026 – 2035 (USD Billion)
- 6.2.5. Canada Recycled PET Market Revenue, 2026 – 2035 (USD Billion)
- 6.2.6. Mexico Recycled PET Market Revenue, 2026 – 2035 (USD Billion)
- 6.2.7. Rest of North America Recycled PET Market Revenue, 2026 – 2035 (USD Billion)
- 6.3. Europe
- 6.3.1. Europe Recycled PET Market Revenue, By Country, 2026 – 2035 (USD Billion)
- 6.3.2. Europe Recycled PET Market Revenue, By Product, 2026 – 2035
- 6.3.3. Europe Recycled PET Market Revenue, By End Use, 2026 – 2035
- 6.3.4. Germany Recycled PET Market Revenue, 2026 – 2035 (USD Billion)
- 6.3.5. France Recycled PET Market Revenue, 2026 – 2035 (USD Billion)
- 6.3.6. U.K. Recycled PET Market Revenue, 2026 – 2035 (USD Billion)
- 6.3.7. Russia Recycled PET Market Revenue, 2026 – 2035 (USD Billion)
- 6.3.8. Italy Recycled PET Market Revenue, 2026 – 2035 (USD Billion)
- 6.3.9. Spain Recycled PET Market Revenue, 2026 – 2035 (USD Billion)
- 6.3.10. Netherlands Recycled PET Market Revenue, 2026 – 2035 (USD Billion)
- 6.3.11. Rest of Europe Recycled PET Market Revenue, 2026 – 2035 (USD Billion)
- 6.4. Asia Pacific
- 6.4.1. Asia Pacific Recycled PET Market Revenue, By Country, 2026 – 2035 (USD Billion)
- 6.4.2. Asia Pacific Recycled PET Market Revenue, By Product, 2026 – 2035
- 6.4.3. Asia Pacific Recycled PET Market Revenue, By End Use, 2026 – 2035
- 6.4.4. China Recycled PET Market Revenue, 2026 – 2035 (USD Billion)
- 6.4.5. Japan Recycled PET Market Revenue, 2026 – 2035 (USD Billion)
- 6.4.6. India Recycled PET Market Revenue, 2026 – 2035 (USD Billion)
- 6.4.7. New Zealand Recycled PET Market Revenue, 2026 – 2035 (USD Billion)
- 6.4.8. Australia Recycled PET Market Revenue, 2026 – 2035 (USD Billion)
- 6.4.9. South Korea Recycled PET Market Revenue, 2026 – 2035 (USD Billion)
- 6.4.10. Taiwan Recycled PET Market Revenue, 2026 – 2035 (USD Billion)
- 6.4.11. Rest of Asia Pacific Recycled PET Market Revenue, 2026 – 2035 (USD Billion)
- 6.5. The Middle-East and Africa
- 6.5.1. The Middle-East and Africa Recycled PET Market Revenue, By Country, 2026 – 2035 (USD Billion)
- 6.5.2. The Middle-East and Africa Recycled PET Market Revenue, By Product, 2026 – 2035
- 6.5.3. The Middle-East and Africa Recycled PET Market Revenue, By End Use, 2026 – 2035
- 6.5.4. Saudi Arabia Recycled PET Market Revenue, 2026 – 2035 (USD Billion)
- 6.5.5. UAE Recycled PET Market Revenue, 2026 – 2035 (USD Billion)
- 6.5.6. Egypt Recycled PET Market Revenue, 2026 – 2035 (USD Billion)
- 6.5.7. Kuwait Recycled PET Market Revenue, 2026 – 2035 (USD Billion)
- 6.5.8. South Africa Recycled PET Market Revenue, 2026 – 2035 (USD Billion)
- 6.5.9. Rest of the Middle East & Africa Recycled PET Market Revenue, 2026 – 2035 (USD Billion)
- 6.6. Latin America
- 6.6.1. Latin America Recycled PET Market Revenue, By Country, 2026 – 2035 (USD Billion)
- 6.6.2. Latin America Recycled PET Market Revenue, By Product, 2026 – 2035
- 6.6.3. Latin America Recycled PET Market Revenue, By End Use, 2026 – 2035
- 6.6.4. Brazil Recycled PET Market Revenue, 2026 – 2035 (USD Billion)
- 6.6.5. Argentina Recycled PET Market Revenue, 2026 – 2035 (USD Billion)
- 6.6.6. Rest of Latin America Recycled PET Market Revenue, 2026 – 2035 (USD Billion)
- 6.1. Recycled PET Market Overview, By Region Segment
- Chapter 7. Competitive Landscape
- 7.1. Company Market Share Analysis – 2025
- 7.1.1. Global Recycled PET Market: Company Market Share, 2025
- 7.2. Global Recycled PET Market Company Market Share, 2024
- 7.1. Company Market Share Analysis – 2025
- Chapter 8. Company Profiles
- 8.1. Amcor Ltd
- 8.1.1. Company Overview
- 8.1.2. Key Executives
- 8.1.3. Product Portfolio
- 8.1.4. Financial Overview
- 8.1.5. Operating Business Segments
- 8.1.6. Business Performance
- 8.1.7. Recent Developments
- 8.2. PLACON
- 8.3. Clear Path Recycling LLC
- 8.4. Verdeco Recycling Inc.
- 8.5. Indorama Ventures Public Ltd.
- 8.6. Zhejiang Anshun Pettechs Fibre Co. Ltd.
- 8.7. PolyQuest
- 8.8. Evergreen Plastics Inc.
- 8.9. Phoenix Technologies
- 8.10. Libolon
- 8.11. Biffa
- 8.12. PET RECYCLING TEAM
- 8.13. MITSUI & CO. LTD.
- 8.14. Revalyu
- 8.15. TOMRA Systems ASA
- 8.16. UL LLC
- 8.17. Suez
- 8.18. JB Ecotex
- 8.19. Race Eco Chain Ltd.
- 8.20. Dodhia Group
- 8.21. CSR PLASTIC
- 8.22. Polygenta
- 8.23. Others.
- 8.1. Amcor Ltd
- Chapter 9. Research Methodology
- 9.1. Research Methodology
- 9.2. Secondary Research
- 9.3. Primary Research
- 9.3.1. Analyst Tools and Models
- 9.4. Research Limitations
- 9.5. Assumptions
- 9.6. Insights From Primary Respondents
- 9.7. Why Custom Market Insights
- Chapter 10. Standard Report Commercials & Add-Ons
- 10.1. Customization Options
- 10.2. Subscription Module For Market Research Reports
- 10.3. Client Testimonials
List Of Figures
Figures No 1 to 22
List Of Tables
Tables No 1 to 41
Prominent Player
- Amcor Ltd
- PLACON
- Clear Path Recycling LLC
- Verdeco Recycling Inc.
- Indorama Ventures Public Ltd.
- Zhejiang Anshun Pettechs Fibre Co. Ltd.
- PolyQuest
- Evergreen Plastics Inc.
- Phoenix Technologies
- Libolon
- Biffa
- PET RECYCLING TEAM
- MITSUI & CO. LTD.
- Revalyu
- TOMRA Systems ASA
- UL LLC
- Suez
- JB Ecotex
- Race Eco Chain Ltd.
- Dodhia Group
- CSR PLASTIC
- Polygenta
- Others
FAQs
The key players in the market are Amcor Ltd., PLACON, Clear Path Recycling LLC, Verdeco Recycling Inc., Indorama Ventures Public Ltd., Zhejiang Anshun Pettechs Fibre Co. Ltd., PolyQuest, Evergreen Plastics Inc., Phoenix Technologies, Libolon, Biffa, PET RECYCLING TEAM, MITSUI & CO. LTD., Revalyu, TOMRA Systems ASA, UL LLC, Suez, JB Ecotex, Race Eco Chain Ltd., Dodhia Group, CSR PLASTIC, Polygenta, Others.
Government regulations play a crucial role in shaping the development of the recycled PET (rPET) market by mandating recycled content usage, restricting single-use plastics, and enforcing waste management policies, which collectively drive demand for rPET and accelerate industry adoption.
The price point significantly impacts rPET market growth, as competitive or lower costs compared to virgin PET encourage wider adoption, while higher prices can limit uptake despite sustainability benefits.
According to the present analysis and forecast modeling, the market of recycled PET will witness a significant growth of about USD 22.3 billion in the year 2035 with the growing innovative product launch, increasing collaboration, and rising circular economy trends with a CAGR of 9.8% between the years 2026 and 2035.
It is projected that the Asia Pacific will hold the largest market share in the recycled PET market in the forecast period, with a share of about 45% of the global market share, which is attributed to the increasing consumer awareness regarding plastic pollution and a strong shift toward sustainable packaging solutions across industries such as food, beverages, and personal care. Government regulations, including bottle deposit schemes and mandates for recycled content, are encouraging manufacturers to adopt rPET over virgin plastics.
Europe is expected to grow at the highest rate during the forecast period. The presence of several players drives the market growth.
The growth of the recycled polyethylene terephthalate (rPET) market is primarily driven by a combination of environmental, regulatory, economic, and technological factors. Increasing global concern over plastic waste and carbon emissions has pushed governments and industries to adopt more sustainable materials, making rPET a preferred alternative to virgin plastics. Stringent regulations, such as bans on single-use plastics and mandates for recycled content in packaging, are compelling manufacturers to incorporate higher levels of recycled PET. At the same time, strong demand from the packaging industry—especially in food, beverage, and personal care sectors—is accelerating adoption, as companies shift toward eco-friendly packaging solutions and closed-loop recycling systems. The rapid expansion of the textile industry, where rPET is widely used to produce recycled polyester fibers, further supports market growth.