Renewable Energy Certificate Market Size, Trends and Insights By Energy Type (Solar Energy, Hydro-electric Power, Wind Power, Gas Power), By Capacity (0-1,000KWH, 1,100-5,000KWH, More than 5,000KWH); By End Use (Voluntary, Compliance), and By Region – Global Industry Overview, Statistical Data, Competitive Analysis, Share, Outlook, and Forecast 2026 – 2035
Report Snapshot
| Study Period: | 2026-2035 |
| Fastest Growing Market: | Asia Pacific |
| Largest Market: | North America |
Major Players
- Sterling Planet
- Ecohz
- Shell
- Statkraft
- Others
Reports Description
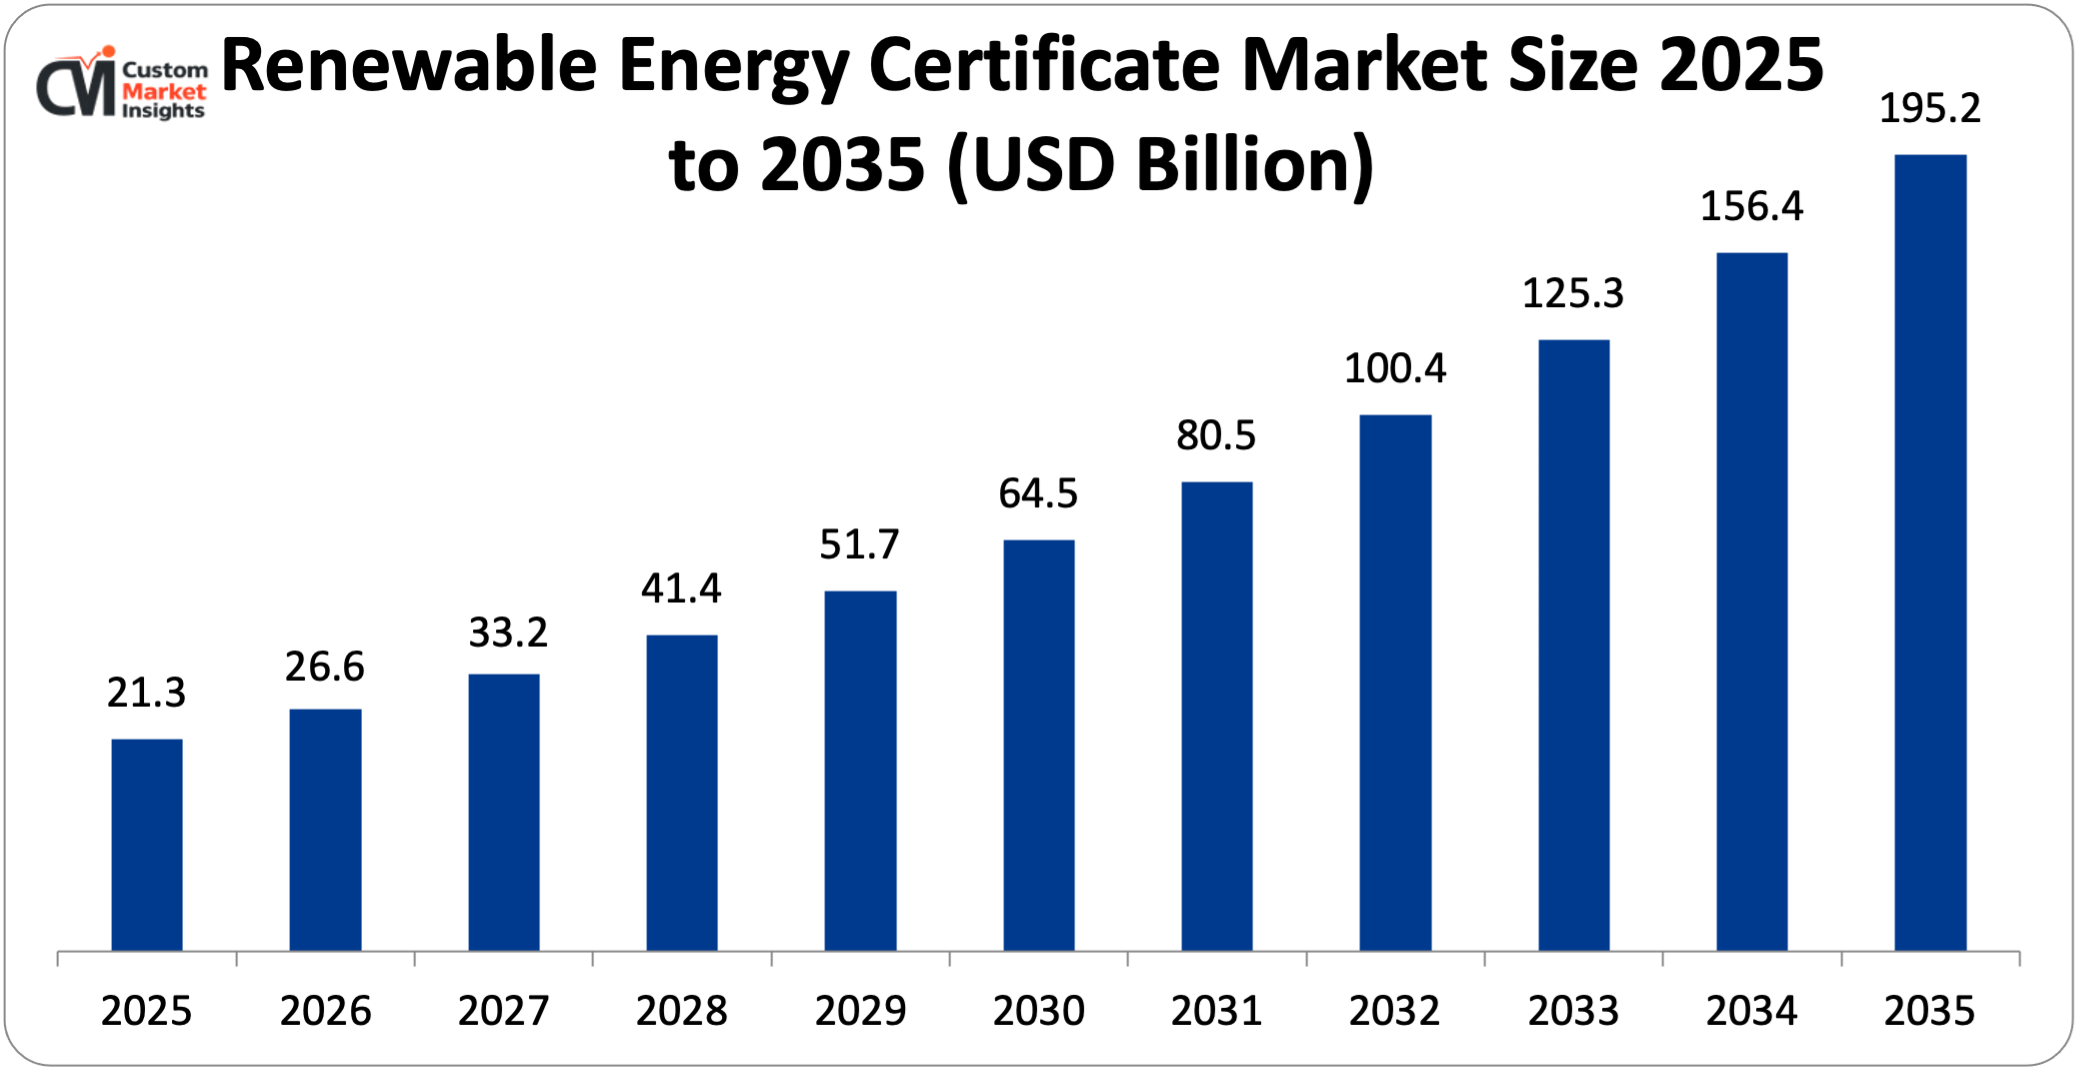
The market size of global renewable energy certificates will be estimated at USD 21.3 billion in 2025 and is expected to grow to between USD 26.6 billion in 2026 and about USD 195.2 billion by 2035, with a current CAGR (compound annual growth rate) of 24.8% during the period of 2026 to 2035. A renewable energy certificate (REC) is a tradable instrument that shows the holding or proof that a specific amount of electricity, one megawatt hour, is generated from renewable sources (wind, solar, hydro, or biomass).
When these sources contribute power to the transmission system, that power gets separated into two parts: physically transferred power, which passes through the transmission system, and environmental benefit, which is based on the manner in which the power has been created. The method helps generate RECs, which can either be bought and sold as a separate entity or be traded independently. Consumers and polluting gas & electric utility companies buy them to meet a regulatory compliance or to reduce their own carbon footprints; they also buy them to support and enable the clean generation/decarbonization missions, thus giving consumers an easy, reliable, transparent, and user-friendly method of power accounting.
Market Highlight
- In 2025, North America will dominate the global market with an estimated market share of 34%. The presence of major players and growing focus on green energy.
- The Asia Pacific is growing at the highest CAGR over the analysis period. The increasing electricity demand propels the regional market.
- By energy type, the solar energy segment dominated the industry in 2025.
- By capacity, the more than 5,000 kWh segment captures the largest market share in 2025.
- By end use, the compliance segment captures the highest revenue share in 2025.
Significant Growth Factors
The renewable energy certificate market trends present significant growth opportunities due to several factors:
- Growth in Renewable Energy Capacity: Expansion of renewable capacity is one of the key factors that impact the REC market because each unit of renewable electricity (1 MWh) produced necessarily generates 1 REC. Policy agencies in regions worldwide are prioritizing their tremendous efforts on establishing large-scale renewable generation facilities, boosting renewable capacity, and thus leading to a large pool of RECs as well as increasing demand from both compliance and voluntary markets. Driven by international nonprofit authorities and indices of national policies, the submitted REC supply is hugely increasing worldwide due to the development of renewable energy projects and the recognition of the importance of sustainable energy utilization at rapid speed. The global installed capacity of renewable power had reached 2,828 GW in 2024 with 585 GW of increased renewable power capacity, over 90% of which constitutes new capacity of power generation. The rapid pace of capacity increases has a positive impact on more REC supply in the market, making it less expensive and more accessible to consumers or enterprises who want to shift their investment into renewable energy sources. In the same year, the IEA estimates the cumulative capacity of renewable energy globally will increase by roughly 4,600 GW from 2025 to 2030, providing double the current capacity. The predicted annual additions will rise from 666 GW in 2024 to almost 935 GW by 2030, predominantly through solar and wind energy. At a country level, government measures boost the development of the REC market by introducing mitigating governmental policies and regulations to encourage renewable energy adoption, such as incentives, supportive legislation, and transnational relation infrastructure schemes. In India, renewable energy has developed rapidly, with over 250 GW of renewable power capacity installed and 44.5 GW added in 2025 due to financial advantages and extremely low tariffs. All have made a huge number of REC issues and have a high demand for obligated parties or enterprises.
- Increasing Global Electricity Demand & Energy Transition: Growth of the REC market is undeniably impacted by the increase of global electricity demand, alongside the push for energy transition. As the world’s electricity demand (which is growing as an average of 3–4% per year according to the IEA) continues growing due to multiple factors such as a rising population, population migration to cities, and new industrial processes requiring more energy, new concerns regarding the sustainability of such high levels of consumption have to be addressed. With global climate agendas, governments and energy providers are now trying to find a way to provide this energy at a higher ratio of renewables without an impossible cost. This is why the transition from fossil energies to renewables is accelerated across several pathways, from national policies and international coalitions (such as the Paris Agreement) and local regulatory requirements to the increased use of market tools such as RECs, allowing for more flexibility over how electricity purchased from the market is produced. Under such increasing demand for low-carbon electricity, there is now more than ever a match needed between how much market-based instruments like RECs can provide and how much energy is needed to be decarbonized from the grid, and the downstream market growth is reflecting this.
What are the Major Advances Changing the Renewable Energy Certificate Market Today?
- Digitalization & Blockchain-based REC Systems: Digitalization and blockchain-based REC systems are also one of the most innovative evolutionary processes that are transforming the REC market nowadays. In the processes currently adopted, the creation and trading of REC depend on manual actions and centralized registries and are generally non-transparent, resulting in inefficiency, delays, and additional warnings concerning double counting. Recourse to digitized platforms enables automatic generation and consumption data collection, verification, and settling, whereas blockchain-based technology also proposes a decentralized, permanent, and secure chronicle of every activity, allowing for overcoming forgeries and double usage and also offering an excellent information source to protect the data about the origin of the electricity and the users, and it is also very convenient for the creation of digital REC tokens, which can then be traded more easily on a dedicated market, allowing for small investor contributions. Digital systems assembling several data sources such as smart meters or Internet of things (IoT) sensors not only optimize the process flow but also significantly reduce the operational and transaction costs while enabling the immediate settling of the REC. In the wake of these innovation offers, digitalization and blockchain appear to give weight to the process of reporting and trading the REC, to cut waste and transaction costs, and to accelerate the markets in order to facilitate their future development and to broaden the scope of trading activities all over the world.
- Integration With Smart Grids, AI & IoT: The use of smart grids, AI, and IoT devices to calibrate generation, monitor, verify, and trade renewables is one of the most visible technological developments that are differentiating the REC market. Previously, the generation of energy was calculated on a block of time and checked with manual calculations. The smart grid and data flowing from our connected IoT sensors and smart meters enable us to monitor renewable generation in virtually real time, which allows for highly accurate measurements of the total amount of solar energy, wind energy, geothermal energy, or other qualifying sources of electrical power generated into the grid. Smart grids enable the physical and digital integration of dispersed sources of renewables and facilitate the two-way communication between individual renewable electricity systems and the grid to make renewable generation more efficient and improve the accuracy of REC issuance. Meanwhile, continuous streams of two-way communication from smart power meters, power stations, plant systems, and monitors improve information on actual generation, system efficiency, and the health of the grid; reduce errors and opportunities for manipulation; and eliminate the risks of the certification calculation process. Use of AI to improve power-generation calculation and prediction, demand forecasting, energy optimization, and certification administration supports standard compliance and large renewable investment development.
Category Wise Insights
By Energy Type
Why Solar Energy Hold a Prominent Position in the Market?
The solar energy segment dominated the industry in 2025. The solar power is generated from the conversion of solar heat into electricity. It is among the largest and most vital sources of renewable energy. Solar power is generated from sunlight either with the help of concentrated solar power or photovoltaic cells. The photovoltaic is used for medium and small sizes of applications. The growth of this segment is driven by the growing applications of solar energy in the broader range of products such as calculators and remote controls. Further, the growing number of government initiatives and the government’s investment to develop the solar panels and enhance their adoption across the globe are expected to accelerate the growth of this segment. The increasing private investments in the large-scale development of the solar energy plants are expected to accelerate the market growth of the solar energy renewable energy certificates.
The wind power segment is growing at the highest CAGR over the analysis period. The increasing number of projects in the emerging nations. For instance, in September 2025, In India, India’s leading renewable energy company, Serentica Renewables, has selected the world’s leading OEM, Envision Energy India, to deliver its 560 MW Wind Project in India using Envision’s leading advanced Envision Smart WTGs of 5 MW each. Delivery is expected to start in Feb 2026 by this project. This project exemplifies Serentica‘s pledge to ‘deliver round-the-clock, reliable green power across India.’
By Capacity
Why More than 5,000KWH Capture the Highest Market Share in the Renewable Energy Certificate Market?
More than 5,000 kWh segment captures the largest market share in 2025. The market experienced a major boom due to the high penetration of large-capacity projects (such as industrial- and utility-scale projects, which offer higher markets and revenues), the growth of which is being driven by the rapid growth in large-capacity solar and wind projects and the increasing adoption of renewable projects by corporates for clean energy procurement. Large capacity projects such as commercial, industrial, and utility-scale installations generate higher capacities of RECs, thus generating higher revenues. Governments in several large economies are promoting large-capacity projects by different policy instruments such as incentives, renewable purchase obligations (RPOs), and auctions.
The 0-1,000KWH segment is growing at the highest rate over the projected period. Most of the growth in this segment is due to the rising number of miniaturized renewable energy projects and installations (private buildings, small commercial businesses, community projects, etc.). As states and regions (through federal legal and tax incentives, net metering programs, and subsidies) begin to actively encourage small producers of renewable energy, individual owners of renewable installations are oversubscribing the market and producing RECs at a much smaller, “micro” scale.
By End Use
Why Compliance Holds a Prominent Share in the Renewable Energy Certificate Market?
The compliance segment captures the highest revenue share in 2025. The segment growth is mainly attributable to government regulations requiring the use of renewable energy. Such rules, such as Renewable Purchase Obligations (RPOs) or Renewable Portfolio Standards (RPS), compel the utilities, distribution companies, large electricity consumers, and any other entities to get a certain proportion of their energy from renewables. When they are not able to directly generate or acquire enough renewable energy, they are required to buy RECs to fulfill the regulatory obligation with an assured buyer, hence providing an assured and steady revenue stream to the compliance segment.
The voluntary segment is growing at a rapid rate over the projected period. This growth is mainly driven by a growing corporate and institutional business with sustainability, decarbonization, and ESG targets as the main drivers. Regulation is a minor factor for REC leading purchases in the compliance market, whereas in the voluntary commercial market, where more and more companies support their net-zero goal, the purchasing decisions are used to attribute an image of renewable energy even if it is not physically available.
Report Scope
| Feature of the Report | Details |
| Market Size in 2026 | USD 26.6 billion |
| Projected Market Size in 2035 | USD 195.2 billion |
| Market Size in 2025 | USD 21.3 billion |
| CAGR Growth Rate | 24.8% CAGR |
| Base Year | 2025 |
| Forecast Period | 2026-2035 |
| Key Segment | By Energy Type, Capacity, End Use and Region |
| Report Coverage | Revenue Estimation and Forecast, Company Profile, Competitive Landscape, Growth Factors and Recent Trends |
| Regional Scope | North America, Europe, Asia Pacific, Middle East & Africa, and South & Central America |
| Buying Options | Request tailored purchasing options to fulfil your requirements for research. |
Regional Analysis
How Big is North America Renewable Energy Certificate Market Size?
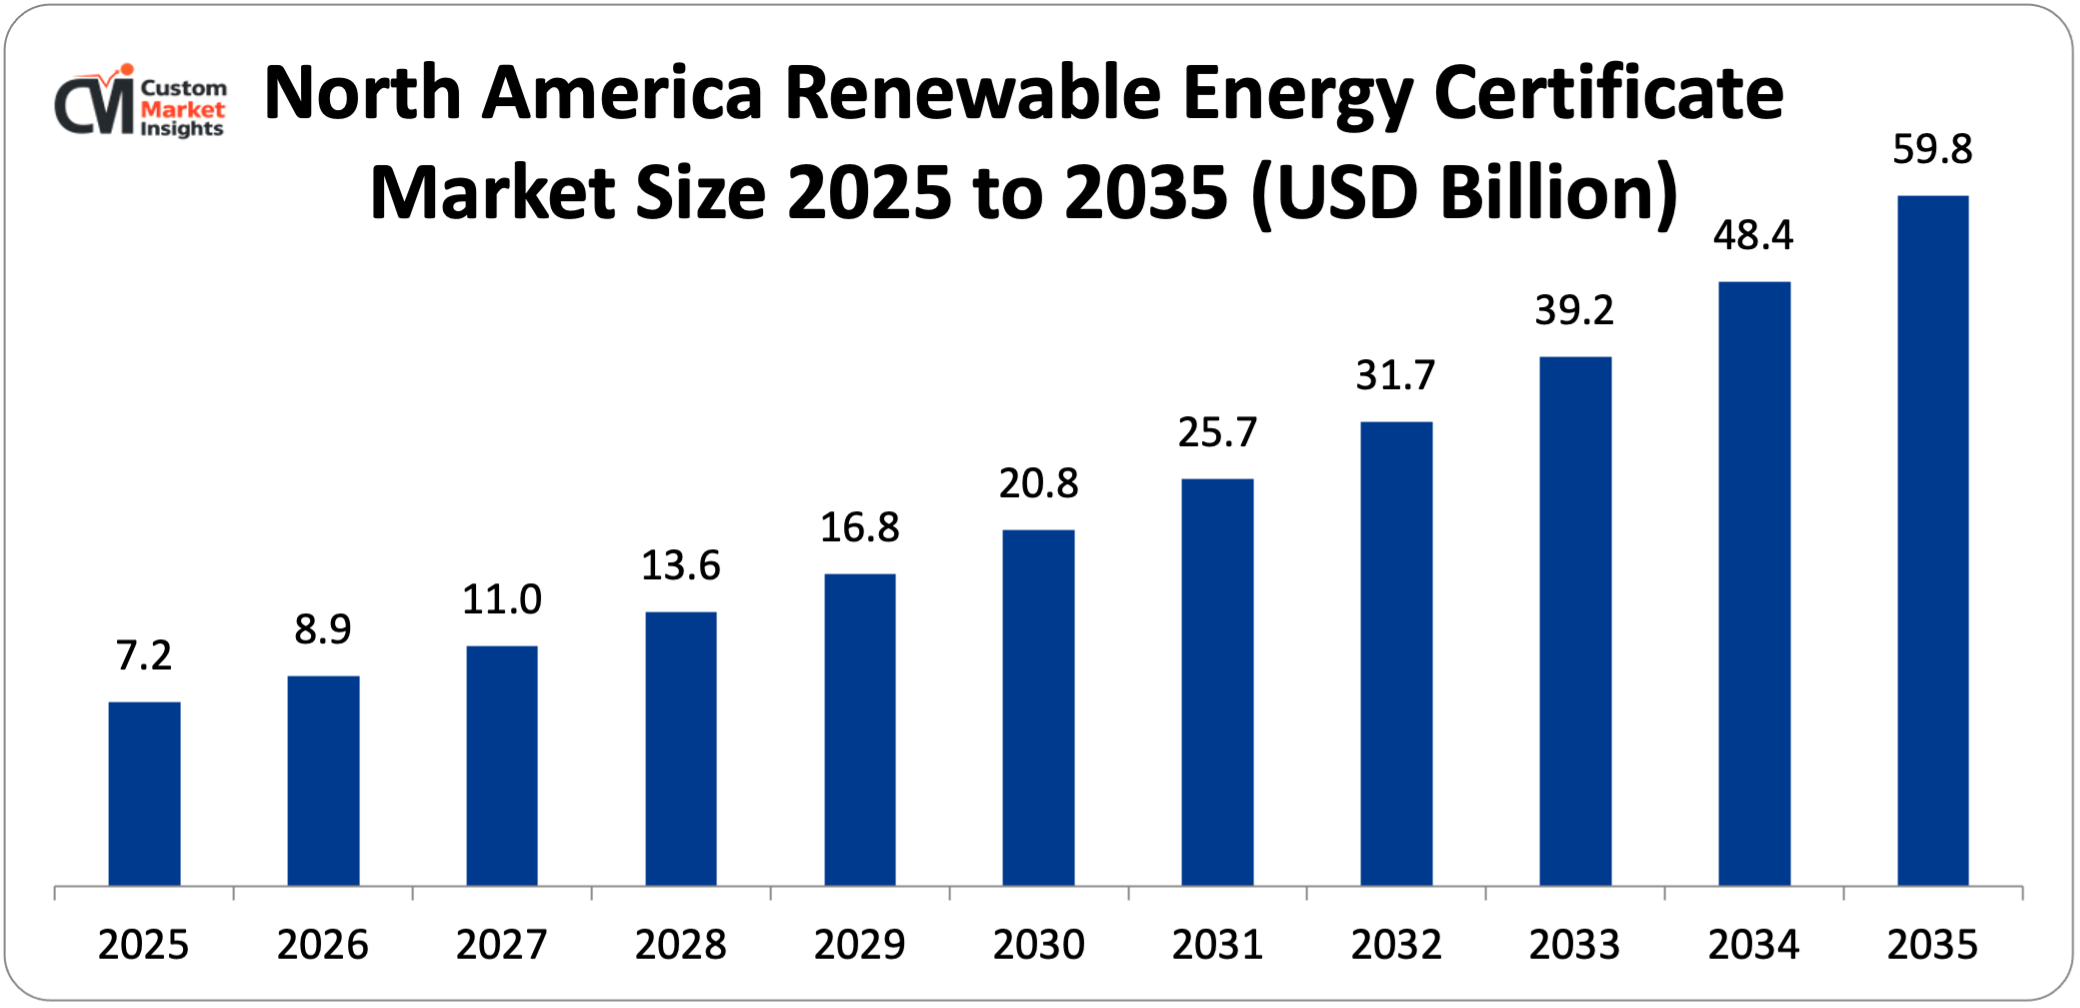
Its market size, in terms of North American renewable energy certificate, is projected to be USD 7.2 billion in 2025 with a growth of about USD 59.8 billion in 2035 with a CAGR of 23.5% between 2026 and 2035.
Why did the North America Dominate the Renewable Energy Certificate Market in 2025?
In 2025, North America will dominate the global market with an estimated market share of 34%. This growth is driven by a few factors. First, policies such as the Renewable Portfolio Standards (RPS) in the United States, the requirement for clean energy in Canada, etc., require utilities and major electricity users to buy the mandated share of electricity from renewables, with the day-to-day impact of creating a permanent demand for RECs. The global focus on carbon reduction has created a thriving voluntary market where a large number of companies are purchasing RECs for meeting ESG goals and becoming carbon neutral. The buildup of fast-track additions of large-scale wind and solar farms further increased revenues through a high trading volume of RECs.
US Renewable Energy Certificate Market Trends
In the North American region, the US leads the industry expansion over the projected period. Digital trading platforms, transparent certification systems, and effective regulatory enforcement have been the three fundamental aspects that shape the US REC market performance. Driven by the region‘s unwavering commitment to sustainability and clean energy adoption, these three aspects will continuously boost revenue growth in the US REC market.
Why is Europe Experiencing Significant Growth in the Renewable Energy Certificate Market?
Europe holds a significant market share in 2025. Solid regulatory frameworks, ambitious climate goals, and rising corporate demands for renewable energy facilitate regional growth. This growth is largely underpinned by the region‘s solid renewables policies and binding targets defined under legal instruments, such as the European Union Green Deal, and will be fulfilled through frameworks like Guarantees of Origin (GOs), which are equivalent to RECs and provide clear structure for regional renewable energy consumption. Such instruments will generate stable demand in the compliance markets and incentivize renewable generation.
UK Renewable Energy Certificate Market Trends
The UK held the dominant position in the market in 2025. Offshore and onshore wind capacity growth, as well as increasing solar capacity, means a surge in the supply of certificates, which will increase market liquidity and activity in trading. In addition, the UK market has an active voluntary segment where corporates and institutions are buying REGOs to meet sustainability commitments and improve ESG reporting.
Why is the Asia Pacific Growing at the Highest CAGR in the Renewable Energy Certificate Market?
The Asia Pacific is expected to grow at the highest CAGR over the projected period. The growing deployment of renewable energy, enabling regulations, and increasing corporate investment in sustainable energies are leading the way. Countries like China, India, Japan, and Australia are investing heavily in solar, wind, and other renewables to meet fast-growing electricity demand, as well as reduce CO₂ emissions. Policies such as Indian renewable purchase obligations (RPOs) and Chinese Green Certificate schemes are providing a robust compliance-driven demand for RECs. Concurrently, the expansion of MNCs’ presence is also accelerating the voluntary REC market, as international firms work towards sustainability and net-zero goals.
India Renewable Energy Certificate Market Trends
India holds the prominent market share in the industry. The rapid integration of renewable energy and the growing government initiatives drive the market growth.
Why is the Middle East & Africa Region is growing rapidly in the Renewable Energy Certificate?
The MEA region is growing at a steady rate over the projected period. The influx of positive policy and transfer learning from other countries could have contributed to the revenue expansion. The UAE, Saudi Arabia, and South Africa all appear to be moving toward cleaner energy sources by implementing large-scale solar and wind projects in response to the demand to cut down the global carbon emissions or meet the international global warming clauses. The government-led policy and clean energy plan successfully establish the mature REC program and then accelerate its adoption in both the compliance and voluntary markets. The ever-growing MNCs also have a tendency to increase the demand for RECs, for some of them aim to meet the global ESG and net zero targets.
UAE Renewable Energy Certificate Market Trends
The UAE is growing at the highest CAGR during the forecast period. This growth is mainly driven by the rising electricity demand and increasing collaboration among the market players.
Top Players in the Renewable Energy Certificate Market and Their Offerings
- Sterling Planet
- Ecohz
- Shell
- Statkraft
- Xpansiv
- EDF Trading Limited
- ENGIE
- Enel Green Power
- STX Group
- TerraPass
- BEF
- Targray
- Ameresco
- 3Degrees
- Constellation
- Others
Key Developments
Renewable energy certificate market has experienced considerable changes in the last two years as the market players are trying to diversify their technological aspects and develop product portfolios using strategic approaches.
- In March 2024, KBank and INNPOWER partnered to unveil a renewable energy certification platform for Thailand. This initiative aims to promote the expansion of renewable energy utilization in Thailand. KBank has also launched a wide range of products and services under the concept, while the collaboration offers an opportunity for large businesses to achieve their net zero emissions targets. (https://solarquarter.com/2024/03/12/kbank-and-innopower-pioneer-thailands-renewable-energy-certificate-platform-to-drive-sustainable-energy-adoption-and-income-generation/)
These strategic measures have enabled the companies to reinforce their competitive positions, increase the product line, boost their technological competencies, and also seize growth opportunities in the fast-growing renewable energy certificate market.
The Renewable Energy Certificate Market is segmented as follows:
By Energy Type
- Solar Energy
- Hydro-electric Power
- Wind Power
- Gas Power
By Capacity
- 0-1,000 kWh
- 1,100-5,000 kWh
- More than 5,000 kWh
By End Use
- Voluntary
- Compliance
Regional Coverage:
North America
- U.S.
- Canada
- Mexico
- Rest of North America
Europe
- Germany
- France
- U.K.
- Russia
- Italy
- Spain
- Netherlands
- Rest of Europe
Asia Pacific
- China
- Japan
- India
- New Zealand
- Australia
- South Korea
- Taiwan
- Rest of Asia Pacific
The Middle East & Africa
- Saudi Arabia
- UAE
- Egypt
- Kuwait
- South Africa
- Rest of the Middle East & Africa
Latin America
- Brazil
- Argentina
- Rest of Latin America
Table of Contents
- Chapter 1. Report Introduction
- 1.1. Report Description
- 1.1.1. Purpose of the Report
- 1.1.2. USP & Key Offerings
- 1.2. Key Benefits For Stakeholders
- 1.3. Target Audience
- 1.4. Report Scope
- 1.1. Report Description
- Chapter 2. Market Overview
- 2.1. Report Scope (Segments And Key Players)
- 2.1.1. Renewable Energy Certificate by Segments
- 2.1.2. Renewable Energy Certificate by Region
- 2.2. Executive Summary
- 2.2.1. Market Size & Forecast
- 2.2.2. Renewable Energy Certificate Market Attractiveness Analysis, By Energy Type
- 2.2.3. Renewable Energy Certificate Market Attractiveness Analysis, By Capacity
- 2.2.4. Renewable Energy Certificate Market Attractiveness Analysis, By End Use
- 2.1. Report Scope (Segments And Key Players)
- Chapter 3. Market Dynamics (DRO)
- 3.1. Market Drivers
- 3.1.1. Growth in Renewable Energy Capacity
- 3.1.2. Increasing Global Electricity Demand & Energy Transition
- 3.2. Market Restraints
- 3.3. Market Opportunities
- 3.5. Pestle Analysis
- 3.6. Porter Forces Analysis
- 3.7. Technology Roadmap
- 3.8. Value Chain Analysis
- 3.9. Government Policy Impact Analysis
- 3.10. Pricing Analysis
- 3.1. Market Drivers
- Chapter 4. Renewable Energy Certificate Market – By Energy Type
- 4.1. Energy Type Market Overview, By Energy Type Segment
- 4.1.1. Renewable Energy Certificate Market Revenue Share, By Energy Type, 2025 & 2035
- 4.1.2. Solar Energy
- 4.1.3. Renewable Energy Certificate Share Forecast, By Region (USD Billion)
- 4.1.4. Comparative Revenue Analysis, By Country, 2025 & 2035
- 4.1.5. Key Market Trends, Growth Factors, & Opportunities
- 4.1.6. Hydro-electric Power
- 4.1.7. Renewable Energy Certificate Share Forecast, By Region (USD Billion)
- 4.1.8. Comparative Revenue Analysis, By Country, 2025 & 2035
- 4.1.9. Key Market Trends, Growth Factors, & Opportunities
- 4.1.10. Wind Power
- 4.1.11. Renewable Energy Certificate Share Forecast, By Region (USD Billion)
- 4.1.12. Comparative Revenue Analysis, By Country, 2025 & 2035
- 4.1.13. Key Market Trends, Growth Factors, & Opportunities
- 4.1.14. Gas Power
- 4.1.15. Renewable Energy Certificate Share Forecast, By Region (USD Billion)
- 4.1.16. Comparative Revenue Analysis, By Country, 2025 & 2035
- 4.1.17. Key Market Trends, Growth Factors, & Opportunities
- 4.1. Energy Type Market Overview, By Energy Type Segment
- Chapter 5. Renewable Energy Certificate Market – By Capacity
- 5.1. Capacity Market Overview, By Capacity Segment
- 5.1.1. Renewable Energy Certificate Market Revenue Share, By Capacity, 2025 & 2035
- 5.1.2. 0-1,000KWH
- 5.1.3. Renewable Energy Certificate Share Forecast, By Region (USD Billion)
- 5.1.4. Comparative Revenue Analysis, By Country, 2025 & 2035
- 5.1.5. Key Market Trends, Growth Factors, & Opportunities
- 5.1.6. 1,100-5,000 kWh
- 5.1.7. Renewable Energy Certificate Share Forecast, By Region (USD Billion)
- 5.1.8. Comparative Revenue Analysis, By Country, 2025 & 2035
- 5.1.9. Key Market Trends, Growth Factors, & Opportunities
- 5.1.10. More than 5,000 kWh
- 5.1.11. Renewable Energy Certificate Share Forecast, By Region (USD Billion)
- 5.1.12. Comparative Revenue Analysis, By Country, 2025 & 2035
- 5.1.13. Key Market Trends, Growth Factors, & Opportunities
- 5.1. Capacity Market Overview, By Capacity Segment
- Chapter 6. Renewable Energy Certificate Market – By End Use
- 6.1. End Use Market Overview, By End Use Segment
- 6.1.1. Renewable Energy Certificate Market Revenue Share, By End Use, 2025 & 2035
- 6.1.2. Voluntary
- 6.1.3. Renewable Energy Certificate Share Forecast, By Region (USD Billion)
- 6.1.4. Comparative Revenue Analysis, By Country, 2025 & 2035
- 6.1.5. Key Market Trends, Growth Factors, & Opportunities
- 6.1.6. Compliance
- 6.1.7. Renewable Energy Certificate Share Forecast, By Region (USD Billion)
- 6.1.8. Comparative Revenue Analysis, By Country, 2025 & 2035
- 6.1.9. Key Market Trends, Growth Factors, & Opportunities
- 6.1. End Use Market Overview, By End Use Segment
- Chapter 7. Renewable Energy Certificate Market – Regional Analysis
- 7.1. Renewable Energy Certificate Market Overview, By Region Segment
- 7.1.1. Global Renewable Energy Certificate Market Revenue Share, By Region, 2025 & 2035
- 7.1.2. Global Renewable Energy Certificate Market Revenue, By Region, 2026 – 2035 (USD Billion)
- 7.1.3. Global Renewable Energy Certificate Market Revenue, By Energy Type, 2026 – 2035
- 7.1.4. Global Renewable Energy Certificate Market Revenue, By Capacity, 2026 – 2035
- 7.1.5. Global Renewable Energy Certificate Market Revenue, By End Use, 2026 – 2035
- 7.2. North America
- 7.2.1. North America Renewable Energy Certificate Market Revenue, By Country, 2026 – 2035 (USD Billion)
- 7.2.2. North America Renewable Energy Certificate Market Revenue, By Energy Type, 2026 – 2035
- 7.2.3. North America Renewable Energy Certificate Market Revenue, By Capacity, 2026 – 2035
- 7.2.4. North America Renewable Energy Certificate Market Revenue, By End Use, 2026 – 2035
- 7.2.5. U.S. Renewable Energy Certificate Market Revenue, 2026 – 2035 (USD Billion)
- 7.2.6. Canada Renewable Energy Certificate Market Revenue, 2026 – 2035 (USD Billion)
- 7.2.7. Mexico Renewable Energy Certificate Market Revenue, 2026 – 2035 (USD Billion)
- 7.2.8. Rest of North America Renewable Energy Certificate Market Revenue, 2026 – 2035 (USD Billion)
- 7.3. Europe
- 7.3.1. Europe Renewable Energy Certificate Market Revenue, By Country, 2026 – 2035 (USD Billion)
- 7.3.2. Europe Renewable Energy Certificate Market Revenue, By Energy Type, 2026 – 2035
- 7.3.3. Europe Renewable Energy Certificate Market Revenue, By Capacity, 2026 – 2035
- 7.3.4. Europe Renewable Energy Certificate Market Revenue, By End Use, 2026 – 2035
- 7.3.5. Germany Renewable Energy Certificate Market Revenue, 2026 – 2035 (USD Billion)
- 7.3.6. France Renewable Energy Certificate Market Revenue, 2026 – 2035 (USD Billion)
- 7.3.7. U.K. Renewable Energy Certificate Market Revenue, 2026 – 2035 (USD Billion)
- 7.3.8. Russia Renewable Energy Certificate Market Revenue, 2026 – 2035 (USD Billion)
- 7.3.9. Italy Renewable Energy Certificate Market Revenue, 2026 – 2035 (USD Billion)
- 7.3.10. Spain Renewable Energy Certificate Market Revenue, 2026 – 2035 (USD Billion)
- 7.3.11. Netherlands Renewable Energy Certificate Market Revenue, 2026 – 2035 (USD Billion)
- 7.3.12. Rest of Europe Renewable Energy Certificate Market Revenue, 2026 – 2035 (USD Billion)
- 7.4. Asia Pacific
- 7.4.1. Asia Pacific Renewable Energy Certificate Market Revenue, By Country, 2026 – 2035 (USD Billion)
- 7.4.2. Asia Pacific Renewable Energy Certificate Market Revenue, By Energy Type, 2026 – 2035
- 7.4.3. Asia Pacific Renewable Energy Certificate Market Revenue, By Capacity, 2026 – 2035
- 7.4.4. Asia Pacific Renewable Energy Certificate Market Revenue, By End Use, 2026 – 2035
- 7.4.5. China Renewable Energy Certificate Market Revenue, 2026 – 2035 (USD Billion)
- 7.4.6. Japan Renewable Energy Certificate Market Revenue, 2026 – 2035 (USD Billion)
- 7.4.7. India Renewable Energy Certificate Market Revenue, 2026 – 2035 (USD Billion)
- 7.4.8. New Zealand Renewable Energy Certificate Market Revenue, 2026 – 2035 (USD Billion)
- 7.4.9. Australia Renewable Energy Certificate Market Revenue, 2026 – 2035 (USD Billion)
- 7.4.10. South Korea Renewable Energy Certificate Market Revenue, 2026 – 2035 (USD Billion)
- 7.4.11. Taiwan Renewable Energy Certificate Market Revenue, 2026 – 2035 (USD Billion)
- 7.4.12. Rest of Asia Pacific Renewable Energy Certificate Market Revenue, 2026 – 2035 (USD Billion)
- 7.5. The Middle-East and Africa
- 7.5.1. The Middle-East and Africa Renewable Energy Certificate Market Revenue, By Country, 2026 – 2035 (USD Billion)
- 7.5.2. The Middle-East and Africa Renewable Energy Certificate Market Revenue, By Energy Type, 2026 – 2035
- 7.5.3. The Middle-East and Africa Renewable Energy Certificate Market Revenue, By Capacity, 2026 – 2035
- 7.5.4. The Middle-East and Africa Renewable Energy Certificate Market Revenue, By End Use, 2026 – 2035
- 7.5.5. Saudi Arabia Renewable Energy Certificate Market Revenue, 2026 – 2035 (USD Billion)
- 7.5.6. UAE Renewable Energy Certificate Market Revenue, 2026 – 2035 (USD Billion)
- 7.5.7. Egypt Renewable Energy Certificate Market Revenue, 2026 – 2035 (USD Billion)
- 7.5.8. Kuwait Renewable Energy Certificate Market Revenue, 2026 – 2035 (USD Billion)
- 7.5.9. South Africa Renewable Energy Certificate Market Revenue, 2026 – 2035 (USD Billion)
- 7.5.10. Rest of the Middle East & Africa Renewable Energy Certificate Market Revenue, 2026 – 2035 (USD Billion)
- 7.6. Latin America
- 7.6.1. Latin America Renewable Energy Certificate Market Revenue, By Country, 2026 – 2035 (USD Billion)
- 7.6.2. Latin America Renewable Energy Certificate Market Revenue, By Energy Type, 2026 – 2035
- 7.6.3. Latin America Renewable Energy Certificate Market Revenue, By Capacity, 2026 – 2035
- 7.6.4. Latin America Renewable Energy Certificate Market Revenue, By End Use, 2026 – 2035
- 7.6.5. Brazil Renewable Energy Certificate Market Revenue, 2026 – 2035 (USD Billion)
- 7.6.6. Argentina Renewable Energy Certificate Market Revenue, 2026 – 2035 (USD Billion)
- 7.6.7. Rest of Latin America Renewable Energy Certificate Market Revenue, 2026 – 2035 (USD Billion)
- 7.1. Renewable Energy Certificate Market Overview, By Region Segment
- Chapter 8. Competitive Landscape
- 8.1. Company Market Share Analysis – 2025
- 8.1.1. Global Renewable Energy Certificate Market: Company Market Share, 2025
- 8.2. Global Renewable Energy Certificate Market Company Market Share, 2024
- 8.1. Company Market Share Analysis – 2025
- Chapter 9. Company Profiles
- 9.1. Sterling Planet
- 9.1.1. Company Overview
- 9.1.2. Key Executives
- 9.1.3. Product Portfolio
- 9.1.4. Financial Overview
- 9.1.5. Operating Business Segments
- 9.1.6. Business Performance
- 9.1.7. Recent Developments
- 9.2. Ecohz
- 9.3. Shell
- 9.4. Statkraft
- 9.5. Xpansiv
- 9.6. EDF Trading Limited
- 9.7. ENGIE
- 9.8. Enel Green Power
- 9.9. STX Group
- 9.10. TerraPass
- 9.11. BEF
- 9.12. Targray
- 9.13. Ameresco
- 9.14. 3Degrees
- 9.15. Constellation
- 9.16. Others.
- 9.1. Sterling Planet
- Chapter 10. Research Methodology
- 10.1. Research Methodology
- 10.2. Secondary Research
- 10.3. Primary Research
- 10.3.1. Analyst Tools and Models
- 10.4. Research Limitations
- 10.5. Assumptions
- 10.6. Insights From Primary Respondents
- 10.7. Why Healthcare Foresights
- Chapter 11. Standard Report Commercials & Add-Ons
- 11.1. Customization Options
- 11.2. Subscription Module For Market Research Reports
- 11.3. Client Testimonials
- Chapter 12. List Of Figures
- 12.1. Figures No 1 to 25
- Chapter 13. List Of Tables
- 13.1. Tables No 1 to 46
Prominent Player
- Sterling Planet
- Ecohz
- Shell
- Statkraft
- Xpansiv
- EDF Trading Limited
- ENGIE
- Enel Green Power
- STX Group
- TerraPass
- BEF
- Targray
- Ameresco
- 3Degrees
- Constellation
- Others
FAQs
The key players in the market are Sterling Planet, Ecohz, Shell, Statkraft, Xpansiv, EDF Trading Limited, ENGIE, Enel Green Power, STX Group, TerraPass, BEF, Targray, Ameresco, 3Degrees, Constellation, Others.
Legal requirements and policies are the most important elements that can impact the REC market, as they can influence market demand and shape market operations. RPSs (or RPOs) are the most significant government regulations to force utilities or large energy usage consumers to buy/produce renewable electricity at a certain minimum share of their electricity consumption/generation. Government is involved in REC market development by formulating certification of schemes, building trading channels, and setting trading regulations for regulation realization and market integration. Besides, government actions of subsidizing, providing tax incentives for renewable energy producers, and punishing those who do not comply with RPS/RPO standards are also effective to maintain the confidence of the REC market and generate the follow-up investment.
REC price and the effective price level have important impacts on the market. Favorable prices and stable prices can motivate more companies or utilities to buy excess RECs, also through the voluntary market, because of the increase of demand and market scale. High prices or uncertain prices can lead to decreased participation of small and medium enterprises; as a result, the market scale should be limited. On the other side, the price of the compliance markets is usually controlled by the low supply and high demand, or penalties and other measures, as a high price level, it can stimulate utilities to add more renewable energy capacity.
According to the present analysis and forecast modeling, the market of renewable energy certificate will witness a significant growth of about USD 195.2 billion in the year 2035 with the growing innovative product launch, increasing collaboration, rising integration of renewable energy across the globe with a CAGR of 24.8% between the years 2026 and 2035.
It is projected that North America will hold the largest market share in the renewable energy certificate market in the forecast period, with a share of about 34% of the global market share, which is attributed to the region presence of major players and the increasing government initiatives.
The Asia Pacific is expected to grow at a highest CAGR during the forecast period. The growth in the region is owing to the growing renewable energy integration.
The growth of the REC market is mainly supported by regulation, such as renewable portfolio standards (RPS) and renewable purchase obligations (RPOs), which obligate the purchase of RECs, and driven by corporate ESG and net-zero commitments, which promote above-regulatory purchases. However, the supply of RECs also grows with the brisk development of renewable capacity; global electricity consumption is on the rise, driven by the world‘s energy transition; improved digital trading platforms and the emergence of blockchain improve market transparencyAll these factors contribute to the overall growth of the market.