Smart Eyewear Technology Market Size, Trends and Insights By Technology (Virtual Reality, Augmented Reality), By Product (Head Mounted Display, Assisted Reality Glasses, Mixed Reality Holographic Displays), By End User (Manufacturing, Transportation & Logistics, Military & Defense, Healthcare, Gaming Industry, Construction & Architecture, Others), and By Region - Global Industry Overview, Statistical Data, Competitive Analysis, Share, Outlook, and Forecast 2026 – 2035
Report Snapshot
CAGR: 22.5%
| Study Period: | 2026-2035 |
| Fastest Growing Market: | Asia-Pacific |
| Largest Market: | North America |
Major Players
- Meta Company
- Sony Corporation
- Microsoft Corporation
- Epson America Inc
- Others
Reports Description
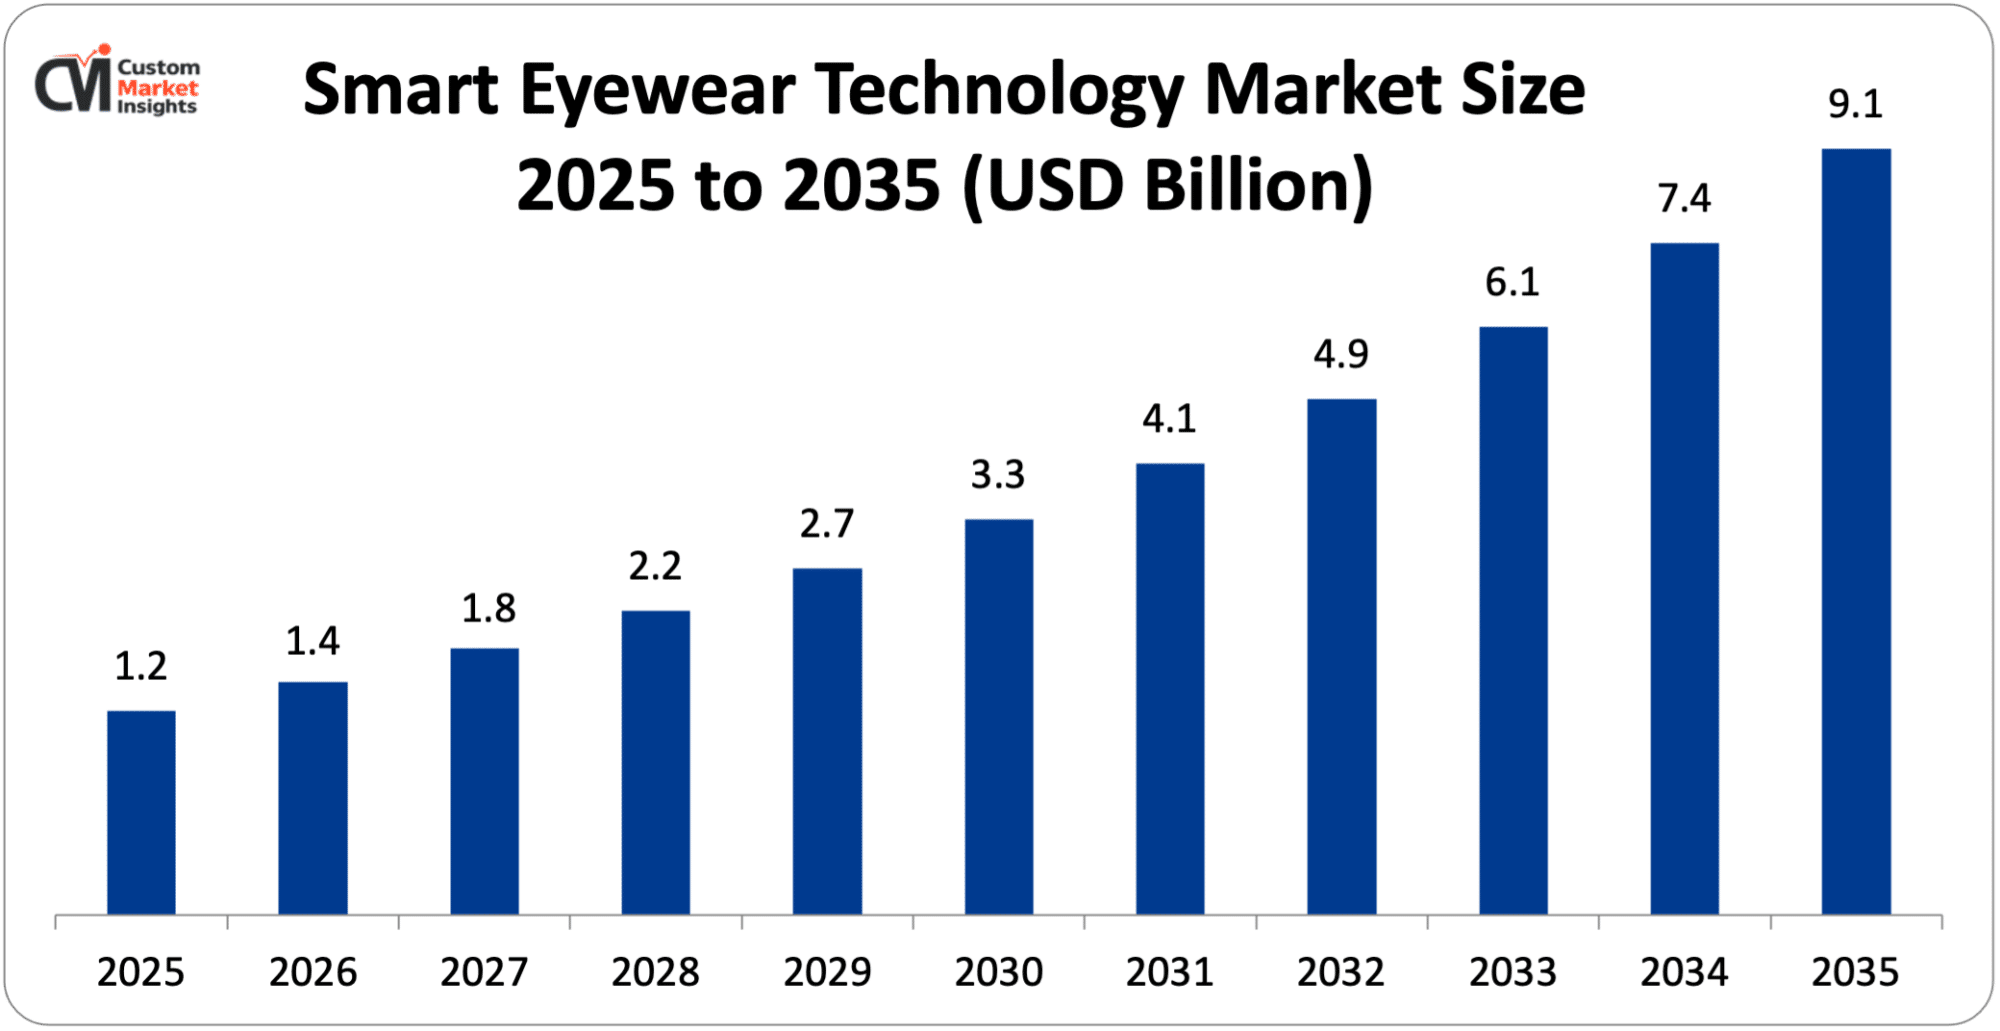
The market size of global smart eyewear technology will be estimated at USD 1.2 billion in 2025 and is expected to grow to between USD 1.4 billion in 2026 and about USD 9.1 billion by 2035, with a current CAGR (compound annual growth rate) of 22.5% during the period of 2026 to 2035. Smart Eyewear Technology is the next generation of wearable electronic technology designed in a glasses format that is embedded with digital technology components comprising sensors, a camera, micro displays, processors, communication modules, and a sound system, providing digital information to the user‘s eye line. These white glasses, in conjunction with digital technology, including augmented reality (AR), artificial intelligence (AI), Bluetooth, and voice control, help users receive notifications, receive directions, track health, talk with others with free hands, view digital information over the field of vision, increase productivity, and meet the needs of industry, healthcare services, and day-to-day activities. They are digitally connected to computers and mobile phones or the cloud and are used in consumer, industrial, health, and enterprise settings.
Market Highlight
- In 2025, North America will dominate the global market with an estimated market share of 38%. The rising innovative product launch and the increasing e-commerce drives the regional market growth.
- The Asia Pacific is growing at the highest CAGR over the analysis period. The growing utilization in diverse sector.
- By technology, the augmented reality is expected to dominate the market over the projected period.
- By product, the head mounted display segment captures the largest market share in 2025.
Significant Growth Factors
The smart eyewear technology market trends present significant growth opportunities due to several factors:
- Rising demand for wearable technology: One of the key factors fueling the smart eyewear technology market is the increased demand for wearable technology. Today, an ever-growing demand for wearables such as fitness bands, smart glasses, and smart watches among consumers and corporates is an important factor contributing to the demand for smart eyewear. Wearable technology becomes increasingly popular as consumers approach a mobile lifestyle. Users want to wear their devices throughout the day to get notifications, ‘see’ their world through dark adaptive lenses, take pictures without pulling out their camera, and blow back that little voice in their head urging them to work faster, faster. The lightweight glasses with bluetooth and other wireless connectivity options allow mobile users to stay connected with their smartphones and other devices. This trend is likely to increase the growth of the smart eyewear market during the forecast period.
- Advancements in AR, AI, and computer vision: The development of more and more advanced AR, AI and computer vision technology will guide the development of smart eyewear in the foreseeable future. Their combination really develops the smart eyewear user experience in some crucial areas, such as providing more real-time data, optimizing the viewing experience, and allowing interaction with the environment. AR enhances the smart eyewear experience by overlaying digital data/images/instructions over the real-world view of consumers and cloud services, performing activities such as navigation, gaming, and industrial and training exercises. AI enables features such as voice assistance, image classification, object recognition, language translation, and contextual suggestions to ease the use of smart eyewear. Computer vision enhances these features by delivering environmental understanding from visual input that facilitates object recognition and environment building. Development of micro-displays, sensors, and edge computers will broaden the application field of smart eyewear in healthcare, manufacturing, logistics, education, and entertainment.
What are the Major Advances Changing the Smart Eyewear Technology Market Today?
- Artificial Intelligence (AI) integration: AI integration is one of the most significant technological innovations that is a driving force and disruptive element for the smart eyewear technology market. AI enables the smart glasses and other devices to process, analyze, and understand the information acquired from digital cameras, sensors, microphones, and other sources in real time and offer a smart and customized experience to the user. With such enhancement, AI enabled smart glasses can recognize and identify objects and environments, interpret commands via voice recognition, translate on a real-time basis, and make the user aware of his/her environment by displaying messaging and contextual data in front of his/her view. Smart glasses with this technology are expected to offer faster, hands-free voice commands and message updates at any time, which would be more efficient for several activities, and such AR could be used in many different applications such as logistics, manufacturing, healthcare, education, and others. For instance, in April 2025, in a big step for wearable tech in India, Meta has said that it will soon be releasing its premier line of AI-enabled smart glasses, built in conjunction with Ray-Ban, into India‘s market. The AI-powered Ray-Ban Meta glasses, designed to provide users with an experience that is free of both hands and distraction, represent another area of the launch of wearable AI products on a broad international basis, and one of the last markets to be introduced to the new hardware will be India.
- Miniaturized components and lightweight design: Miniaturization of components and portability is key for the growth of the smart eyewear technology market. As microelectronics technology continues to grow, chipmakers and component makers are developing calculators, micro displays, sensors, cameras, batteries, and other hardware in incredibly small form factors that are easily incorporated into a pair of traditional-looking, comfortable eyeglasses and sunglasses without neglecting the hardware power needed for digital features such as AR displays, voice interaction, and wireless connections. Moreover, advancements in lightweight and energy-efficient chips are further helping reduce device weight and boosting battery life for better, longer short- and long-term daily usage. Consequently, increasing adoption of these design innovations in today‘s smart glasses is helping enhance consumer enthusiasm and further adoption of smart eyewear for consumer and industrial use.
Category Wise Insights
By Technology
Why Augmented Reality Hold a Prominent Position in the Market?
The augmented reality is expected to dominate the market over the projected period. The AR segment has grown substantially as it enables overlaying of digital content into a user’s natural view of the world. AR-supported smart eyewear offers user-interactive visual overlays that enable synchronized, context-aware access to navigation and wayfinding instructions, notifications, training instructions, and real-time data and analytics without the use of handheld computing devices. This fact has created a surge in the proliferation of AR (augmented reality) smart glasses across several end-user applications such as manufacturing, healthcare, logistics, and field services, where access to crucial data helps improve operational efficiencies. However, the advent of AR smart eyewear-driven immersive gaming, remote collaboration, and AR-assisted training applications are also contributing significantly to the growth. Moreover, investments in the enhancement of micro-displays, sensors, and software platforms used in AR smart glasses, which provide high-resolution visuals in addition to a comfortable form factor, are expected to accelerate their adoption, consequently bolstering the segment revenue growth.
The virtual reality segment is growing at a highest CAGR over the analysis period. With the soaring demand for immersive digital experiences, now it will be feasible to simulate environments virtually and interact with the environment. It can be used for gaming, training, learning, and virtual team applications. The articles simulate themselves to seem real-like by means of high-resolution display, motion sensor, and spatial sound technology. Growing uptake of VR smart eyewear for healthcare (examination and training), manufacturing (cost-efficient but effective operator training), and learning (engaging and authentic environment experience) will significantly spur the demand for the VR smart eyewear products. Improvements in display technology, processing capability, and network connectivity will contribute to enhanced system performance and minimized user latency, thus making VR smart eyewear more accessible and user-friendly. Since market players are heavily investing in immersive technologies, the VR segment is expected to show steady revenue growth and is likely to play a key role in the growth of the overall smart eyewear technology market.
By Product
Why Head Mounted Display Dominates the Smart Eyewear Technology Market?
The head mounted display segment captures the largest market share in 2025. Head-mounted displays will accelerate these trends by delivering immersive visual interfaces and enabling natural, untethered, head-based access to digital information. A head-mounted display (HMD) is a device, generally incorporated into glasses or goggles, that can be worn by someone and that can project digital images, augmented reality, and virtual worlds into the wearer‘s line of sight. HMDs are utilized in many healthcare, manufacturing, defense, logistics, and industrial applications to optimize information rendering and remote operation/monitoring. Increasing popularity of AR and VR applications for game consoles, professional simulators, and training applications will spur the demand for head-mounted display-centric smart eyewear. Ongoing miniaturization of micro-displays, evolution of more technologically advanced lightweight components, and high-end computing capacities will skyrocket display quality, comfort, and battery efficiency to newer heights. The coming years will see this segment accrue huge units and revenues from the adoption of wearable visualization systems.
The assisted reality glasses segment is growing at a highest CAGR over the projected period. This is primarily driven by adoption as this technology becomes increasingly prevalent in enterprise and industrial use cases. Assisted reality glasses present a small screen within the user‘s natural field of view for displaying contextual digital information. The user can complete the task while looking at a heads-up display of instructions, data, or images without losing their sense of the real world. Assisted reality headsets are a less immersive option to augmented and virtual reality headsets and are often used to project just visual data to the user to complete a task safely and effectively. The technology is frequently utilized in manufacturing, logistics, field service, healthcare, and maintenance services, where workers can view step-by-step instructions, receive remote expert guidance, and have access to relevant data when needed. There is also a growing demand for assisted reality glasses for remote collaboration and workforce training that is further supporting revenue growth for this segment. Constant advances in low-weight hardware, voice recognition, and data transfer technology are helping drive this segment‘s revenue growth within the smart eyewear segment.
Report Scope
| Feature of the Report | Details |
| Market Size in 2026 | USD 1.4 billion |
| Projected Market Size in 2035 | USD 9.1 billion |
| Market Size in 2025 | USD 1.2 billion |
| CAGR Growth Rate | 22.5% CAGR |
| Base Year | 2025 |
| Forecast Period | 2026-2035 |
| Key Segment | By Technology, Product, End User and Region |
| Report Coverage | Revenue Estimation and Forecast, Company Profile, Competitive Landscape, Growth Factors and Recent Trends |
| Regional Scope | North America, Europe, Asia Pacific, Middle East & Africa, and South & Central America |
| Buying Options | Request tailored purchasing options to fulfil your requirements for research. |
Regional Analysis
How Big is North America Smart Eyewear Technology Market Size?
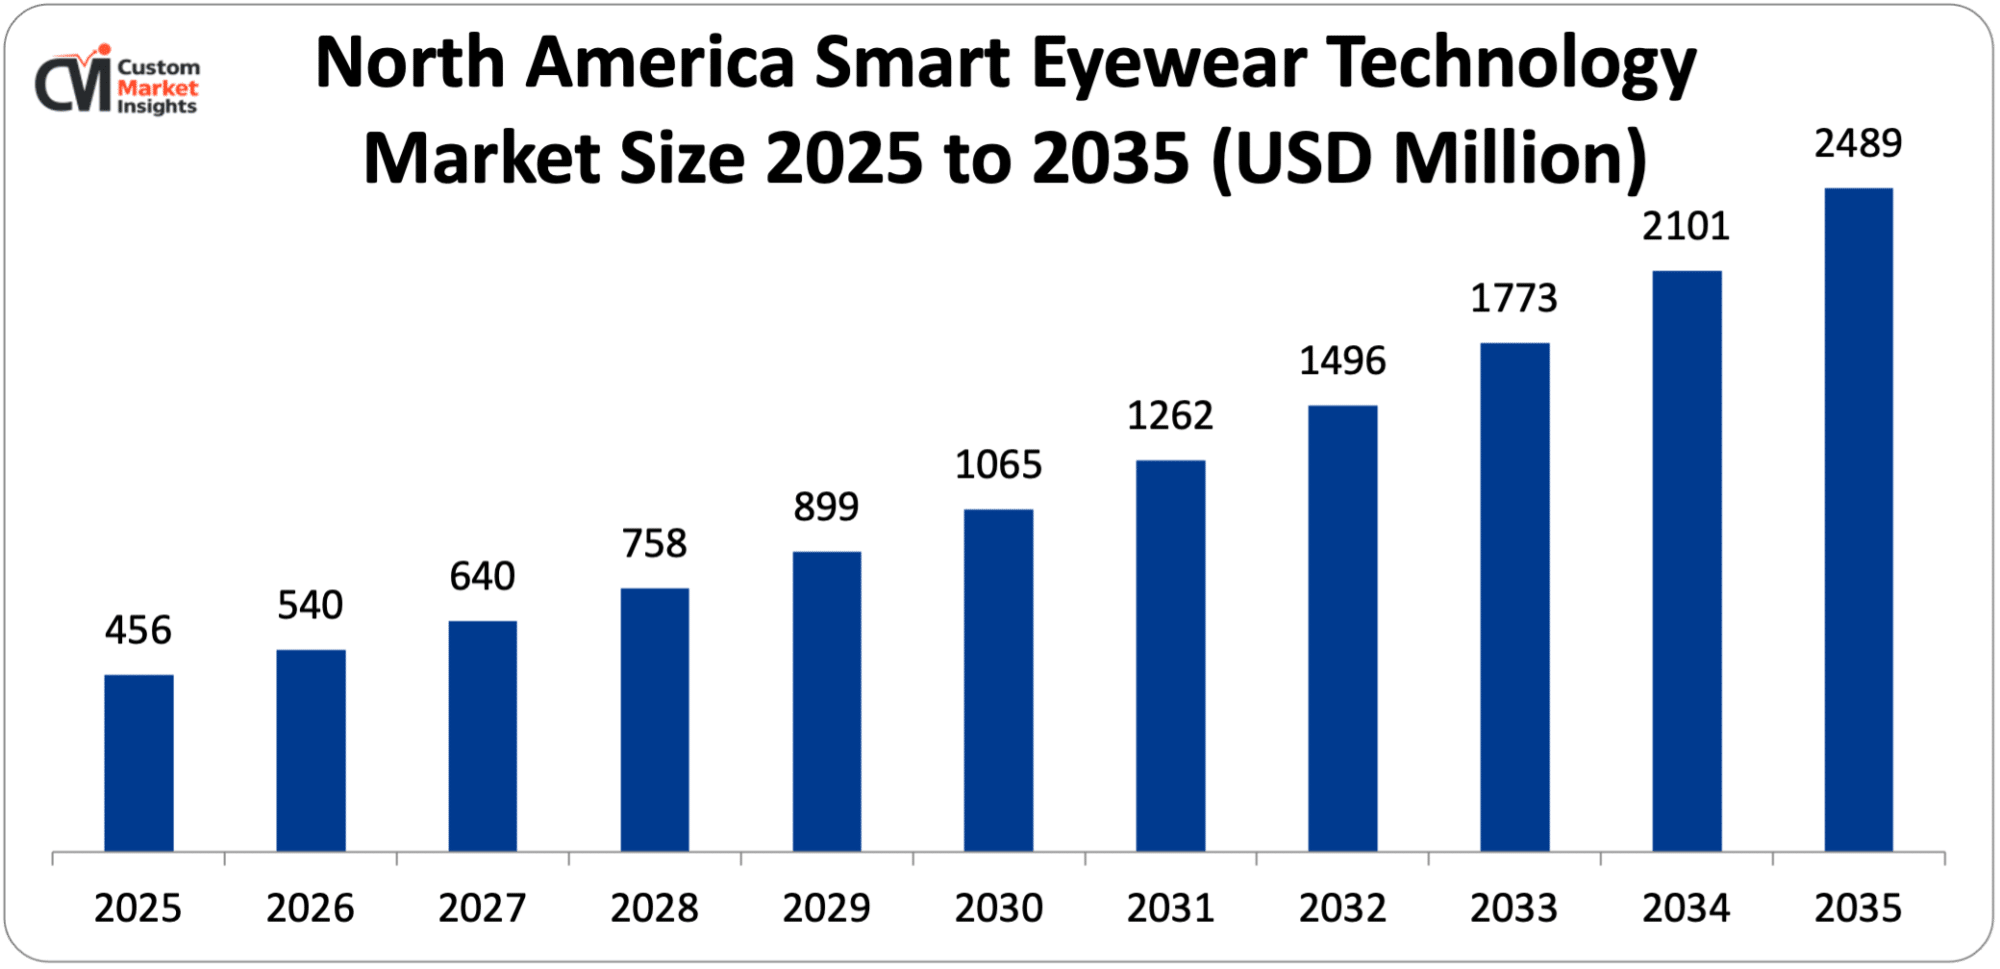
Its market size, in terms of North America smart eyewear technology, is projected to be USD 456 million in 2025 with a growth of about USD 2489 million in 2035 with a CAGR of 18.5% between 2026 and 2035.
Why did North America Dominate the Smart Eyewear Technology Market in 2025?
In 2025, North America will dominate the global market with an estimated market share of 38%. The geographical expansion is attributed to rapid adoption of new technology along with high consumer acceptance of wearable devices and rising investment in augmented reality (AR) and artificial intelligence (AI) technology in the region. The presence of large technology companies and several start-ups involved in the development of various innovative smart glasses solutions has evoked the development of various innovative products coupled with the commercialization of such products in the region. Additionally, the increasing requirements of smart glasses in industrial applications, such as manufacturing, healthcare, logistics, and field services, and the resulting growth in demand for smart eyewear are also likely to contribute substantially to the revenue generated by this market, as such glasses provide hands-free connectivity to real-time data, remote expert guidance, and workflow guidance. Growing consumer requirements for connected wearable devices and the proliferation of immersive technologies in gaming, entertainment, and other training applications are factors expected to boost the growth of the market. North America would witness the continued growth of the smart eyewear technology market on account of high expenditure on technology, well-established advanced digital infrastructure, and early adoption of emerging technological trends in countries such as the US and Canada.
US Smart Eyewear Technology Market Trends
In North America region, US leads the industry expansion over the projected period. The presence of major technology giants in the area drives the market growth. These players constantly launch the innovative product in the market. For instance, in December 2025, Warby Parker revealed that it will partner with Google of Alphabet to create lightweight, AI-enhanced glasses. It is scheduled to launch in 2026.
Why is Europe Experiencing a Significant Growth in the Smart Eyewear Technology Market?
Europe holds a significant market share in 2025. The market is driven by increasing adoption of high technology-enabled wearables, along with broadening application of AR and AI enabled solutions across multiple industries. The mounting demand for smart glasses is growing in the manufacturing, healthcare, automotive, and logistics industries, where they are used for on-demand operating, sharing live information, and working without hands. Further, the focused digital transvers and Industry 4.0 projects by European organizations are further supporting the acceptance of smart glasses in the areas of workforce training, operations, and maintenance. In 2014, the major regional markets included Germany, UK and France, attributed to a large number of research activities on wearable technologies together with a well-established technological foundation. The growing focus of AR even in being used for immersive video gaming and wearable and new AR innovations in Europe, will continue to lift the market share of revenue for smart eyewear in the technological segment.
UK Smart Eyewear Technology Market Trends
UK held the dominant position in the market. The rising popularity of immersive technologies in gaming, training, and education is also contributing to the demand for smart glasses among consumers and enterprises.
Why is the Asia Pacific growing at a rapid rate in the Smart Eyewear Technology Market?
The Asia Pacific is expected to grow at a highest CAGR over the projected period. The market is driven by the trend of increasing use of wearable devices, growing consumer electronics sectors, and investments in super advanced technologies such as Augmented Reality (AR), Artificial Intelligence (AI), and the Internet of Things (IoT). The countries such as China, Japan, South Korea, and India are contributing significantly to market growth owing to their rise in the number of technology start-ups, rising technological competencies, and advancing manufacturing strengths coupled with rising demand for innovative smart devices. The sectoral rising digitalization and adoption of smart eyewear in the manufacturing, logistics, education, and healthcare sectors are boosting the regional growth.
China Smart Eyewear Technology Market Trends
China led the Asia Pacific market. Favorable government encouragement to boost technological innovation and spread high-speed connectivity infrastructure is likely to ensure that the China smart eyewear technology industry records healthy revenue growth.
Why is the Middle East & Africa Region is growing rapidly in the Smart Eyewear Technology?
The MEA region is growing at a steady rate over the projected period. This trend is expected to be driven by increasing adoption of premium digital applications worldwide, together with an increasing push for smart infrastructure and industrial modernization. Middle East countries, such as the United Arab Emirates or Saudi Arabia, are investing heavily in early-stage technology sectors such as augmented reality (AR), AI and smart wearables to enable digital transformation across the entire spectrum of key industrial verticals, for instance, healthcare, construction, logistics, or O&G. Smart glasses are therefore set to become a key enabler for remote assistance, workforce training, maintenance, and instant data access.
UAE Smart Eyewear Technology Market Trends
UAE is growing at the highest CAGR during the forecast period. The rising technological innovation and increasing adoption across end-use industry drives the market growth.
Top Players in the Smart Eyewear Technology Market and Their Offerings
- Meta Company
- Sony Corporation
- Microsoft Corporation
- Epson America Inc
- Lumus Ltd
- Vuzix Corporation
- Google Inc
- Optinvent SA
- Osterhout Design Group
- Kopin Corporation
- Lenovo
- Samsung Electronics Co Ltd
- Recon Instruments
- EssilorLuxottica
- Ricoh
- Others
Key Developments
Smart eyewear technology market has experienced considerable changes in the last two years as the market players are trying to diversify their technological aspects and develop product portfolio using strategic approaches.
- In January 2025, XREAL, the worldwide leader in augmented reality (AR), is announcing a series of groundbreaking collaborations and a new distributor agreement at the annual Consumer Electronics Show 2025 trade show (CES). These collaborations highlight XREAL’s continued commitment to transforming how the world interacts with AR technology and deliver unparalleled immersive experiences, while amplifying sector leaders’ unique contributions in the exciting space. (https://www.prnewswire.com/news-releases/xreal-announces-groundbreaking-collaborations-at-ces-2025-302344140.html)
- In June 2025, EssilorLuxottica and Meta Platforms announced Oakley Meta, a new category of Performance AI glasses that pair Meta’s industry-leading AI technology with Oakley’s pioneering design and PRIZM lenses to transform how consumers experience their biggest wins – on and off the field. Following the category-defining success of Ray-Ban Meta, the #1 selling AI glasses in the world which have sold millions of units since launch, Oakley Meta glasses will be the next product line to come from this long-term partnership. (https://www.essilorluxottica.com/en/newsroom/press-releases/essilorluxottica-and-meta-to-launch-oakley-meta/)
These strategic measures have enabled the companies to reinforce their competitive positions, increase the product line, boost their technological competencies and also seize growth opportunities in the fast-growing Smart Eyewear Technology market.
The Smart Eyewear Technology Market is segmented as follows:
By Technology
- Virtual Reality
- Augmented Reality
By Product
- Head Mounted Display
- Assisted Reality Glasses
- Mixed Reality Holographic Displays
By End User
- Manufacturing
- Transportation & Logistics
- Military & Defense
- Healthcare
- Gaming Industry
- Construction & Architecture
- Others
Regional Coverage:
North America
- U.S.
- Canada
- Mexico
- Rest of North America
Europe
- Germany
- France
- U.K.
- Russia
- Italy
- Spain
- Netherlands
- Rest of Europe
Asia Pacific
- China
- Japan
- India
- New Zealand
- Australia
- South Korea
- Taiwan
- Rest of Asia Pacific
The Middle East & Africa
- Saudi Arabia
- UAE
- Egypt
- Kuwait
- South Africa
- Rest of the Middle East & Africa
Latin America
- Brazil
- Argentina
- Rest of Latin America
Table of Contents
- Chapter 1. Report Introduction
- 1.1. Report Description
- 1.1.1. Purpose of the Report
- 1.1.2. USP & Key Offerings
- 1.2. Key Benefits For Stakeholders
- 1.3. Target Audience
- 1.4. Report Scope
- 1.1. Report Description
- Chapter 2. Market Overview
- 2.1. Report Scope (Segments And Key Players)
- 2.1.1. Smart Eyewear Technology by Segments
- 2.1.2. Smart Eyewear Technology by Region
- 2.2. Executive Summary
- 2.2.1. Market Size & Forecast
- 2.2.2. Smart Eyewear Technology Market Attractiveness Analysis, By Technology
- 2.2.3. Smart Eyewear Technology Market Attractiveness Analysis, By Product
- 2.2.4. Smart Eyewear Technology Market Attractiveness Analysis, By End User
- 2.1. Report Scope (Segments And Key Players)
- Chapter 3. Market Dynamics (DRO)
- 3.1. Market Drivers
- 3.1.1. Rising demand for wearable technology
- 3.1.2. Advancements in AR & AI and computer vision
- 3.2. Market Restraints
- 3.3. Market Opportunities
- 3.5. Pestle Analysis
- 3.6. Porter Forces Analysis
- 3.7. Technology Roadmap
- 3.8. Value Chain Analysis
- 3.9. Government Policy Impact Analysis
- 3.10. Pricing Analysis
- 3.1. Market Drivers
- Chapter 4. Smart Eyewear Technology Market – By Technology
- 4.1. Technology Market Overview, By Technology Segment
- 4.1.1. Smart Eyewear Technology Market Revenue Share, By Technology, 2025 & 2035
- 4.1.2. Virtual Reality
- 4.1.3. Smart Eyewear Technology Share Forecast, By Region (USD Billion)
- 4.1.4. Comparative Revenue Analysis, By Country, 2025 & 2035
- 4.1.5. Key Market Trends, Growth Factors, & Opportunities
- 4.1.6. Augmented Reality
- 4.1.7. Smart Eyewear Technology Share Forecast, By Region (USD Billion)
- 4.1.8. Comparative Revenue Analysis, By Country, 2025 & 2035
- 4.1.9. Key Market Trends, Growth Factors, & Opportunities
- 4.1. Technology Market Overview, By Technology Segment
- Chapter 5. Smart Eyewear Technology Market – By Product
- 5.1. Product Market Overview, By Product Segment
- 5.1.1. Smart Eyewear Technology Market Revenue Share, By Product, 2025 & 2035
- 5.1.2. Head Mounted Display
- 5.1.3. Smart Eyewear Technology Share Forecast, By Region (USD Billion)
- 5.1.4. Comparative Revenue Analysis, By Country, 2025 & 2035
- 5.1.5. Key Market Trends, Growth Factors, & Opportunities
- 5.1.6. Assisted Reality Glasses
- 5.1.7. Smart Eyewear Technology Share Forecast, By Region (USD Billion)
- 5.1.8. Comparative Revenue Analysis, By Country, 2025 & 2035
- 5.1.9. Key Market Trends, Growth Factors, & Opportunities
- 5.1.10. Mixed Reality Holographic Displays
- 5.1.11. Smart Eyewear Technology Share Forecast, By Region (USD Billion)
- 5.1.12. Comparative Revenue Analysis, By Country, 2025 & 2035
- 5.1.13. Key Market Trends, Growth Factors, & Opportunities
- 5.1. Product Market Overview, By Product Segment
- Chapter 6. Smart Eyewear Technology Market – By End User
- 6.1. End User Market Overview, By End User Segment
- 6.1.1. Smart Eyewear Technology Market Revenue Share, By End User, 2025 & 2035
- 6.1.2. Manufacturing
- 6.1.3. Smart Eyewear Technology Share Forecast, By Region (USD Billion)
- 6.1.4. Comparative Revenue Analysis, By Country, 2025 & 2035
- 6.1.5. Key Market Trends, Growth Factors, & Opportunities
- 6.1.6. Transportation & Logistics
- 6.1.7. Smart Eyewear Technology Share Forecast, By Region (USD Billion)
- 6.1.8. Comparative Revenue Analysis, By Country, 2025 & 2035
- 6.1.9. Key Market Trends, Growth Factors, & Opportunities
- 6.1.10. Military & Defense
- 6.1.11. Smart Eyewear Technology Share Forecast, By Region (USD Billion)
- 6.1.12. Comparative Revenue Analysis, By Country, 2025 & 2035
- 6.1.13. Key Market Trends, Growth Factors, & Opportunities
- 6.1.14. Healthcare
- 6.1.15. Smart Eyewear Technology Share Forecast, By Region (USD Billion)
- 6.1.16. Comparative Revenue Analysis, By Country, 2025 & 2035
- 6.1.17. Key Market Trends, Growth Factors, & Opportunities
- 6.1.18. Gaming Industry
- 6.1.19. Smart Eyewear Technology Share Forecast, By Region (USD Billion)
- 6.1.20. Comparative Revenue Analysis, By Country, 2025 & 2035
- 6.1.21. Key Market Trends, Growth Factors, & Opportunities
- 6.1.22. Construction & Architecture
- 6.1.23. Smart Eyewear Technology Share Forecast, By Region (USD Billion)
- 6.1.24. Comparative Revenue Analysis, By Country, 2025 & 2035
- 6.1.25. Key Market Trends, Growth Factors, & Opportunities
- 6.1.26. Others
- 6.1.27. Smart Eyewear Technology Share Forecast, By Region (USD Billion)
- 6.1.28. Comparative Revenue Analysis, By Country, 2025 & 2035
- 6.1.29. Key Market Trends, Growth Factors, & Opportunities
- 6.1. End User Market Overview, By End User Segment
- Chapter 7. Smart Eyewear Technology Market – Regional Analysis
- 7.1. Smart Eyewear Technology Market Overview, By Region Segment
- 7.1.1. Global Smart Eyewear Technology Market Revenue Share, By Region, 2025 & 2035
- 7.1.2. Global Smart Eyewear Technology Market Revenue, By Region, 2026 – 2035 (USD Billion)
- 7.1.3. Global Smart Eyewear Technology Market Revenue, By Technology, 2026 – 2035
- 7.1.4. Global Smart Eyewear Technology Market Revenue, By Product, 2026 – 2035
- 7.1.5. Global Smart Eyewear Technology Market Revenue, By End User, 2026 – 2035
- 7.2. North America
- 7.2.1. North America Smart Eyewear Technology Market Revenue, By Country, 2026 – 2035 (USD Billion)
- 7.2.2. North America Smart Eyewear Technology Market Revenue, By Technology, 2026 – 2035
- 7.2.3. North America Smart Eyewear Technology Market Revenue, By Product, 2026 – 2035
- 7.2.4. North America Smart Eyewear Technology Market Revenue, By End User, 2026 – 2035
- 7.2.5. U.S. Smart Eyewear Technology Market Revenue, 2026 – 2035 (USD Billion)
- 7.2.6. Canada Smart Eyewear Technology Market Revenue, 2026 – 2035 (USD Billion)
- 7.2.7. Mexico Smart Eyewear Technology Market Revenue, 2026 – 2035 (USD Billion)
- 7.2.8. Rest of North America Smart Eyewear Technology Market Revenue, 2026 – 2035 (USD Billion)
- 7.3. Europe
- 7.3.1. Europe Smart Eyewear Technology Market Revenue, By Country, 2026 – 2035 (USD Billion)
- 7.3.2. Europe Smart Eyewear Technology Market Revenue, By Technology, 2026 – 2035
- 7.3.3. Europe Smart Eyewear Technology Market Revenue, By Product, 2026 – 2035
- 7.3.4. Europe Smart Eyewear Technology Market Revenue, By End User, 2026 – 2035
- 7.3.5. Germany Smart Eyewear Technology Market Revenue, 2026 – 2035 (USD Billion)
- 7.3.6. France Smart Eyewear Technology Market Revenue, 2026 – 2035 (USD Billion)
- 7.3.7. U.K. Smart Eyewear Technology Market Revenue, 2026 – 2035 (USD Billion)
- 7.3.8. Russia Smart Eyewear Technology Market Revenue, 2026 – 2035 (USD Billion)
- 7.3.9. Italy Smart Eyewear Technology Market Revenue, 2026 – 2035 (USD Billion)
- 7.3.10. Spain Smart Eyewear Technology Market Revenue, 2026 – 2035 (USD Billion)
- 7.3.11. Netherlands Smart Eyewear Technology Market Revenue, 2026 – 2035 (USD Billion)
- 7.3.12. Rest of Europe Smart Eyewear Technology Market Revenue, 2026 – 2035 (USD Billion)
- 7.4. Asia Pacific
- 7.4.1. Asia Pacific Smart Eyewear Technology Market Revenue, By Country, 2026 – 2035 (USD Billion)
- 7.4.2. Asia Pacific Smart Eyewear Technology Market Revenue, By Technology, 2026 – 2035
- 7.4.3. Asia Pacific Smart Eyewear Technology Market Revenue, By Product, 2026 – 2035
- 7.4.4. Asia Pacific Smart Eyewear Technology Market Revenue, By End User, 2026 – 2035
- 7.4.5. China Smart Eyewear Technology Market Revenue, 2026 – 2035 (USD Billion)
- 7.4.6. Japan Smart Eyewear Technology Market Revenue, 2026 – 2035 (USD Billion)
- 7.4.7. India Smart Eyewear Technology Market Revenue, 2026 – 2035 (USD Billion)
- 7.4.8. New Zealand Smart Eyewear Technology Market Revenue, 2026 – 2035 (USD Billion)
- 7.4.9. Australia Smart Eyewear Technology Market Revenue, 2026 – 2035 (USD Billion)
- 7.4.10. South Korea Smart Eyewear Technology Market Revenue, 2026 – 2035 (USD Billion)
- 7.4.11. Taiwan Smart Eyewear Technology Market Revenue, 2026 – 2035 (USD Billion)
- 7.4.12. Rest of Asia Pacific Smart Eyewear Technology Market Revenue, 2026 – 2035 (USD Billion)
- 7.5. The Middle-East and Africa
- 7.5.1. The Middle-East and Africa Smart Eyewear Technology Market Revenue, By Country, 2026 – 2035 (USD Billion)
- 7.5.2. The Middle-East and Africa Smart Eyewear Technology Market Revenue, By Technology, 2026 – 2035
- 7.5.3. The Middle-East and Africa Smart Eyewear Technology Market Revenue, By Product, 2026 – 2035
- 7.5.4. The Middle-East and Africa Smart Eyewear Technology Market Revenue, By End User, 2026 – 2035
- 7.5.5. Saudi Arabia Smart Eyewear Technology Market Revenue, 2026 – 2035 (USD Billion)
- 7.5.6. UAE Smart Eyewear Technology Market Revenue, 2026 – 2035 (USD Billion)
- 7.5.7. Egypt Smart Eyewear Technology Market Revenue, 2026 – 2035 (USD Billion)
- 7.5.8. Kuwait Smart Eyewear Technology Market Revenue, 2026 – 2035 (USD Billion)
- 7.5.9. South Africa Smart Eyewear Technology Market Revenue, 2026 – 2035 (USD Billion)
- 7.5.10. Rest of the Middle East & Africa Smart Eyewear Technology Market Revenue, 2026 – 2035 (USD Billion)
- 7.6. Latin America
- 7.6.1. Latin America Smart Eyewear Technology Market Revenue, By Country, 2026 – 2035 (USD Billion)
- 7.6.2. Latin America Smart Eyewear Technology Market Revenue, By Technology, 2026 – 2035
- 7.6.3. Latin America Smart Eyewear Technology Market Revenue, By Product, 2026 – 2035
- 7.6.4. Latin America Smart Eyewear Technology Market Revenue, By End User, 2026 – 2035
- 7.6.5. Brazil Smart Eyewear Technology Market Revenue, 2026 – 2035 (USD Billion)
- 7.6.6. Argentina Smart Eyewear Technology Market Revenue, 2026 – 2035 (USD Billion)
- 7.6.7. Rest of Latin America Smart Eyewear Technology Market Revenue, 2026 – 2035 (USD Billion)
- 7.1. Smart Eyewear Technology Market Overview, By Region Segment
- Chapter 8. Competitive Landscape
- 8.1. Company Market Share Analysis – 2025
- 8.1.1. Global Smart Eyewear Technology Market: Company Market Share, 2025
- 8.2. Global Smart Eyewear Technology Market Company Market Share, 2024
- 8.1. Company Market Share Analysis – 2025
- Chapter 9. Company Profiles
- 9.1. Meta Company
- 9.1.1. Company Overview
- 9.1.2. Key Executives
- 9.1.3. Product Portfolio
- 9.1.4. Financial Overview
- 9.1.5. Operating Business Segments
- 9.1.6. Business Performance
- 9.1.7. Recent Developments
- 9.2. Sony Corporation
- 9.3. Microsoft Corporation
- 9.4. Epson America Inc
- 9.5. Lumus Ltd
- 9.6. Vuzix Corporation
- 9.7. Google Inc
- 9.8. Optinvent SA
- 9.9. Osterhout Design Group
- 9.10. Kopin Corporation
- 9.11. Lenovo
- 9.12. Samsung Electronics Co Ltd
- 9.13. Recon Instruments
- 9.14. EssilorLuxottica
- 9.15. Ricoh
- 9.16. Others.
- 9.1. Meta Company
- Chapter 10. Research Methodology
- 10.1. Research Methodology
- 10.2. Secondary Research
- 10.3. Primary Research
- 10.3.1. Analyst Tools and Models
- 10.4. Research Limitations
- 10.5. Assumptions
- 10.6. Insights From Primary Respondents
- 10.7. Why Custom Market Insights
- Chapter 11. Standard Report Commercials & Add-Ons
- 11.1. Customization Options
- 11.2. Subscription Module For Market Research Reports
- 11.3. Client Testimonials
List Of Figures
Figures No 1 to 28
List Of Tables
Tables No 1 to 46
Prominent Player
- Meta Company
- Sony Corporation
- Microsoft Corporation
- Epson America Inc
- Lumus Ltd
- Vuzix Corporation
- Google Inc
- Optinvent SA
- Osterhout Design Group
- Kopin Corporation
- Lenovo
- Samsung Electronics Co Ltd
- Recon Instruments
- EssilorLuxottica
- Ricoh
- Others
FAQs
The key players in the market are Meta Company, Sony Corporation, Microsoft Corporation, Epson America Inc, Lumus Ltd, Vuzix Corporation, Google Inc, Optinvent SA, Osterhout Design Group, Kopin Corporation, Lenovo, Samsung Electronics Co Ltd, Recon Instruments, EssilorLuxottica, Ricoh, Others.
Government regulations will be an important driver for the smart eyewear technology market by providing guidelines with regard to the issues of data security and anonymity in addition to generic standards for electronic devices and applicable technology. Guidelines for the use of cameras, identification features, and data collection processes would also promote a faster adoption of privacy protection measures in smart eyewear to cater to the requirements of cybersecurity standards. Guidelines for certification of electronic devices as well as standards for futuristic wearable technologies would also determine the development and commercialization of smart eyewear devices. Comprehensible national policies favoring technological innovation are accounted to have a positive effect on this market, whereas exacting regulatory procedures are likely to hinder growth.
The pricing of the Smart Eyewear Technology is imperative to how the industry grows and develops. Incorporating features like augmented reality displays, sensors, and artificial intelligence makes smart eyewear priced higher, thus discouraging the budget-conscious consumers and consequently creating slower growth. The more affordable eyewear is easier to access, and being manufactured at a much more competitive price is widening the reach of consumers.
According to the present analysis and forecast modeling, the market of Smart Eyewear Technology will witness a significant growth of about USD 913 billion in the year 2035 with the growing innovative product launch, increasing e-commerce, growing demand from end-use sector with a CAGR of 22.5% between the years 2026 and 2035.
It is projected that North America will hold the largest market share in the smart eyewear technology market in the forecast period, with a share of about 38% of the global market share, which is attributed to the presence of major players and increasing technological advancements.
The Asia Pacific is expected to grow at a highest CAGR during the forecast period. The growth in the region is owing to the rising urbanization and increasing gaming industry.
Market growth for the smart eyewear technology is mainly powered by the increasing demand for wearable technology, the developments in augmented reality (AR), artificial intelligence (AI), and computer vision technology, and the widespread use of hands-free digital devices in various sectors. Expanding adoption of smart eyewear in healthcare, manufacturing, logistics, and field services to enable real-time data access and tele-assistance is also contributing to the market growth.