Solar Energy Market Size, Trends and Insights By Component (Solar Modules/Panels, Inverters (String, Central, Micro), Mounting and Tracking Systems, Balance-of-System and Electricals, Energy Storage and Hybrid Integration), By Technology (Solar Photovoltaic (PV), Concentrated Solar Power (CSP)), By End User (Utility-Scale, Commercial and Industrial (C&I), Residential), and By Region - Global Industry Overview, Statistical Data, Competitive Analysis, Share, Outlook, and Forecast 2026 – 2035
Report Snapshot
CAGR: 16.5%
| Study Period: | 2026-2035 |
| Fastest Growing Market: | North America |
| Largest Market: | Asia Pacific |
Major Players
- BrightSource Energy Inc.
- JA Solar Technology Co. Ltd
- SunPower Corporation
- REC Solar Holdings AS
- Others
Reports Description
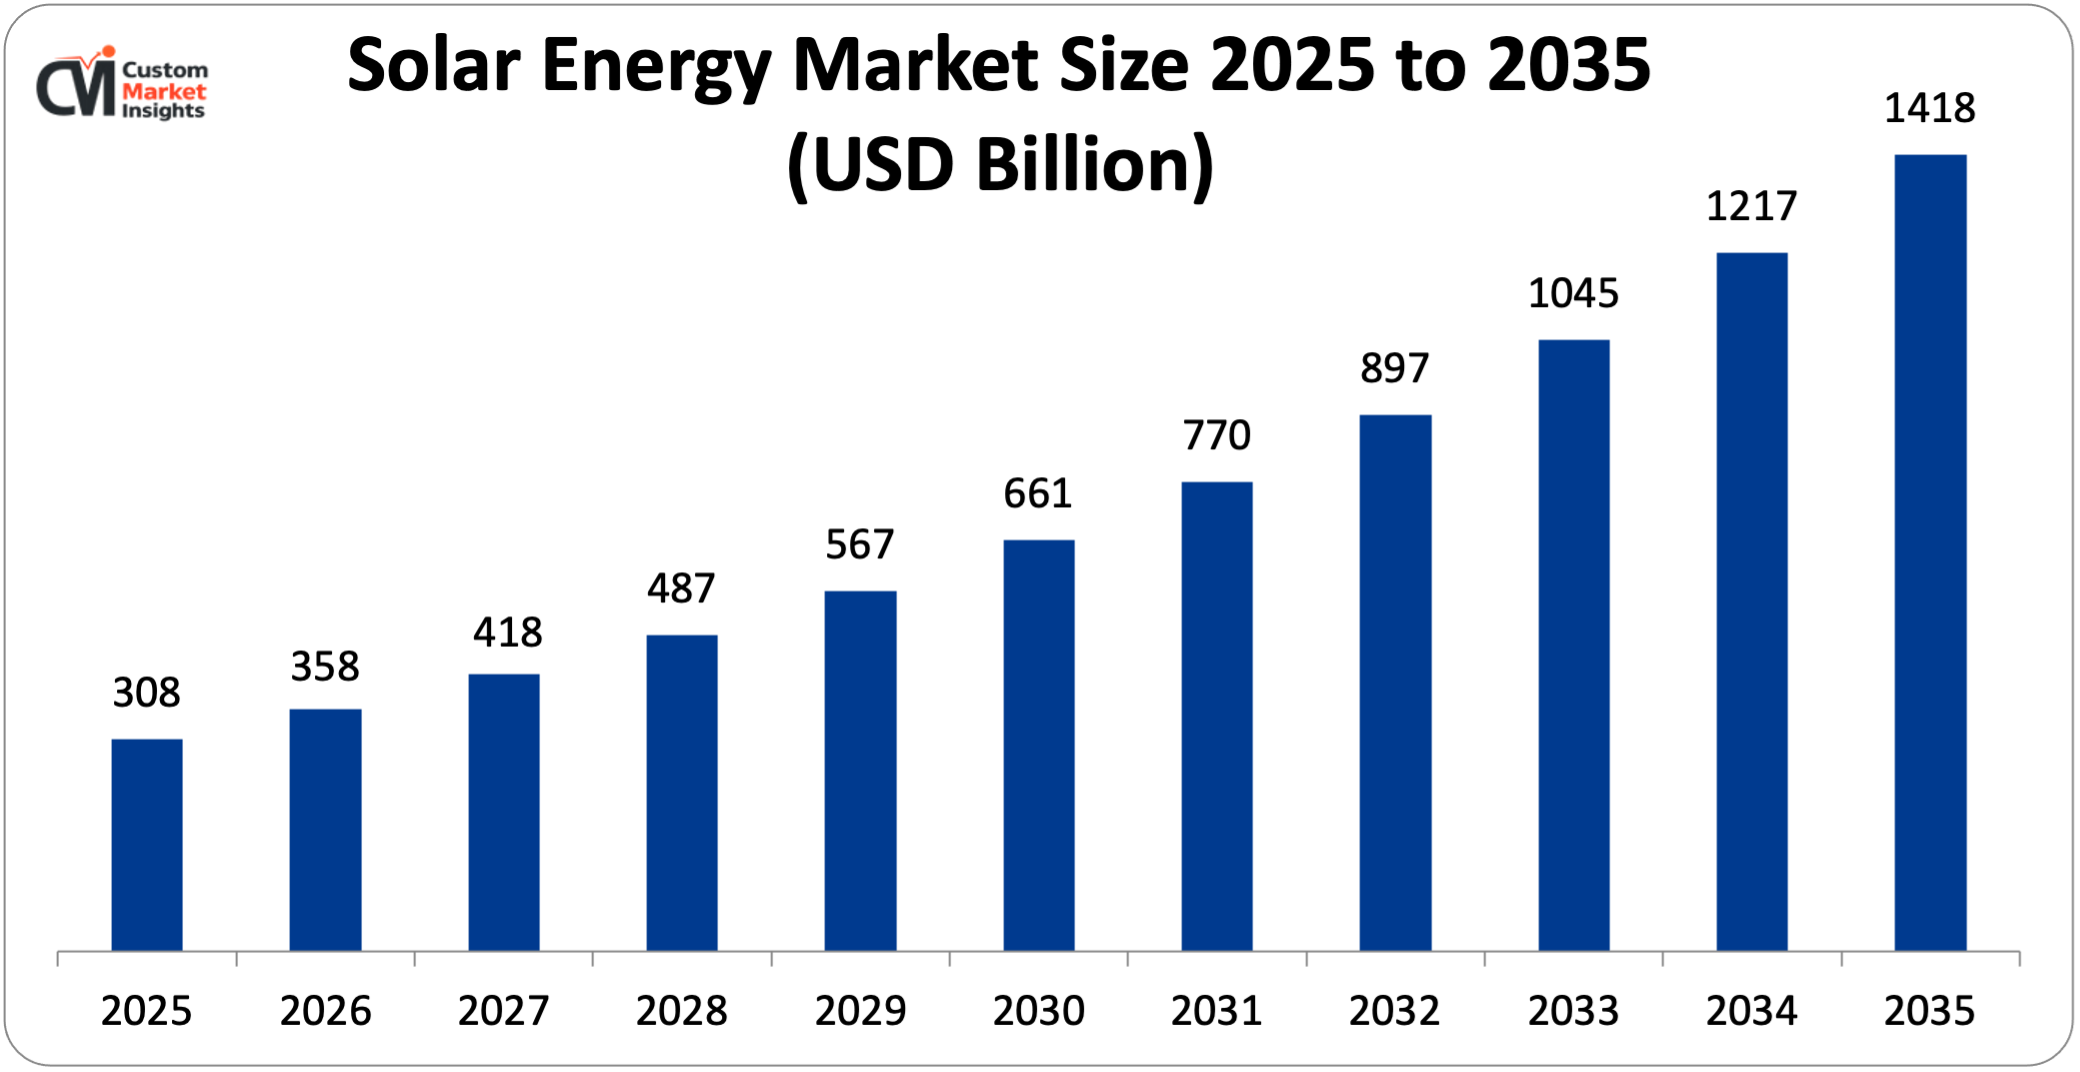
The market size of global solar energy will be estimated at USD 308 billion in 2025 and is expected to grow to between USD 359 billion in 2026 and about USD 1418 billion by 2035, with a current CAGR (compound annual growth rate) of 16.5% during the period of 2026 to 2035. Solar Energy is a form of energy from solar radiation, and it is converted into more usable forms of energy, such as electricity and heat, using different technologies (e.g., PV panels, solar thermal, and concentrated solar power (CSP)).
Solar energy is a renewable, “sustainable” form because of the natural replenishment of the sun, and the maximum potential of the energy service it provides is available to all. Solar energy captures sunlight and converts it into either electricity via photovoltaic cells or heat for water, industrial processes, and direct heating purposes.
Market Highlight
- In 2025, the Asia Pacific will dominate the global market with an estimated market share of 48%. The favorable government initiatives drive the market growth.
- North America is growing at the highest CAGR over the analysis period. The increasing investment in solar PV drives the market growth.
- By component, the solar modules/panels segment dominated the market in 2025.
- By technology, the Solar Photovoltaic (PV) segment captures the largest market share in 2025 of over 95%.
- By end user, the utility-scale segment captures the largest market share in 2025 of over 50%.
Significant Growth Factors
The solar energy market trends present significant growth opportunities due to several factors:
- Rising Demand for Clean and Renewable Energy: One important reason for the rise of a solar energy market is the increasing demand for clean and renewable energy from both businesses and government orders that have shifted away from fossil fuels to reduce greenhouse gas emissions and combat climate change. As a result, the application of energy from renewable sources, both by people and industries, has been spreading out with many more factors. For instance, the global capacity of Solar PV has increased from approximately 710 GW in 2020 to approximately 1,865 GW in 2024, according to IRENA, which has undoubtedly evidenced how fast the application of solar power as one of the renewable sources is contributing to the application of energy use. The rising demand for renewable sources of energy is also evidenced by the total amount of about 452 GW installed globally in 2024 which has comprised more than 75 percent of total renewable capacity additions for the year. In fact, the global addition of solar PV was about 597 GW in 2024 that has not even mentioned the growth of 33%, ceteris paribus, when compared to 2023. These imply to us that the worldwide demand for electricity from solar energy would be skyrocketing and unstoppable unless it would come to the governments’ disfavor. The IEA forecasted that 95 percent of all renewable capacity additions through 2030 would be from solar PV and wind due to their falling prices and growing political support.
- Government Incentives and Policy Support: Governments providing incentives and policy support are the major factors that are driving the growth of the solar energy market by lowering the cost of installation and thus stimulating the investment and renewable energy market. Many countries globally support renewable energy projects by providing incentives like subsidies, tax incentives, feed-in tariffs, and renewable energy targets that lower the cost of solar energy systems and make them affordable for households, commercial entities, and utilities. Increasing government policies’ support increases the solar installations number and hence the market. The support by the government is clearly evident from some macroeconomic statistical data, where the Indian government‘s contributions and renewable energy incentives have driven the rapid growth of the solar power industry in India, with installed solar power capacity growing to about 132.85 GW in November 2025 from 94.17 GW in November 2024 with an increase of more than 41%. Examples of other policy incentives are household subsidies for power systems of up to 3 kW and between 3 and 10 kW, covering about 40% and about 20% of system costs, respectively, lowering the high initial investment costs for households.
What are the Major Advances Changing the Solar Energy Market Today?
- Perovskite Solar Cells and Tandem Technology: Perovskite solar cells and tandem solar technologies are making a huge impact on the market for solar energy today. Perovskite materials refer to a family of crystalline compounds that are capable of absorbing sunlight effectively and transforming it into electricity. They are also capable of being manufactured using simplified and potentially lower-cost processes such as printing or coating thin films, a stark contrast to the more complicated manufacturing process of traditional silicon cells. When used in conjunction with silicon solar cells, perovskites provide a tandem option that captures more of the spectrum of sunlight while substantially improving the conversion efficiency of panels. In fact, in recent years, perovskite–silicon tandem solar cells have delivered efficiencies of over 33%, several points higher than the 20–22% that typical commercial silicon panels operate at today. This translates to storing more electricity on the same panel footprint, thus reducing the space required and cost of installation. And the fact that perovskite cells are so light that they are easily flexible means there are many exciting new ways of using such cells in a more creative manner, such as using them in building-integrated photovoltaics (BIPV) and portable devices, as well as other new and inventive rooftop systems. With advances in technology and the foundry still growing, one would expect the usage of perovskite cells and tandem cells to increase yields and decrease the cost of solar energy, revolutionizing the way in which the world uses solar energy.
- Smart Solar Systems and AI-Driven Optimization: Smart solar systems with artificial intelligence (AI) and other digital applications have the potential to unlock significant value for the solar energy market. After the installation of the system, AI algorithms, internet of things (IoT) sensors, smart inverters, and real-time data analysis enable the operation of optimizers that automatically run the self-optimizing systems, like in the case of system state monitoring, solar energy production enhancement, and system efficiency optimization. With the help of weather and sun conditions information, as well as operation data, AI and automation can autonomously adjust the solar cell parameters by using the solar tracking systems, predict energy output, and warn about the presence of technical problems before the failure of the component equipment. The main benefit of the implementation of these optimizers is the positive effect on the energy output. As described in the previous paragraph, the energy output from a single-axis solar tracking system is increased by approximately 15–25% in comparison to a fixed tilt without tracking. Furthermore, a dual-axis tracking system can generate up to 35%. Moreover, remote performance analysis of thousands of wind turbines and millions of solar panels through predictive operation and maintenance systems indicates that operation and maintenance costs can be cut down by approximately 20–30% through early detection of the equipment failures and management of the maintenance interventions.
Category Wise Insights
By Component
Why Solar Modules/Panels Hold a Prominent Position in the Market?
The solar modules/panels segment dominated the market in 2025. The growing PVs worldwide, including households, commercial, and utility-scale plants, primarily drive the revenue growth of solar cell modules. Revenue growth of solar module segments is mainly enabled by the fast growth of PV capacity around the world, such as the world’s PV capacity being more than 1.8 TW in 2024, up from around 710 GW in 2020, with a consistent growth worldwide, indicating a huge need for solar panels. The revenue of solar module segments is also mainly driven by the sharply decreasing cost of manufacture, the efficiencies of solar modules, and the large scale of Solar farms as well as rooftop installations.
Subsidies of solar panels, large investments provided by corporates, and subsidies provided by the government have also played a vital role in the PV capacity expansion. Innovations also boosted the power output and durability of solar panels, thereby promoting the new solar panels using bifacial modules and TOPCon as well as HJT solar cells in both developed and underdeveloped marketplaces.
The energy storage and hybrid integration segment is growing at a highest CAGR over the analysis period. Energy storage and hybridization are emerging segments that also represent significant contributors to revenue growth in the solar energy sector by allowing more flexible and reliable solar power generation. Solar power generation is inherently intermittent due to reliance on sunlight, and thus battery energy storage systems (BESS) or hybrid systems (solar-diesel and wind) are needed for a more reliable energy supply. Hybrids can be either grid-connected or off-grid.
In fact, on a global level, hybrid solar-plus-storage system installations have been on an upward trajectory in successive years, and the cumulative installed capacity of globally commissioned energy storage capacity (including hybrid systems) was over 200 GWh for the year 2023. Since 2017 the rapid growth trend of the energy storage industry contribution has supported the overall global solar market expansion thanks to the broad-scale implementation of solar plants. Revenue growth is driven by falling prices of lithium-ion batteries and investments in grid-scale storage projects (close to $67 bn) worldwide, coupled with the significant increase of new demand for a more resilient RE mix by governments and utility companies for base load optimization.
By Technology
Why Solar Photovoltaic (PV) Dominates the Solar Energy Market?
The Solar Photovoltaic (PV) segment captures the largest market share in 2025 of over 95%. The accelerated growth of global solar power capacity is primarily responsible for this segment growth. The solar PV consists of the semiconductor elements that transfer sunlight directly to the generated power. This is one of the significant PV technologies, which are widely used in residences, commercial complexes, or big utility solar farms. It is a prime segment, which will experience longer-term growth due to tremendous growth in global solar capacity, from 20 GW in 1990 to 1.8 TW in 2024, citing the growth trend of global PV installation.
The revenue growth in the solar PV segment is mainly due to the plummeting of PV module prices, rising cell efficiency, and higher investment and spending levels by the organizations on renewable energy infrastructure. In addition, government policies and incentives to reduce carbon emission and rising electricity demand are favoring adoption of this technology in the utility, corporate, and residential segments by the consumers. Enhancements in PV technology such as bifacial modules, TOPCon and heterojunction (HJT) cells, smart solar energy monitoring systems, etc. are driving power generation efficiency and reliability of PV technology and feeding demand for this technology in the energy industry.
The Concentrated Solar Power (CSP) segment is growing rapidly over the projected period. The capability to generate large volumes of power with integrated thermal energy storage is one of the key drivers for segment growth. CSP technologies use mirrors or lenses to focus sunlight onto a receiver, which then turns the sunlight into heat energy. Subsequently, the heat generated is used to produce steam, which generates electricity through turbines.
CSP technologies offer the advantage of harnessing solar energy through integrated thermal energy storage by using molten salt storage technology, for example, when sunlight is not available. Revenue growth is forecasted to be driven by new opportunities in utility-scale renewable projects emerging in ideal geographies. This growth is driven by the rising demand for reliable renewable energy, government mandates/incentives, and the high demand for long-duration energy storage. Therefore, advances in solar thermal systems and large-scale investments are set to accelerate CSP segment penetration within the solar energy market.
By End User
Does the Utility-Scale Dominates the Solar Energy Market?
The utility-scale segment captures the largest market share in 2025 of over 50%. The increase in revenue is mainly attributable to utility-scale solar power plants. Utility-scale solar power plants are large-scale photovoltaic power stations built by utility companies, governments, and independent power producers for the primary purpose of providing grid-connected electricity. As the world transitions toward increased renewable power generation to meet growing electricity demand and emission reduction goals, the expansion of utility-scale solar PV systems globally has resulted in considerable revenue growth. Utility-scale power plants can be cheaper to generate electricity in terms of per kilowatt-hour (kWh) from the viewpoint of economy of scale (maximum power output from large-scale electricity stations) and are enabling utility companies to satisfy rising power demand at a lower generation cost compared with traditional fossil-fuel power plants.
Additionally, solar power purchase agreements between solar developers and utility companies are long-term to ensure a stable cash flow; thus, they amortize the capital investment and incentivize large-scale solar infrastructure investments. Improving efficiency, such as the use of high-efficiency solar panels, bifacial modules, and single- or dual-axis solar tracking systems, is reducing costs and improving efficiencies in utility-scale solar segment power generation, which in turn would drive revenue growth.
The residential segment is growing at a highest CAGR over the projected period. Growing product launch by the key market players are expected to drive the ling term growth of the market. For instance, in November 2025, global inverter provider and energy storage provider Sungrow announced a range of new products at the Renewable Energy India (REI) Expo 2025, including the PowerStack 255CS energy storage system (ESS) for C&I applications, the MG5/6RL hybrid inverter and the MGL060 battery for home use, and the S2500S-L microinverter for rooftop PV.
Report Scope
| Feature of the Report | Details |
| Market Size in 2026 | USD 359 billion |
| Projected Market Size in 2035 | USD 1418 billion |
| Market Size in 2025 | USD 308 billion |
| CAGR Growth Rate | 16.5% CAGR |
| Base Year | 2025 |
| Forecast Period | 2026-2035 |
| Key Segment | By Component, Technology, End User and Region |
| Report Coverage | Revenue Estimation and Forecast, Company Profile, Competitive Landscape, Growth Factors and Recent Trends |
| Regional Scope | North America, Europe, Asia Pacific, Middle East & Africa, and South & Central America |
| Buying Options | Request tailored purchasing options to fulfil your requirements for research. |
Regional Analysis
How Big is the Asia Pacific Solar Energy Market Size?
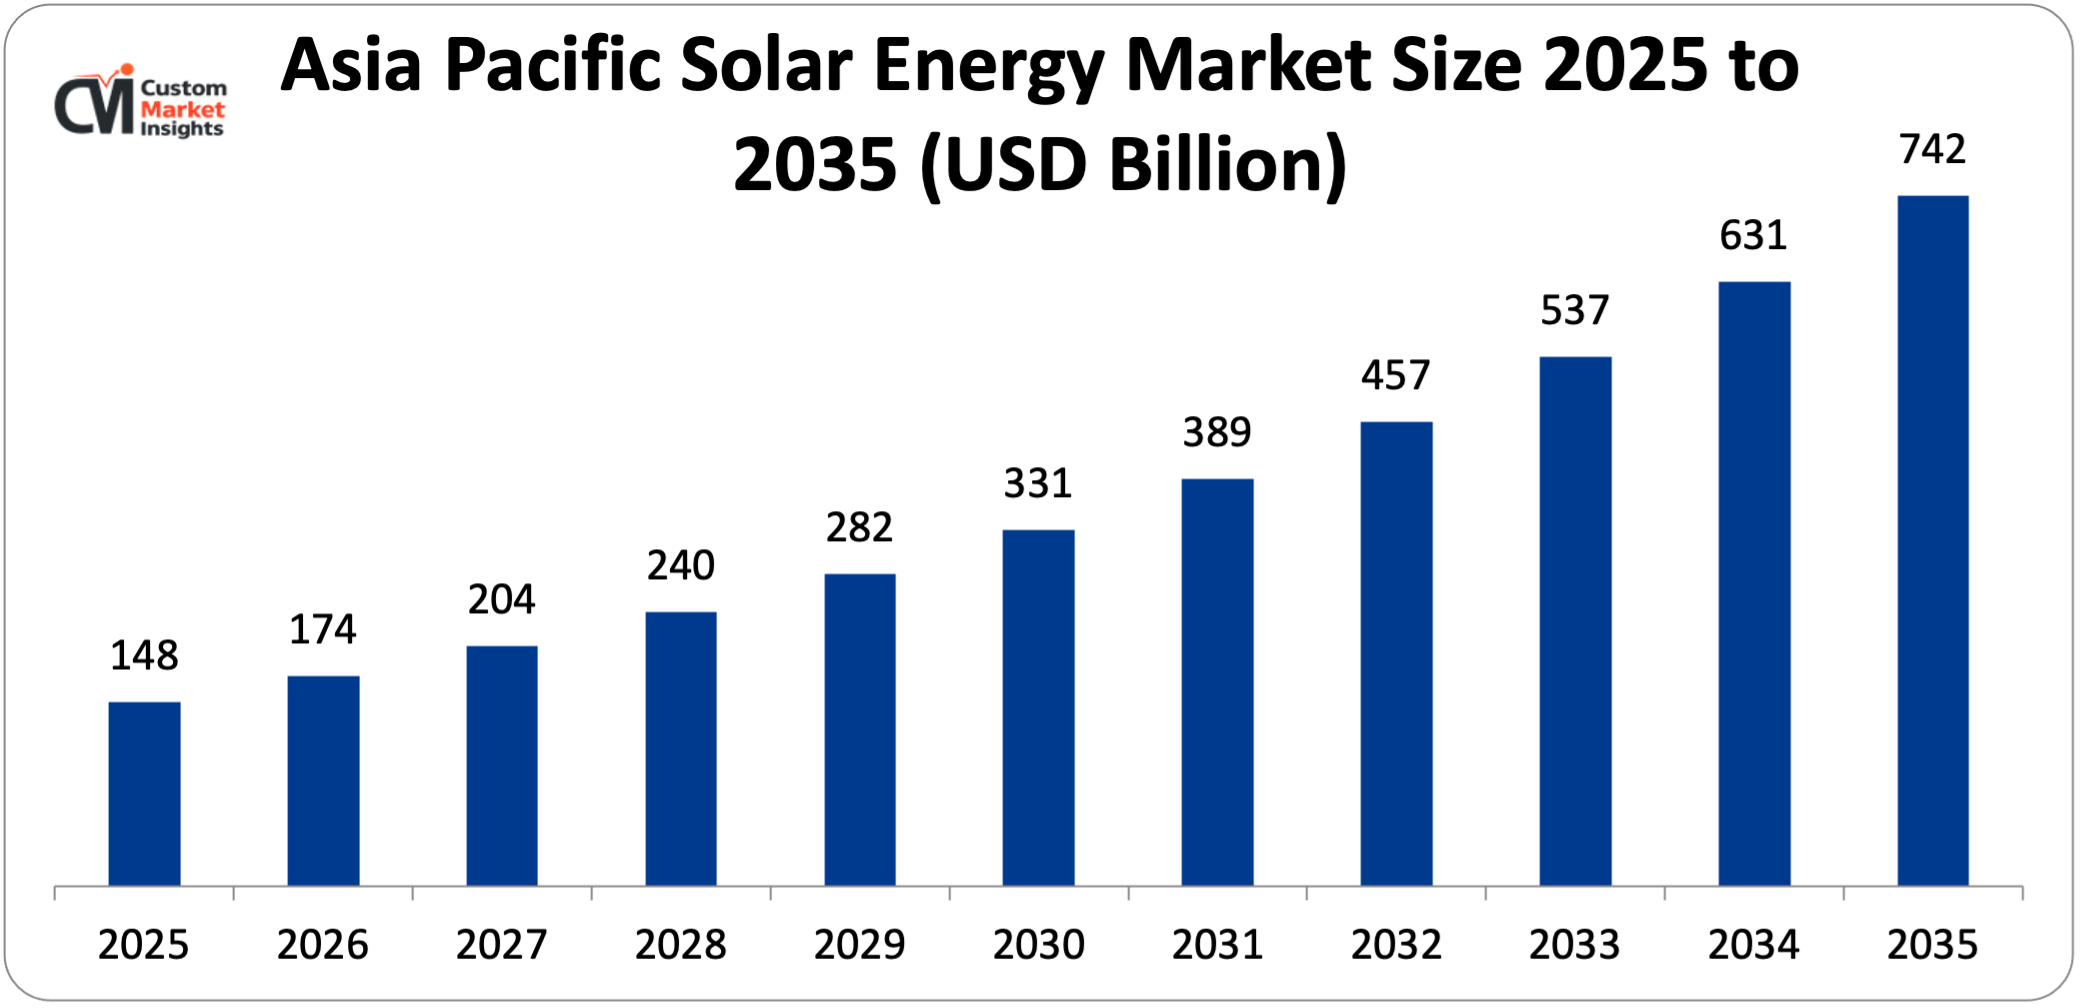
Its market size, in terms of the Asia Pacific solar energy, is projected to be USD 148 billion in 2025 with a growth of about USD 742 billion in 2035 with a CAGR of 17.5% between 2026 and 2035.
Why did the Asia Pacific Dominate the Solar Energy Market in 2025?
In 2025, the Asia Pacific will dominate the global market with an estimated market share of 48%. The rising company expansion is a major reason for the market development in the area. For instance, in May 2025, AlphaESS demonstrated its strength at the Solar & Storage Live Philippines 2025, the largest clean energy event in the Philippines, held at the SMX Convention Center in the capital city of Manila.
The company launched the world‘s first stackable commercial & industrial (C&I) energy storage system, the groundbreaking STORION-M50. This launch signified a major step forward for AlphaESS as it prepared to open its first office in the Philippines and continue expanding into the Asia-Pacific region. During the exhibition, AlphaESS revealed its latest C&I innovation—the STORION-M50 (50 kW | 108.54–217.08 kWh), a high-performance energy storage system designed specifically to power the increasing demand for scalable, flexible, and reliable commercial energy solutions in the region.
China Solar Energy Market Trends
In the Asia Pacific region, China leads the industry expansion over the projected period. Massive investments in renewable energy infrastructure, along with strong government support and China’s emerging as well as leading solar manufacturing capacity, are propelling this rise. Growth in revenues in China’s solar energy market is largely driven by the acceleration in growth of the solar PV capacity installed. In 2023, China added more than 216 GW of capacity, representing well over one-half of the world’s total solar capacity added that year. As a result, China now has over 600 GW of solar capacity installed, placing it at the top of the global solar league.
Why is Europe Experiencing a Significant Growth in the Solar Energy Market?
Europe holds a significant market share in 2025. Market development is mainly driven by active policies, such as feed-in tariffs, monetary incentives, and net-metering programs, which support the adoption of PV systems by consumers and traders, as well as the rise in electricity prices and higher concerns about energy safety due to the recent situation of natural gas supply shortages, which stimulated investments in solar electric infrastructures across the continent. Developments in the solar market are also supported by the rising number of small- and large-scale PV plants, for both rooftops and power plants, but also solar-plus-storage schemes are increasing. The incremental implementation of new, high-efficiency PV modules and the sustained decrease in installation costs are factors that tend to push the European solar market.
UK Solar Energy Market Trends
UK held the dominant position in the market in 2025. The market revenue growth of the UK solar energy industry is anticipated to be partly based on the fact that the UK government will play a leading role in the target of net-zero carbon emission by 2050. This is resulting in the grand-scale deployment of renewable energy projects. This covers policy schemes (Cfd schemes), renewable energy stimulators, and support for solar pv system installation on rooftops.
Why is North America Growing at a Rapid Rate in the Solar Energy Market?
North America is expected to grow at a highest CAGR over the projected period. The North American solar energy market is mainly supported by incentives such as solar tax credits and renewable energy programs at state and federal levels that target the increased use of solar energy systems. For instance, the Inflation Reduction Act initiatives in the United States led to reported increases in investments in solar manufacturing, project development, and energy storage. Conversely, the reduction in photovoltaic module prices, increasing solar panel efficiency, and growth in the utilization of utility-scale solar farms and rooftop solar energy systems have also contributed to market expansion. Growing electrical energy consumption by data centers, electric-vehicle (EV) charging infrastructures, and industries is boosting the solar energy market revenues’ growth across North America.
US Solar Energy Market Trends
The US led the North American market. The most of the growth is attributed to the upward trend in the investment in renewable energy, increased government policies to promote renewable energy, and the high demand for clean electricity. Solar power has emerged as one of the fastest-growing sources of electricity generation in the country with the growing adoption of renewable energy by utilities, firms, and households to reduce carbon emissions and energy prices.
Why is the Middle East & Africa Region is growing rapidly in the Solar Energy?
The MEA region is growing at a steady rate over the projected period. The regional market is growing owing the rising number of agreements. For instance, in November 2025, The Solar Energy Corporation of India (SECI) and the Ministry of External Affairs (MEA) signed an MOU to deploy rooftop solar photovoltaic systems on all the MEA occupied buildings across the country. The agreement was announced in the capital, New Delhi, and complements India’s commitment to expand renewable energy generation capacity as part of its plans to achieve cleaner power generation embodied in the PM Surya Ghar Yojana.
As per the terms of the MOU, the SECI would be the implementation agency, responsible for designing, installing, and connecting to the grid the rooftop solar PV power plants on the diplomatic and administrative properties owned by the government agencies. This is expected to significantly bring down electricity costs for MEA facilities while creating a larger share of renewable energy power in India.
UAE Solar Energy Market Trends
UAE is growing at the highest CAGR during the forecast period. The increasing bilateral agreement between nations drives the market growth in the area. For instance, in March 2026, The UAE and Germany have further deepened their energy ties by signing on a new strategic partnership to promote renewable energy investments and increase energy security. According to sources, the agreement was signed between the UAE and German authorities and was among the bilateral issues highlighted in the Friday meetings between authorities in Abu Dhabi and Berlin.
As per the agreement, investments in renewable energy projects are expected to rise. Discussions are also underway to develop synergies in multiple industry areas in the future, including solar energy and hydrogen technology. This strategic alliance between the UAE and Germany will build on each country’s existing energy policies, and the countries share the same views about moving towards a greener energy base. UAE’s Vision 2030 is in line with the Germans’ green move.
Top Players in the Solar Energy Market and Their Offerings
- Tata Power Solar Systems Ltd
- JinkoSolar Holding Co. Ltd
- Trina Solar Co. Ltd
- LONGi Green Energy Technology Co. Ltd
- BrightSource Energy Inc.
- JA Solar Technology Co. Ltd
- SunPower Corporation
- REC Solar Holdings AS
- Hanwha Q Cells Co. Ltd
- Risen Energy Co. Ltd
- Seraphim Solar System Co. Ltd
- Canadian Solar Inc.
- Sunrun Inc.
- Enphase Energy Inc.
- SMA Solar Technology AG
- Array Technologies Inc.
- Nextracker Inc.
- Siemens Energy (CSP)
- Abengoa SA
- First Solar Inc.
- Others
Key Developments
Solar energy market has experienced considerable changes in the last two years as the market players are trying to diversify their technological aspects and develop product portfolio using strategic approaches.
- In December 2025, ReNew Energy Global Plc (“ReNew”), a leading decarbonisation solutions company, announced that it has signed a long-term agreement with Google to enable the development of a new 150 megawatt (MW) solar project in Rajasthan. Under this partnership, Google will procure the project’s energy attributes from ReNew. This long-term procurement is essential for the bankability of the project, and will also help Google make progress towards addressing its value chain emissions. The 150 MW solar project, scheduled for commissioning in 2026, is expected to generate approximately 425,000 MWh of clean electricity annually, which is equivalent to powering over 360,000 Indian households. With this agreement, ReNew’s committed commercial and industrial portfolio expands to 2.7 gigawatts (GW), reinforcing its position as one of India’s leading providers of corporate clean energy and carbon reduction solutions. (https://investor.renew.com/news-releases/news-release-details/renew-announces-long-term-agreement-google-enable-150-mw-solar)
- In April 2025, in a joint effort, based on an existing partnership, SolarPower Europe and the National Solar Energy Federation of India (NSEFI) have signed a new Memorandum of Understanding (MoU) to unlock EU-India cooperation on solar manufacturing, and build more diversified and resilient value chains. India is one of the largest and most dynamic solar markets worldwide, with a strong presence of European companies in the country. While European solar manufacturers can offer significant support, including on-site assistance, high-yield performance, and reliable customer assistance, India excels at creating its own domestic manufacturing market. Accordingly, SolarPower Europe and NSEFI have signed an MoU, committing to work together to strengthen EU-India cooperation to diversify solar supply chains. The work will include identifying business and financing opportunities for manufacturing projects, and fostering knowledge exchange and capacity building between the regions. On frameworks, the Associations will support each other in addressing regulatory issues concerning the market access of solar equipment, and facilitate exchanges with relevant policymakers about opportunities to support EU-India solar manufacturing cooperation projects. The MoU reflects the commitments of the India-EU Clean Energy and Climate Partnership (CECP), as well as the recent pledge by President Modi and European Commission President Ursula von der Leyen to deepen the India-EU collaboration on clean energy and supply chains. (https://www.solarpowereurope.org/press-releases/solar-power-europe-and-national-solar-energy-federation-of-india-join-forces-to-support-diversification-of-global-solar-value-chains-1)
These strategic measures have enabled the companies to reinforce their competitive positions, increase the product line, boost their technological competencies and also seize growth opportunities in the fast-growing solar energy market.
The Solar Energy Market is segmented as follows:
By Component
- Solar Modules/Panels
- Inverters (String, Central, Micro)
- Mounting and Tracking Systems
- Balance-of-System and Electricals
- Energy Storage and Hybrid Integration
By Technology
- Solar Photovoltaic (PV)
- Concentrated Solar Power (CSP)
By End User
- Utility-Scale
- Commercial and Industrial (C&I)
- Residential
Regional Coverage:
North America
- U.S.
- Canada
- Mexico
- Rest of North America
Europe
- Germany
- France
- U.K.
- Russia
- Italy
- Spain
- Netherlands
- Rest of Europe
Asia Pacific
- China
- Japan
- India
- New Zealand
- Australia
- South Korea
- Taiwan
- Rest of Asia Pacific
The Middle East & Africa
- Saudi Arabia
- UAE
- Egypt
- Kuwait
- South Africa
- Rest of the Middle East & Africa
Latin America
- Brazil
- Argentina
- Rest of Latin America
Table of Contents
- Chapter 1. Report Introduction
- 1.1. Report Description
- 1.1.1. Purpose of the Report
- 1.1.2. USP & Key Offerings
- 1.2. Key Benefits For Stakeholders
- 1.3. Target Audience
- 1.4. Report Scope
- 1.1. Report Description
- Chapter 2. Market Overview
- 2.1. Report Scope (Segments And Key Players)
- 2.1.1. Solar Energy by Segments
- 2.1.2. Solar Energy by Region
- 2.2. Executive Summary
- 2.2.1. Market Size & Forecast
- 2.2.2. Solar Energy Market Attractiveness Analysis, By Component
- 2.2.3. Solar Energy Market Attractiveness Analysis, By Technology
- 2.2.4. Solar Energy Market Attractiveness Analysis, By End User
- 2.1. Report Scope (Segments And Key Players)
- Chapter 3. Market Dynamics (DRO)
- 3.1. Market Drivers
- 3.1.1. Rising Demand for Clean and Renewable Energy
- 3.1.2. Government Incentives and Policy Support
- 3.2. Market Restraints
- 3.3. Market Opportunities
- 3.5. Pestle Analysis
- 3.6. Porter Forces Analysis
- 3.7. Technology Roadmap
- 3.8. Value Chain Analysis
- 3.9. Government Policy Impact Analysis
- 3.10. Pricing Analysis
- 3.1. Market Drivers
- Chapter 4. Solar Energy Market – By Component
- 4.1. Component Market Overview, By Component Segment
- 4.1.1. Solar Energy Market Revenue Share, By Component, 2025 & 2035
- 4.1.2. Solar Modules/Panels
- 4.1.3. Solar Energy Share Forecast, By Region (USD Billion)
- 4.1.4. Comparative Revenue Analysis, By Country, 2025 & 2035
- 4.1.5. Key Market Trends, Growth Factors, & Opportunities
- 4.1.6. Inverters (String, Central, Micro)
- 4.1.7. Solar Energy Share Forecast, By Region (USD Billion)
- 4.1.8. Comparative Revenue Analysis, By Country, 2025 & 2035
- 4.1.9. Key Market Trends, Growth Factors, & Opportunities
- 4.1.10. Mounting and Tracking Systems
- 4.1.11. Solar Energy Share Forecast, By Region (USD Billion)
- 4.1.12. Comparative Revenue Analysis, By Country, 2025 & 2035
- 4.1.13. Key Market Trends, Growth Factors, & Opportunities
- 4.1.14. Balance-of-System and Electricals
- 4.1.15. Solar Energy Share Forecast, By Region (USD Billion)
- 4.1.16. Comparative Revenue Analysis, By Country, 2025 & 2035
- 4.1.17. Key Market Trends, Growth Factors, & Opportunities
- 4.1.18. Energy Storage and Hybrid Integration
- 4.1.19. Solar Energy Share Forecast, By Region (USD Billion)
- 4.1.20. Comparative Revenue Analysis, By Country, 2025 & 2035
- 4.1.21. Key Market Trends, Growth Factors, & Opportunities
- 4.1. Component Market Overview, By Component Segment
- Chapter 5. Solar Energy Market – By Technology
- 5.1. Technology Market Overview, By Technology Segment
- 5.1.1. Solar Energy Market Revenue Share, By Technology, 2025 & 2035
- 5.1.2. Solar Photovoltaic (PV)
- 5.1.3. Solar Energy Share Forecast, By Region (USD Billion)
- 5.1.4. Comparative Revenue Analysis, By Country, 2025 & 2035
- 5.1.5. Key Market Trends, Growth Factors, & Opportunities
- 5.1.6. Concentrated Solar Power (CSP)
- 5.1.7. Solar Energy Share Forecast, By Region (USD Billion)
- 5.1.8. Comparative Revenue Analysis, By Country, 2025 & 2035
- 5.1.9. Key Market Trends, Growth Factors, & Opportunities
- 5.1. Technology Market Overview, By Technology Segment
- Chapter 6. Solar Energy Market – By End User
- 6.1. End User Market Overview, By End User Segment
- 6.1.1. Solar Energy Market Revenue Share, By End User, 2025 & 2035
- 6.1.2. Utility-Scale
- 6.1.3. Solar Energy Share Forecast, By Region (USD Billion)
- 6.1.4. Comparative Revenue Analysis, By Country, 2025 & 2035
- 6.1.5. Key Market Trends, Growth Factors, & Opportunities
- 6.1.6. Commercial and Industrial (C&I)
- 6.1.7. Solar Energy Share Forecast, By Region (USD Billion)
- 6.1.8. Comparative Revenue Analysis, By Country, 2025 & 2035
- 6.1.9. Key Market Trends, Growth Factors, & Opportunities
- 6.1.10. Residential
- 6.1.11. Solar Energy Share Forecast, By Region (USD Billion)
- 6.1.12. Comparative Revenue Analysis, By Country, 2025 & 2035
- 6.1.13. Key Market Trends, Growth Factors, & Opportunities
- 6.1. End User Market Overview, By End User Segment
- Chapter 7. Solar Energy Market – Regional Analysis
- 7.1. Solar Energy Market Overview, By Region Segment
- 7.1.1. Global Solar Energy Market Revenue Share, By Region, 2025 & 2035
- 7.1.2. Global Solar Energy Market Revenue, By Region, 2026 – 2035 (USD Billion)
- 7.1.3. Global Solar Energy Market Revenue, By Component, 2026 – 2035
- 7.1.4. Global Solar Energy Market Revenue, By Technology, 2026 – 2035
- 7.1.5. Global Solar Energy Market Revenue, By End User, 2026 – 2035
- 7.2. North America
- 7.2.1. North America Solar Energy Market Revenue, By Country, 2026 – 2035 (USD Billion)
- 7.2.2. North America Solar Energy Market Revenue, By Component, 2026 – 2035
- 7.2.3. North America Solar Energy Market Revenue, By Technology, 2026 – 2035
- 7.2.4. North America Solar Energy Market Revenue, By End User, 2026 – 2035
- 7.2.5. U.S. Solar Energy Market Revenue, 2026 – 2035 (USD Billion)
- 7.2.6. Canada Solar Energy Market Revenue, 2026 – 2035 (USD Billion)
- 7.2.7. Mexico Solar Energy Market Revenue, 2026 – 2035 (USD Billion)
- 7.2.8. Rest of North America Solar Energy Market Revenue, 2026 – 2035 (USD Billion)
- 7.3. Europe
- 7.3.1. Europe Solar Energy Market Revenue, By Country, 2026 – 2035 (USD Billion)
- 7.3.2. Europe Solar Energy Market Revenue, By Component, 2026 – 2035
- 7.3.3. Europe Solar Energy Market Revenue, By Technology, 2026 – 2035
- 7.3.4. Europe Solar Energy Market Revenue, By End User, 2026 – 2035
- 7.3.5. Germany Solar Energy Market Revenue, 2026 – 2035 (USD Billion)
- 7.3.6. France Solar Energy Market Revenue, 2026 – 2035 (USD Billion)
- 7.3.7. U.K. Solar Energy Market Revenue, 2026 – 2035 (USD Billion)
- 7.3.8. Russia Solar Energy Market Revenue, 2026 – 2035 (USD Billion)
- 7.3.9. Italy Solar Energy Market Revenue, 2026 – 2035 (USD Billion)
- 7.3.10. Spain Solar Energy Market Revenue, 2026 – 2035 (USD Billion)
- 7.3.11. Netherlands Solar Energy Market Revenue, 2026 – 2035 (USD Billion)
- 7.3.12. Rest of Europe Solar Energy Market Revenue, 2026 – 2035 (USD Billion)
- 7.4. Asia Pacific
- 7.4.1. Asia Pacific Solar Energy Market Revenue, By Country, 2026 – 2035 (USD Billion)
- 7.4.2. Asia Pacific Solar Energy Market Revenue, By Component, 2026 – 2035
- 7.4.3. Asia Pacific Solar Energy Market Revenue, By Technology, 2026 – 2035
- 7.4.4. Asia Pacific Solar Energy Market Revenue, By End User, 2026 – 2035
- 7.4.5. China Solar Energy Market Revenue, 2026 – 2035 (USD Billion)
- 7.4.6. Japan Solar Energy Market Revenue, 2026 – 2035 (USD Billion)
- 7.4.7. India Solar Energy Market Revenue, 2026 – 2035 (USD Billion)
- 7.4.8. New Zealand Solar Energy Market Revenue, 2026 – 2035 (USD Billion)
- 7.4.9. Australia Solar Energy Market Revenue, 2026 – 2035 (USD Billion)
- 7.4.10. South Korea Solar Energy Market Revenue, 2026 – 2035 (USD Billion)
- 7.4.11. Taiwan Solar Energy Market Revenue, 2026 – 2035 (USD Billion)
- 7.4.12. Rest of Asia Pacific Solar Energy Market Revenue, 2026 – 2035 (USD Billion)
- 7.5. The Middle-East and Africa
- 7.5.1. The Middle-East and Africa Solar Energy Market Revenue, By Country, 2026 – 2035 (USD Billion)
- 7.5.2. The Middle-East and Africa Solar Energy Market Revenue, By Component, 2026 – 2035
- 7.5.3. The Middle-East and Africa Solar Energy Market Revenue, By Technology, 2026 – 2035
- 7.5.4. The Middle-East and Africa Solar Energy Market Revenue, By End User, 2026 – 2035
- 7.5.5. Saudi Arabia Solar Energy Market Revenue, 2026 – 2035 (USD Billion)
- 7.5.6. UAE Solar Energy Market Revenue, 2026 – 2035 (USD Billion)
- 7.5.7. Egypt Solar Energy Market Revenue, 2026 – 2035 (USD Billion)
- 7.5.8. Kuwait Solar Energy Market Revenue, 2026 – 2035 (USD Billion)
- 7.5.9. South Africa Solar Energy Market Revenue, 2026 – 2035 (USD Billion)
- 7.5.10. Rest of the Middle East & Africa Solar Energy Market Revenue, 2026 – 2035 (USD Billion)
- 7.6. Latin America
- 7.6.1. Latin America Solar Energy Market Revenue, By Country, 2026 – 2035 (USD Billion)
- 7.6.2. Latin America Solar Energy Market Revenue, By Component, 2026 – 2035
- 7.6.3. Latin America Solar Energy Market Revenue, By Technology, 2026 – 2035
- 7.6.4. Latin America Solar Energy Market Revenue, By End User, 2026 – 2035
- 7.6.5. Brazil Solar Energy Market Revenue, 2026 – 2035 (USD Billion)
- 7.6.6. Argentina Solar Energy Market Revenue, 2026 – 2035 (USD Billion)
- 7.6.7. Rest of Latin America Solar Energy Market Revenue, 2026 – 2035 (USD Billion)
- 7.1. Solar Energy Market Overview, By Region Segment
- Chapter 8. Competitive Landscape
- 8.1. Company Market Share Analysis – 2025
- 8.1.1. Global Solar Energy Market: Company Market Share, 2025
- 8.2. Global Solar Energy Market Company Market Share, 2024
- 8.1. Company Market Share Analysis – 2025
- Chapter 9. Company Profiles
- 9.1. Tata Power Solar Systems Ltd
- 9.1.1. Company Overview
- 9.1.2. Key Executives
- 9.1.3. Product Portfolio
- 9.1.4. Financial Overview
- 9.1.5. Operating Business Segments
- 9.1.6. Business Performance
- 9.1.7. Recent Developments
- 9.2. JinkoSolar Holding Co. Ltd
- 9.3. Trina Solar Co. Ltd
- 9.4. LONGi Green Energy Technology Co. Ltd
- 9.5. BrightSource Energy Inc.
- 9.6. JA Solar Technology Co. Ltd
- 9.7. SunPower Corporation
- 9.8. REC Solar Holdings AS
- 9.9. Hanwha Q Cells Co. Ltd
- 9.10. Risen Energy Co. Ltd
- 9.11. Seraphim Solar System Co. Ltd
- 9.12. Canadian Solar Inc.
- 9.13. Sunrun Inc.
- 9.14. Enphase Energy Inc.
- 9.15. SMA Solar Technology AG
- 9.16. Array Technologies Inc.
- 9.17. Nextracker Inc.
- 9.18. Siemens Energy (CSP)
- 9.19. Abengoa SA
- 9.20. First Solar Inc.
- 9.21. Others.
- 9.1. Tata Power Solar Systems Ltd
- Chapter 10. Research Methodology
- 10.1. Research Methodology
- 10.2. Secondary Research
- 10.3. Primary Research
- 10.3.1. Analyst Tools and Models
- 10.4. Research Limitations
- 10.5. Assumptions
- 10.6. Insights From Primary Respondents
- 10.7. Why Healthcare Foresights
- Chapter 11. Standard Report Commercials & Add-Ons
- 11.1. Customization Options
- 11.2. Subscription Module For Market Research Reports
- 11.3. Client Testimonials
- Chapter 12. List Of Figures
- 12.1. Figures No 1 to 26
- Chapter 13. List Of Tables
- 13.1. Tables No 1 to 46
Prominent Player
- Tata Power Solar Systems Ltd
- JinkoSolar Holding Co. Ltd
- Trina Solar Co. Ltd
- LONGi Green Energy Technology Co. Ltd
- BrightSource Energy Inc.
- JA Solar Technology Co. Ltd
- SunPower Corporation
- REC Solar Holdings AS
- Hanwha Q Cells Co. Ltd
- Risen Energy Co. Ltd
- Seraphim Solar System Co. Ltd
- Canadian Solar Inc.
- Sunrun Inc.
- Enphase Energy Inc.
- SMA Solar Technology AG
- Array Technologies Inc.
- Nextracker Inc.
- Siemens Energy (CSP)
- Abengoa SA
- First Solar Inc.
- Others
FAQs
The key players in the market are Tata Power Solar Systems Ltd, JinkoSolar Holding Co. Ltd, Trina Solar Co. Ltd, LONGi Green Energy Technology Co. Ltd, BrightSource Energy Inc., JA Solar Technology Co. Ltd, SunPower Corporation, REC Solar Holdings AS, Hanwha Q Cells Co. Ltd, Risen Energy Co. Ltd, Seraphim Solar System Co. Ltd, Canadian Solar Inc., Sunrun Inc., Enphase Energy Inc., SMA Solar Technology AG, Array Technologies Inc., Nextracker Inc., Siemens Energy (CSP), Abengoa SA, First Solar Inc., Others.
Government regulations significantly impact the growth of the solar energy market by creating policies and a regulatory framework for companies to deploy renewable energy. Policies like renewable energy targets, tax breaks and subsidies, feed-in tariffs, net metering, and other policies, including carbon reduction and renewable energy mandates, provide incentives and decrease the solar power installation costs and make it more affordable for consumers and industry. Besides, these legislations on the part of the government increase the contribution of utilities and industrial sectors in solar energy projects and hence lead to the rollout of solar Power capacity in the long run.
The cost of solar energy is a very important factor affecting the growth and penetration of the solar energy market. The cost of solar panels, mounting and installation, and other associated components has decreased substantially, allowing the consumption of solar electricity on the residential, commercial, and utility scales to become commercially affordable. With the manufacturers’ reduced prices for photovoltaic modules over the last ten years, the cost of solar electricity has been on par with that of fossil-fuel-based power. With the reduced initial cost of installations and government incentive schemes and financial incentives, there is an accelerated widespread adoption of solar systems by households and businesses, increasing the growth of the solar energy market.
According to the present analysis and forecast modeling, the market of solar energy will witness a significant growth of about USD 1418 billion in the year 2035 with the growing innovative product launch, increasing number of agreements, rising bilateral relation for energy among countries and increasing investment for renewable energy with a CAGR of 16.5% between the years 2026 and 2035.
It is projected that the Asia Pacific will hold the largest market share in the solar energy market in the forecast period, with a share of about 48% of the global market share, which is attributed to the region growing investment in solar energy and favorable government policies.
North America is expected to grow at a highest CAGR during the forecast period. The growth in the region is owing to the rising residential investment for solar energy.
Market drivers for solar energy are growing demand for clean and renewable power generation, incentives and policies from government, reducing cost of solar modules, advances in solar photovoltaic (PV) technology, and increased investments in conventional utility-scale and rooftop solar plants. Rising demand for power and penetration of energy storage systems also fuels the market for solar energy.