Submarine Cable Market Size, Trends and Insights By Offering (Installation & Commissioning, Maintenance, Upgrade), By Voltage (Medium Voltage, High Voltage, Extra High Voltage), By Application (Submarine Power Cables, Submarine Communication Cables), By End-use (Offshore Wind Power Generation, Inter-country & island connection, Offshore Oil & Gas), and By Region - Global Industry Overview, Statistical Data, Competitive Analysis, Share, Outlook, and Forecast 2026 – 2035
Report Snapshot
CAGR: 5.2%
| Study Period: | 2026-2035 |
| Fastest Growing Market: | Europe |
| Largest Market: | Asia Pacific |
Major Players
- Hexatronic Group
- Subcom LLC
- Hellenic Cables
- Nexans
- Others
Reports Description
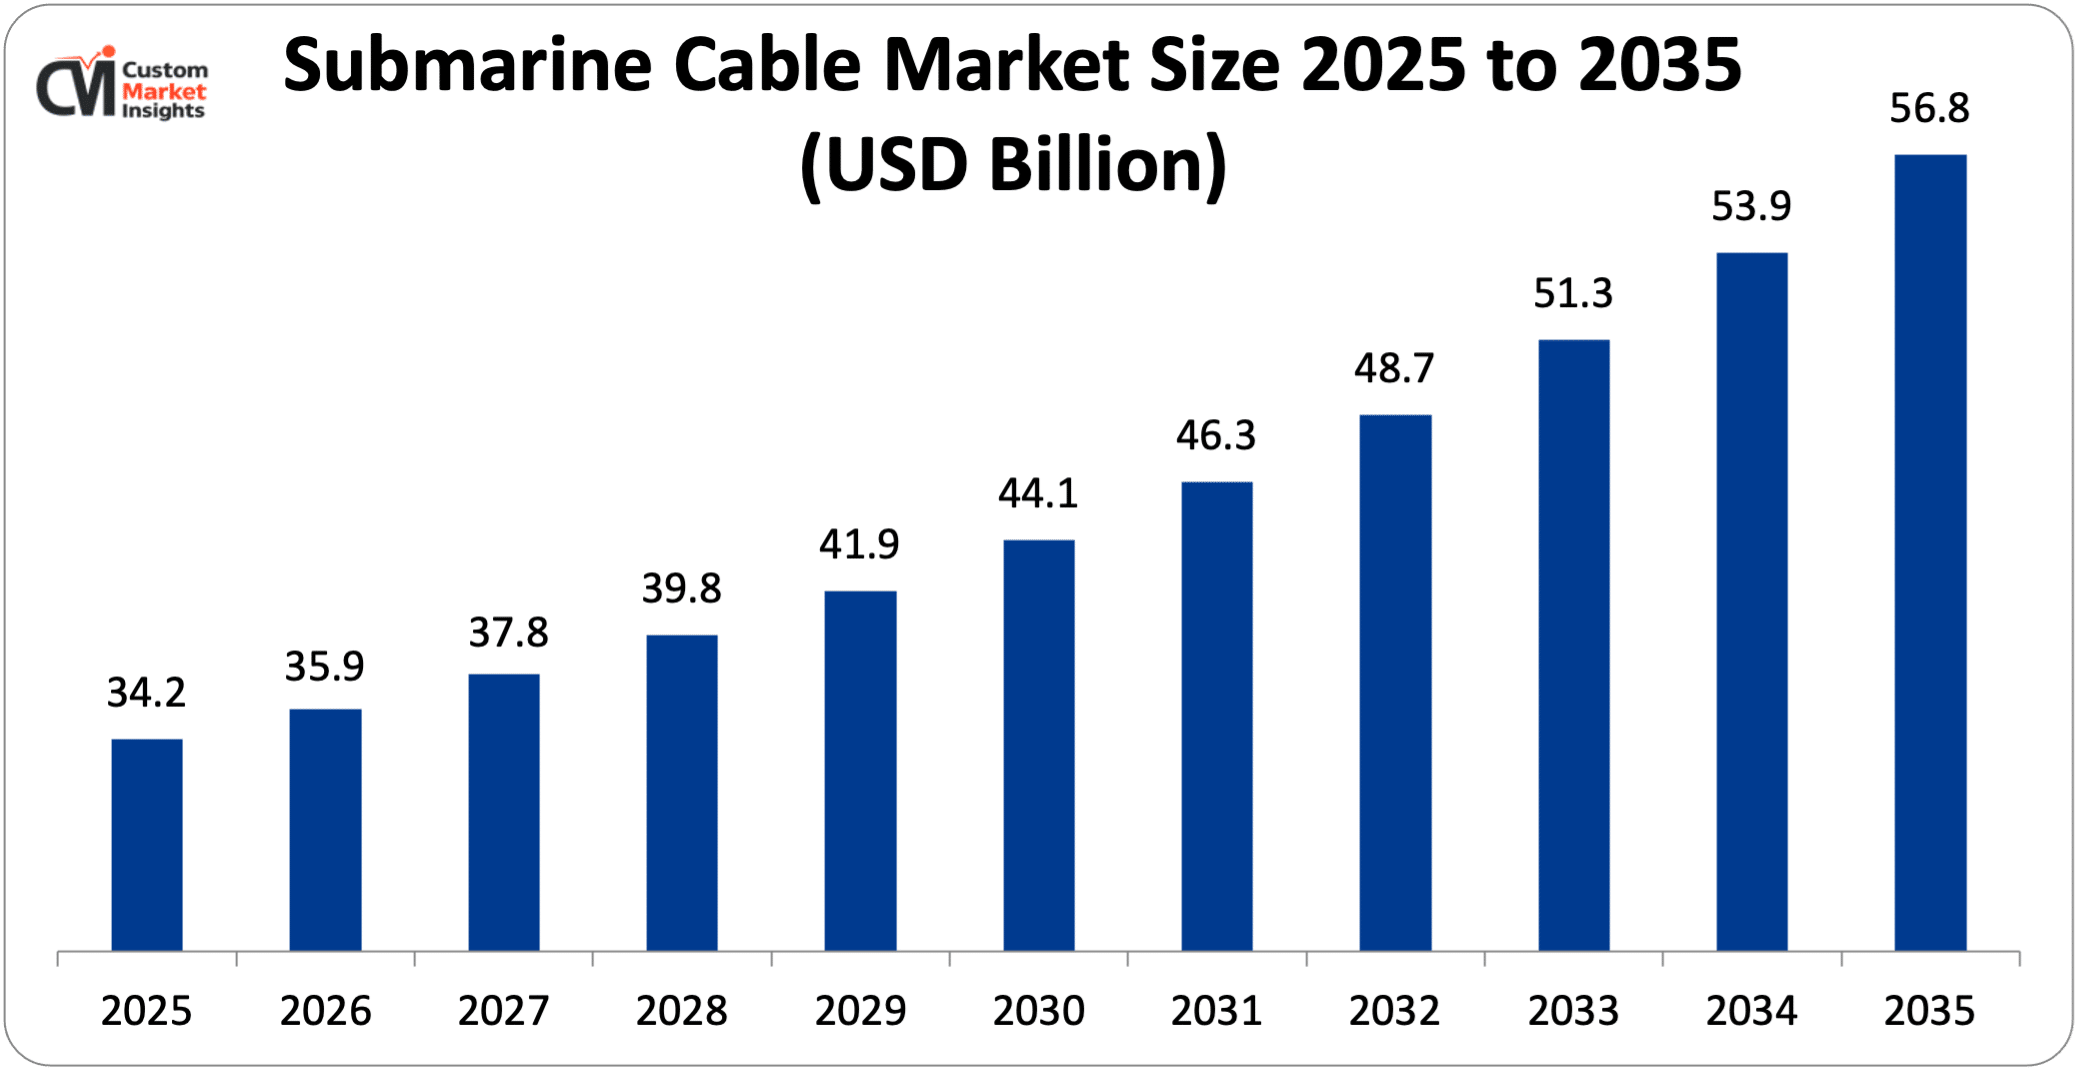
The market size of global submarine cable will be estimated at USD 34.2 billion in 2025 and is expected to grow to between USD 35.9 billion in 2026 and about USD 56.8 billion by 2035, with a current CAGR (compound annual growth rate) of 5.2% during the period of 2026 to 2035. The submarine cable functions as a specialized cable which operators deploy on ocean floors to enable data and electrical power transmission between multiple regions including countries islands and offshore facilities.
The engineers designed these cables with multiple protective layers so they can endure severe underwater conditions which include pressure and corrosion and physical damage. The two main types of submarine cables consist of telecommunication cables which carry internet and data traffic between continents and power cables which transmit electricity from offshore wind farms to national power grids. The systems operate as essential components which support worldwide network connections and power distribution systems while they provide fast communication links and effective power transfer between international borders.
Market Highlight
- In 2025, the Asia Pacific will dominate the global market with an estimated market share of 39%. Increasing demand for data traffic drives the regional expansion.
- North America is growing at a steady rate over the analysis period. The increasing focus on renewable energy drives the industry growth.
- By offering, the installation & commissioning segment accounted for the highest revenue share in 2025.
- By voltage, the high voltage segment would have the highest share of the market in 2025.
- By application, the submarine power cables segment would have the highest share of the market in 2025 of over 60%.
- By end-use, the offshore wind power generation segment would have the highest share of the market in 2025.
Significant Growth Factors
The submarine cable market trends present significant growth opportunities due to several factors:
- Rising Global Internet & Data Traffic: The submarine cable market is experiencing growth because people worldwide are using the internet more and creating higher data traffic. The demand for high-speed data transmission systems has grown because people now use digital activities such as video streaming and cloud computing and social media and artificial intelligence and IoT. Submarine telecommunication cables function as the primary backbone system for worldwide data transmission which enables uninterrupted international network connections. The deployment process occurs at an accelerated pace because hyperscale data centers expand and major technology companies increase their investment in private cable networks. The market for submarine cable infrastructure continues to expand because developed and emerging economies experience rapid data consumption growth.
- Investments by Tech Giants & Private Players: The submarine cable market receives massive growth parameters due to the major inputs by leading technology firms and private investors in the submarine cable sector. Global tech giants such as Google and Amazon and Meta now build their own submarine cable systems because they need to meet increasing demand for cloud services and data centers and high-speed internet connections. These companies need better control of their data transmission processes which will help them to achieve higher network reliability and reduce their latency times across different geographic locations. The private sector funds development activities which let organizations build advanced high-capacity cable systems at a faster pace than traditional consortium-based systems. The current surge in capital investment leads to better worldwide connectivity, which also enhances network redundancy and resilience, resulting in faster market expansion.
What are the Major Advances Changing the Submarine Cable Market Today?
- Ultra-high Capacity Fiber Technologies: Ultra-high capacity fiber technologies represent a major breakthrough in the submarine cable market which enables dramatic improvements to data transmission capabilities. Innovations such as multicore fiber (MCF) and space-division multiplexing (SDM) and advanced wavelength division multiplexing (WDM) enable multiple data channels to transmit through a single cable which results in higher bandwidth without any increase in cable dimensions. The technologies handle the rapid increase of worldwide data traffic that results from cloud computing and artificial intelligence and 5G networks and streaming services. Modern submarine cable systems create unmatched capacity and efficiency which leads to lower costs per bit while they achieve better performance and scalability. The current development supports upcoming digital infrastructure requirements while it transforms how international connectivity systems will be built and implemented.
- Expansion of Hyperscale & Private Cable Networks: The development of hyperscale and dedicated submarine cable systems by private companies constitutes an essential market development for submarine cable operations. The major technology firms including Google and Amazon and Meta have begun to construct their own subsea cable networks which they use to meet increasing needs from their cloud services and data centers and worldwide digital operations. Private networks enable organizations to manage their bandwidth resources and secure their data better while achieving faster data transmission speeds on their main communication paths than traditional consortium models allow. The current trend enables organizations to establish their essential infrastructure requirements through rapid construction of advanced technological systems. The increase of hyperscale data traffic leads to more private cable networks which improve worldwide connections and strengthen network reliability while driving exceptional growth in the submarine cable market.
Category Wise Insights
By Offering
Why Installation & Commissioning Hold a Prominent Position in the Market?
The installation & commissioning segment accounted for the highest revenue share in 2025. The expansion of the business occurs because more cable installation projects are being developed throughout the world. The demand for high-capacity data transmission together with offshore power connectivity has led to the construction of extensive submarine cable systems that connect international routes with offshore energy facilities. The expenses of establishing underwater cables increase because the process requires route surveys trenching activities and the use of special vessels which results in higher earnings from this segment.
The upgrade segment is growing at the highest CAGR during the forecast period. The market provides upgrade options that focus on improving existing cable systems through the implementation of new coherent optical transmission technology and advanced repeater systems. The upgrades enable older systems to operate for longer periods while achieving higher data transmission rates because they deliver cost-effective solutions that can be implemented more quickly than complete system replacements.
By Voltage
Why High Voltage Capture the Highest Market Share in the Submarine Cable Market?
The high voltage segment would have the highest share of the market in 2025. The growing need for HVDC submarine power cables and the rising investments into offshore wind power generation facilities drive market growth for high voltage cables. The HVDC power system now enables electricity transfer from high-capacity and high-power sources to the mainland through its advanced development.
The medium voltage segment is growing at a rapid rate over the projected period. The growth results from using medium voltage cables to transmit power through offshore oil and gas infrastructure. The medium voltage market has expanded because international oil and gas operations require more electricity. The expansion of offshore renewable energy projects, which include wind farms and tidal energy systems, serves as the primary force for industry growth.
By Application
Why Submarine Power Cables Capture the Highest Market Share in the Submarine Cable Market?
The submarine power cables segment would have the highest share of the market in 2025 of over 60%. The market expansion is driven by two factors which include greater demand for international and island transportation and new offshore wind capacity developments. The research and development activities have grown because of two factors which include the establishment of more offshore wind farms and the rising demand for electricity in offshore oil and gas operations.
The submarine communication cables segment is growing at a rapid rate over the projected period. The world is experiencing an urgent need for expanding urban spaces and developing economic activities, which will require both developing nations and developed nations to build more infrastructure and construction projects. The various industries including commercial operations and telecom services and energy production and power distribution, are driving infrastructure expansion and upgrades, which will create new market opportunities.
By End-use
Why Offshore Wind Power Generation Capture the Highest Market Share in the Submarine Cable Market?
The offshore wind power generation segment would have the highest share of the market in 2025. The market expands because of two main factors which include greater investment in offshore wind power generation and increased use of submarine power cables for long-distance power transmission from these facilities. The Global Wind Energy Council announced that worldwide offshore wind capacity reached 10.8 GW in June 2024 after the installation of new capacity during 2023 which brought the global total to 75.2 GW and showed a 24 percent increase from the previous year.
The inter-country & island connection segment is growing at a rapid rate over the projected period. International linkages together with island connections create market demand because countries need to build improved communication systems while they establish dependable power distribution networks. Submarine cables provide remote islands together with faraway countries their internet and electricity connections which support their economic development and digital equality goals.
Report Scope
| Feature of the Report | Details |
| Market Size in 2026 | USD 35.9 billion |
| Projected Market Size in 2035 | USD 56.8 billion |
| Market Size in 2025 | USD 34.2 billion |
| CAGR Growth Rate | 5.2% CAGR |
| Base Year | 2025 |
| Forecast Period | 2026-2035 |
| Key Segment | By Offering, Voltage, Application, End-use and Region |
| Report Coverage | Revenue Estimation and Forecast, Company Profile, Competitive Landscape, Growth Factors and Recent Trends |
| Regional Scope | North America, Europe, Asia Pacific, Middle East & Africa, and South & Central America |
| Buying Options | Request tailored purchasing options to fulfil your requirements for research. |
Regional Analysis
How Big is the Asia Pacific Submarine Cable Market Size?
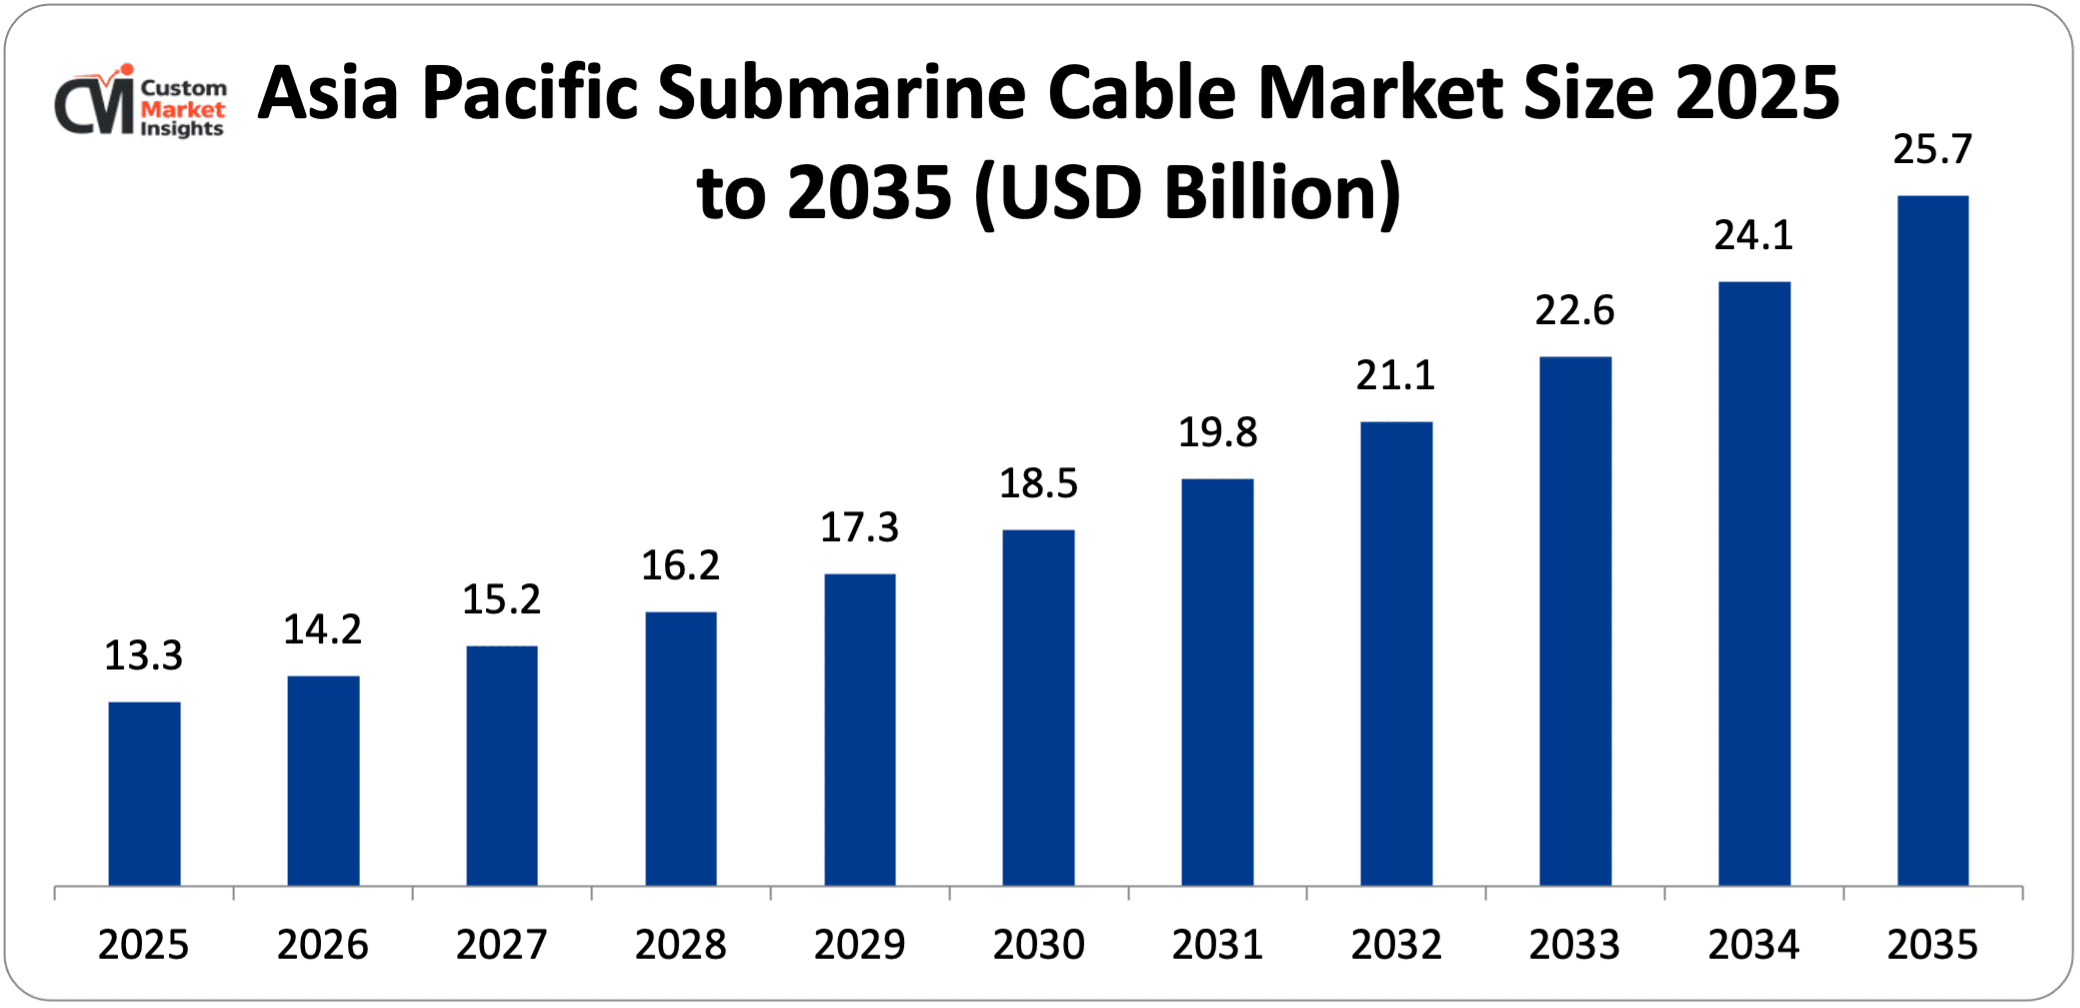
Its market size, in terms of the Asia Pacific submarine cable, is projected to be USD 13.3 billion in 2025 with a growth of about USD 25.7 billion in 2035 with a CAGR of 6.8% between 2026 and 2035.
Why did the Asia Pacific Dominate the Submarine Cable Market in 2025?
In 2025, the Asia Pacific will dominate the global market with an estimated market share of 39%. The submarine cable market in the Asia Pacific experiences growth because people demand more internet access, which European and American countries and Asian countries and African countries experience because they are modernizing their digital networks and adopting mobile technology and cloud services. The infrastructure expansion for data-intensive applications receives funding from hyperscalers who include Google and Meta and AWS. The region serves as a global data transit hub that connects the U.S. and Europe and Africa thus making it an essential location. Government initiatives to develop digital connectivity together with public-private partnerships create additional support for new cable projects.
China Submarine Cable Market Trends
In the Asia Pacific region, China is growing at a significant rate over the projected period. The submarine cables market in China experiences growth because of three factors which include the rapid digital economy development and the rising need for high-capacity international data transmission and the ongoing implementation of 5G networks and cloud computing and IoT systems. Government initiatives drive large investments in cross-border digital infrastructure to enhance global connectivity and reduce dependence on foreign networks. The market expansion happens because fiber-optic system technological advancements and strategic partnerships enable higher capacity and better reliability and lower operational costs.
Why is Europe Experiencing a Significant Growth in the Submarine Cable Market?
Europe holds a significant market share in 2025. The company’s expansion results from its commitment to digital independence through its strategic international data management approach, which decreases its dependence on non-EU data routes. Europe expands its transit network to Africa and the Middle East and Asia through Mediterranean Sea routes, which differ from North America, which concentrates on transpacific connections. The EU Global Gateway project provides financial support to build infrastructure that will improve worldwide digital connectivity. France, Spain, and Greece have developed into vital landing locations because of their stable political situation and their geographical location. Europe promotes environmentally friendly data transmission through its cable projects which work together with its renewable energy objectives.
UK Submarine Cable Market Trends
The UK held the dominant position in the market in 2025. The growth occurs because of two factors, which include the development of digital infrastructure and the funding of renewable energy projects. The UK has developed into a major center that connects transatlantic and European data networks because it needs high-capacity networks with minimal delay to support cloud computing and artificial intelligence and data center growth.
Why is North America Growing at a Steady Rate in the Submarine Cable Market?
North America is expected to grow at a steady rate over the projected period. The region is experiencing rapid growth in submarine cable expansion because of increasing demand for high-speed and low-latency data transmission which is driven by cloud services and streaming platforms and AI workloads. The U.S. now has strategic routes that link it to Latin America and Europe and the Asia-Pacific while providing improved capacity and redundancy. The combination of regulatory support and public-private partnerships is driving faster deployment of projects. The new cable landing stations which are built along U.S. coastal areas, create direct benefits for both digital infrastructure and economic development in the region.
US Submarine Cable Market Trends
The US holds the prominent market share in the industry. The region experiences growth because of increasing artificial intelligence development and cloud service expansion and worldwide internet usage growth. Major technology companies, which include Google and Meta and Amazon and Microsoft, are making substantial financial commitments to develop new undersea cable networks, which will improve global data transmission and decrease transmission delays. The essential cables function as vital infrastructure which enables data centers and content delivery networks and new digital services to operate. The United States has emerged as a central point for international data traffic which strengthens its position as an important player in the worldwide digital market.
Why is the Middle East & Africa Region is growing rapidly in the Submarine Cable?
The MEA region is growing at a steady rate over the projected period. The growth of the business is primarily driven by two factors. The region demonstrates two main trends, which include increasing internet access and fast-growing adoption of cloud computing services and rising usage of data-heavy applications. The region needs high-capacity submarine communication cables that connect Africa to the Middle East and Europe and Asia to support its growing demand for internet access and cloud services and data-intensive applications.
UAE Submarine Cable Market Trends
The UAE is growing at the highest CAGR during the forecast period. The United Arab Emirates needs reliable low-latency links for its digital transformation projects and its smart city initiatives and its 5G network deployment efforts. The increasing demand for submarine power cables exists because offshore energy projects and regional electricity interconnection projects have received more funding.
Top Players in the Submarine Cable Market and Their Offerings
- Hengtong Group Co. Ltd.
- Hexatronic Group
- Subcom LLC
- Hellenic Cables
- Nexans
- Alcatel Submarine Networks
- Ztt
- Nkt A/S
- Sumitomo Electric Industries Ltd.
- Ls Cable & System Ltd.
- Corning Incorporated
- Ningbo Orient Wires & Cables Co. Ltd.
- Taihan Cable & Solution Co. Ltd.
- Qingdao Hanhe Cable Co. Ltd.
- Furukawa Electric Co. Ltd.
- Prysmian S.P.
- Apar Industries Ltd.
- Tfkable
- Afl
- Nec Corporation
- Others
Key Developments
Submarine cable market has experienced considerable changes in the last two years as the market players are trying to diversify their technological aspects and develop product portfolios using strategic approaches.
- In November 2025, Google revealed Dhivaru, a subsea cable system spanning the Trans-Indian Ocean and linking the Maldives, Christmas Island, and Oman under the Australia Connect program. The initiative incorporates connectivity hubs in the Maldives and Christmas Island that offer cable switching to enable automatic traffic rerouting, content caching to minimize latency, and colocation facilities for regional carriers. (https://cloud.google.com/blog/products/networking/introducing-dhivaru-new-subsea-cable)
- In November 2025, China’s ZTT Group is set to invest an estimated $100m (712.11m yuan) to establish a submarine and terrestrial cable manufacturing facility at Saudi Arabia’s Ras Al-Khair Port. It has signed a land lease agreement with the Saudi Ports Authority (Mawani) to set up the 80,000m² facility. (https://www.investmentmonitor.ai/news/ztt-group-cable-saudi-arabia/)
These strategic measures have enabled the companies to reinforce their competitive positions, increase the product line, boost their technological competencies, and also seize growth opportunities in the fast-growing submarine cable market.
The Submarine Cable Market is segmented as follows:
By Offering
- Installation & Commissioning
- Maintenance
- Upgrade
By Voltage
- Medium Voltage
- High Voltage
- Extra High Voltage
By Application
- Submarine Power Cables
- Submarine Communication Cables
By End-use
- Offshore Wind Power Generation
- Inter-country & island connection
- Offshore Oil & Gas
Regional Coverage:
North America
- U.S.
- Canada
- Mexico
- Rest of North America
Europe
- Germany
- France
- U.K.
- Russia
- Italy
- Spain
- Netherlands
- Rest of Europe
Asia Pacific
- China
- Japan
- India
- New Zealand
- Australia
- South Korea
- Taiwan
- Rest of Asia Pacific
The Middle East & Africa
- Saudi Arabia
- UAE
- Egypt
- Kuwait
- South Africa
- Rest of the Middle East & Africa
Latin America
- Brazil
- Argentina
- Rest of Latin America
Table of Contents
- Chapter 1. Report Introduction
- 1.1. Report Description
- 1.1.1. Purpose of the Report
- 1.1.2. USP & Key Offerings
- 1.2. Key Benefits For Stakeholders
- 1.3. Target Audience
- 1.4. Report Scope
- 1.1. Report Description
- Chapter 2. Market Overview
- 2.1. Report Scope (Segments And Key Players)
- 2.1.1. Submarine Cable by Segments
- 2.1.2. Submarine Cable by Region
- 2.2. Executive Summary
- 2.2.1. Market Size & Forecast
- 2.2.2. Submarine Cable Market Attractiveness Analysis, By Offering
- 2.2.3. Submarine Cable Market Attractiveness Analysis, By Voltage
- 2.2.4. Submarine Cable Market Attractiveness Analysis, By Application
- 2.2.5. Submarine Cable Market Attractiveness Analysis, By End-use
- 2.1. Report Scope (Segments And Key Players)
- Chapter 3. Market Dynamics (DRO)
- 3.1. Market Drivers
- 3.1.1. Rising Global Internet & Data Traffic
- 3.1.2. Investments by Tech Giants & Private Players
- 3.2. Market Restraints
- 3.3. Market Opportunities
- 3.5. Pestle Analysis
- 3.6. Porter Forces Analysis
- 3.7. Technology Roadmap
- 3.8. Value Chain Analysis
- 3.9. Government Policy Impact Analysis
- 3.10. Pricing Analysis
- 3.1. Market Drivers
- Chapter 4. Submarine Cable Market – By Offering
- 4.1. Offering Market Overview, By Offering Segment
- 4.1.1. Submarine Cable Market Revenue Share, By Offering, 2025 & 2035
- 4.1.2. Installation & Commissioning
- 4.1.3. Submarine Cable Share Forecast, By Region (USD Billion)
- 4.1.4. Comparative Revenue Analysis, By Country, 2025 & 2035
- 4.1.5. Key Market Trends, Growth Factors, & Opportunities
- 4.1.6. Maintenance
- 4.1.7. Submarine Cable Share Forecast, By Region (USD Billion)
- 4.1.8. Comparative Revenue Analysis, By Country, 2025 & 2035
- 4.1.9. Key Market Trends, Growth Factors, & Opportunities
- 4.1.10. Upgrade
- 4.1.11. Submarine Cable Share Forecast, By Region (USD Billion)
- 4.1.12. Comparative Revenue Analysis, By Country, 2025 & 2035
- 4.1.13. Key Market Trends, Growth Factors, & Opportunities
- 4.1. Offering Market Overview, By Offering Segment
- Chapter 5. Submarine Cable Market – By Voltage
- 5.1. Voltage Market Overview, By Voltage Segment
- 5.1.1. Submarine Cable Market Revenue Share, By Voltage, 2025 & 2035
- 5.1.2. Medium Voltage
- 5.1.3. Submarine Cable Share Forecast, By Region (USD Billion)
- 5.1.4. Comparative Revenue Analysis, By Country, 2025 & 2035
- 5.1.5. Key Market Trends, Growth Factors, & Opportunities
- 5.1.6. High Voltage
- 5.1.7. Submarine Cable Share Forecast, By Region (USD Billion)
- 5.1.8. Comparative Revenue Analysis, By Country, 2025 & 2035
- 5.1.9. Key Market Trends, Growth Factors, & Opportunities
- 5.1.10. Extra High Voltage
- 5.1.11. Submarine Cable Share Forecast, By Region (USD Billion)
- 5.1.12. Comparative Revenue Analysis, By Country, 2025 & 2035
- 5.1.13. Key Market Trends, Growth Factors, & Opportunities
- 5.1. Voltage Market Overview, By Voltage Segment
- Chapter 6. Submarine Cable Market – By Application
- 6.1. Application Market Overview, By Application Segment
- 6.1.1. Submarine Cable Market Revenue Share, By Application, 2025 & 2035
- 6.1.2. Submarine Power Cables
- 6.1.3. Submarine Cable Share Forecast, By Region (USD Billion)
- 6.1.4. Comparative Revenue Analysis, By Country, 2025 & 2035
- 6.1.5. Key Market Trends, Growth Factors, & Opportunities
- 6.1.6. Submarine Communication Cables
- 6.1.7. Submarine Cable Share Forecast, By Region (USD Billion)
- 6.1.8. Comparative Revenue Analysis, By Country, 2025 & 2035
- 6.1.9. Key Market Trends, Growth Factors, & Opportunities
- 6.1. Application Market Overview, By Application Segment
- Chapter 7. Submarine Cable Market – By End-use
- 7.1. End-use Market Overview, By End-use Segment
- 7.1.1. Submarine Cable Market Revenue Share, By End-use, 2025 & 2035
- 7.1.2. Offshore Wind Power Generation
- 7.1.3. Submarine Cable Share Forecast, By Region (USD Billion)
- 7.1.4. Comparative Revenue Analysis, By Country, 2025 & 2035
- 7.1.5. Key Market Trends, Growth Factors, & Opportunities
- 7.1.6. Inter-country & island connection
- 7.1.7. Submarine Cable Share Forecast, By Region (USD Billion)
- 7.1.8. Comparative Revenue Analysis, By Country, 2025 & 2035
- 7.1.9. Key Market Trends, Growth Factors, & Opportunities
- 7.1.10. Offshore Oil & Gas
- 7.1.11. Submarine Cable Share Forecast, By Region (USD Billion)
- 7.1.12. Comparative Revenue Analysis, By Country, 2025 & 2035
- 7.1.13. Key Market Trends, Growth Factors, & Opportunities
- 7.1. End-use Market Overview, By End-use Segment
- Chapter 8. Submarine Cable Market – Regional Analysis
- 8.1. Submarine Cable Market Overview, By Region Segment
- 8.1.1. Global Submarine Cable Market Revenue Share, By Region, 2025 & 2035
- 8.1.2. Global Submarine Cable Market Revenue, By Region, 2026 – 2035 (USD Billion)
- 8.1.3. Global Submarine Cable Market Revenue, By Offering, 2026 – 2035
- 8.1.4. Global Submarine Cable Market Revenue, By Voltage, 2026 – 2035
- 8.1.5. Global Submarine Cable Market Revenue, By Application, 2026 – 2035
- 8.1.6. Global Submarine Cable Market Revenue, By End-use, 2026 – 2035
- 8.2. North America
- 8.2.1. North America Submarine Cable Market Revenue, By Country, 2026 – 2035 (USD Billion)
- 8.2.2. North America Submarine Cable Market Revenue, By Offering, 2026 – 2035
- 8.2.3. North America Submarine Cable Market Revenue, By Voltage, 2026 – 2035
- 8.2.4. North America Submarine Cable Market Revenue, By Application, 2026 – 2035
- 8.2.5. North America Submarine Cable Market Revenue, By End-use, 2026 – 2035
- 8.2.6. U.S. Submarine Cable Market Revenue, 2026 – 2035 (USD Billion)
- 8.2.7. Canada Submarine Cable Market Revenue, 2026 – 2035 (USD Billion)
- 8.2.8. Mexico Submarine Cable Market Revenue, 2026 – 2035 (USD Billion)
- 8.2.9. Rest of North America Submarine Cable Market Revenue, 2026 – 2035 (USD Billion)
- 8.3. Europe
- 8.3.1. Europe Submarine Cable Market Revenue, By Country, 2026 – 2035 (USD Billion)
- 8.3.2. Europe Submarine Cable Market Revenue, By Offering, 2026 – 2035
- 8.3.3. Europe Submarine Cable Market Revenue, By Voltage, 2026 – 2035
- 8.3.4. Europe Submarine Cable Market Revenue, By Application, 2026 – 2035
- 8.3.5. Europe Submarine Cable Market Revenue, By End-use, 2026 – 2035
- 8.3.6. Germany Submarine Cable Market Revenue, 2026 – 2035 (USD Billion)
- 8.3.7. France Submarine Cable Market Revenue, 2026 – 2035 (USD Billion)
- 8.3.8. U.K. Submarine Cable Market Revenue, 2026 – 2035 (USD Billion)
- 8.3.9. Russia Submarine Cable Market Revenue, 2026 – 2035 (USD Billion)
- 8.3.10. Italy Submarine Cable Market Revenue, 2026 – 2035 (USD Billion)
- 8.3.11. Spain Submarine Cable Market Revenue, 2026 – 2035 (USD Billion)
- 8.3.12. Netherlands Submarine Cable Market Revenue, 2026 – 2035 (USD Billion)
- 8.3.13. Rest of Europe Submarine Cable Market Revenue, 2026 – 2035 (USD Billion)
- 8.4. Asia Pacific
- 8.4.1. Asia Pacific Submarine Cable Market Revenue, By Country, 2026 – 2035 (USD Billion)
- 8.4.2. Asia Pacific Submarine Cable Market Revenue, By Offering, 2026 – 2035
- 8.4.3. Asia Pacific Submarine Cable Market Revenue, By Voltage, 2026 – 2035
- 8.4.4. Asia Pacific Submarine Cable Market Revenue, By Application, 2026 – 2035
- 8.4.5. Asia Pacific Submarine Cable Market Revenue, By End-use, 2026 – 2035
- 8.4.6. China Submarine Cable Market Revenue, 2026 – 2035 (USD Billion)
- 8.4.7. Japan Submarine Cable Market Revenue, 2026 – 2035 (USD Billion)
- 8.4.8. India Submarine Cable Market Revenue, 2026 – 2035 (USD Billion)
- 8.4.9. New Zealand Submarine Cable Market Revenue, 2026 – 2035 (USD Billion)
- 8.4.10. Australia Submarine Cable Market Revenue, 2026 – 2035 (USD Billion)
- 8.4.11. South Korea Submarine Cable Market Revenue, 2026 – 2035 (USD Billion)
- 8.4.12. Taiwan Submarine Cable Market Revenue, 2026 – 2035 (USD Billion)
- 8.4.13. Rest of Asia Pacific Submarine Cable Market Revenue, 2026 – 2035 (USD Billion)
- 8.5. The Middle-East and Africa
- 8.5.1. The Middle-East and Africa Submarine Cable Market Revenue, By Country, 2026 – 2035 (USD Billion)
- 8.5.2. The Middle-East and Africa Submarine Cable Market Revenue, By Offering, 2026 – 2035
- 8.5.3. The Middle-East and Africa Submarine Cable Market Revenue, By Voltage, 2026 – 2035
- 8.5.4. The Middle-East and Africa Submarine Cable Market Revenue, By Application, 2026 – 2035
- 8.5.5. The Middle-East and Africa Submarine Cable Market Revenue, By End-use, 2026 – 2035
- 8.5.6. Saudi Arabia Submarine Cable Market Revenue, 2026 – 2035 (USD Billion)
- 8.5.7. UAE Submarine Cable Market Revenue, 2026 – 2035 (USD Billion)
- 8.5.8. Egypt Submarine Cable Market Revenue, 2026 – 2035 (USD Billion)
- 8.5.9. Kuwait Submarine Cable Market Revenue, 2026 – 2035 (USD Billion)
- 8.5.10. South Africa Submarine Cable Market Revenue, 2026 – 2035 (USD Billion)
- 8.5.11. Rest of the Middle East & Africa Submarine Cable Market Revenue, 2026 – 2035 (USD Billion)
- 8.6. Latin America
- 8.6.1. Latin America Submarine Cable Market Revenue, By Country, 2026 – 2035 (USD Billion)
- 8.6.2. Latin America Submarine Cable Market Revenue, By Offering, 2026 – 2035
- 8.6.3. Latin America Submarine Cable Market Revenue, By Voltage, 2026 – 2035
- 8.6.4. Latin America Submarine Cable Market Revenue, By Application, 2026 – 2035
- 8.6.5. Latin America Submarine Cable Market Revenue, By End-use, 2026 – 2035
- 8.6.6. Brazil Submarine Cable Market Revenue, 2026 – 2035 (USD Billion)
- 8.6.7. Argentina Submarine Cable Market Revenue, 2026 – 2035 (USD Billion)
- 8.6.8. Rest of Latin America Submarine Cable Market Revenue, 2026 – 2035 (USD Billion)
- 8.1. Submarine Cable Market Overview, By Region Segment
- Chapter 9. Competitive Landscape
- 9.1. Company Market Share Analysis – 2025
- 9.1.1. Global Submarine Cable Market: Company Market Share, 2025
- 9.2. Global Submarine Cable Market Company Market Share, 2024
- 9.1. Company Market Share Analysis – 2025
- Chapter 10. Company Profiles
- 10.1. Hengtong Group Co. Ltd.
- 10.1.1. Company Overview
- 10.1.2. Key Executives
- 10.1.3. Product Portfolio
- 10.1.4. Financial Overview
- 10.1.5. Operating Business Segments
- 10.1.6. Business Performance
- 10.1.7. Recent Developments
- 10.2. Hexatronic Group
- 10.3. Subcom LLC
- 10.4. Hellenic Cables
- 10.5. Nexans
- 10.6. Alcatel Submarine Networks
- 10.7. Ztt
- 10.8. Nkt A/S
- 10.9. Sumitomo Electric Industries Ltd.
- 10.10. Ls Cable & System Ltd.
- 10.11. Corning Incorporated
- 10.12. Ningbo Orient Wires & Cables Co. Ltd.
- 10.13. Taihan Cable & Solution Co. Ltd.
- 10.14. Qingdao Hanhe Cable Co. Ltd.
- 10.15. Furukawa Electric Co. Ltd.
- 10.16. Prysmian S.P.
- 10.17. Apar Industries Ltd.
- 10.18. Tfkable
- 10.19. Afl
- 10.20. Nec Corporation
- 10.21. Others.
- 10.1. Hengtong Group Co. Ltd.
- Chapter 11. Research Methodology
- 11.1. Research Methodology
- 11.2. Secondary Research
- 11.3. Primary Research
- 11.3.1. Analyst Tools and Models
- 11.4. Research Limitations
- 11.5. Assumptions
- 11.6. Insights From Primary Respondents
- 11.7. Why Custom Market Insights
- Chapter 12. Standard Report Commercials & Add-Ons
- 12.1. Customization Options
- 12.2. Subscription Module For Market Research Reports
- 12.3. Client Testimonials
List Of Figures
Figures No 1 to 29
List Of Tables
Tables No 1 to 51
Prominent Players
- Hengtong Group Co. Ltd.
- Hexatronic Group
- Subcom LLC
- Hellenic Cables
- Nexans
- Alcatel Submarine Networks
- Ztt
- Nkt A/S
- Sumitomo Electric Industries Ltd.
- Ls Cable & System Ltd.
- Corning Incorporated
- Ningbo Orient Wires & Cables Co. Ltd.
- Taihan Cable & Solution Co. Ltd.
- Qingdao Hanhe Cable Co. Ltd.
- Furukawa Electric Co. Ltd.
- Prysmian S.P.
- Apar Industries Ltd.
- Tfkable
- Afl
- Nec Corporation
- Others
FAQs
The key players in the market are Hengtong Group Co. Ltd., AHexatronic Group, Subcom LLC, Hellenic Cables, Nexans, Alcatel Submarine Networks, Ztt, Nkt A/S, Sumitomo Electric Industries Ltd., Ls Cable & System Ltd., Corning Incorporated, Ningbo Orient Wires & Cables Co. Ltd., Taihan Cable & Solution Co. Ltd., Qingdao Hanhe Cable Co. Ltd., Furukawa Electric Co. Ltd., Prysmian S.P., Apar Industries Ltd., Tfkable, Afl, Nec Corporation, Others.
Government regulations play a crucial role by setting standards for environmental protection, permitting, and cross-border data and energy transmission, which can both facilitate market growth through supportive policies and delay projects due to complex approval processes.
Higher price points can slow adoption by increasing project costs, but they also drive revenue growth due to the capital-intensive nature of submarine cable deployment and advanced technology integration.
According to the present analysis and forecast modeling, the market of submarine cable will witness a significant growth of about USD 56.8 billion in the year 2035 with the growing innovative product launch, increasing collaboration, increasing data traffic across the globe with a CAGR of 5.2% between the years 2026 and 2035.
It is projected that the Asia Pacific will hold the largest market share in the submarine cable market in the forecast period, with a share of about 39% of the global market share, which is owing to the three factors which include rapid digitalization and expanding internet user bases and strong investments in data infrastructure. The countries of China India Japan and Singapore are experiencing significant growth in their cloud computing and e-commerce and data center development sectors which drives their need for high-capacity low-latency submarine communication cables.
Europe is expected to grow at a highest rate during the forecast period. The increasing number of renewable energy project drives the market growth.
The key factors driving the market are increasing data traffic, and investments by OTT providers to suffice the requirements.