Tunable Diode Laser Spectrometers Market Size, Trends and Insights By Product Type (Tunable Diode Laser Absorption Spectroscopy (TDLAS) Analyzers (Single-Pass, Multi-Pass), Cavity-Enhanced TDLAS (CRDS, OA-ICOS, CEAS), Wavelength Modulation Spectroscopy (WMS) Systems, Frequency Modulation Spectroscopy (FMS) Systems, Other Product Types (Photoacoustic Laser Spectroscopy, Dual-Comb Spectroscopy)), By Technology (Near-Infrared (NIR) TDLAS (780 nm–2,500 nm, Telecom-Grade DFB Lasers), Mid-Infrared (MIR) TDLAS (2.5 µm–20 µm, QCL, ICL), Other Technologies (Far-Infrared, Terahertz Laser Spectroscopy)), By Application (Gas Concentration Measurement (O₂, CO, CO₂, CH₄, H₂O, NH₃, HCl, HF, H₂S), Isotope Ratio Analysis (δ¹³C, δD, δ¹⁸O, ¹²C/¹³C), Process Gas Analysis (Reaction Monitoring, Feed Gas Purity, Product Gas Quality), Combustion Monitoring (Oxygen Trim, Excess Air Control, Flue Gas Analysis), Environmental & Atmospheric Monitoring (Trace Gas, Greenhouse Gas, Air Quality), Other Applications (Breath Analysis, Leak Detection, Food Quality)), By End-Use Industry (Oil & Gas (Upstream, Midstream, Downstream, LNG), Chemical & Petrochemical, Power Generation (Coal, Gas, Nuclear, Biomass), Environmental Monitoring (Regulatory, Research, Urban Air Quality), Pharmaceutical & Life Sciences, Semiconductor Manufacturing, Food & Beverage (Headspace Analysis, Modified Atmosphere Packaging), Other Industries (Metals & Mining, Cement, Glass, Pulp & Paper)), and By Region - Global Industry Overview, Statistical Data, Competitive Analysis, Share, Outlook, and Forecast 2026 – 2035
Report Snapshot
CAGR: 8.8%
| Study Period: | 2026-2035 |
| Fastest Growing Market: | Asia Pacific |
| Largest Market: | Europe |
Major Players
- Endress+Hauser Group
- Yokogawa Electric Corporation
- Picarro Inc.
- Los Gatos Research (PolyScience)
- Others
Reports Description
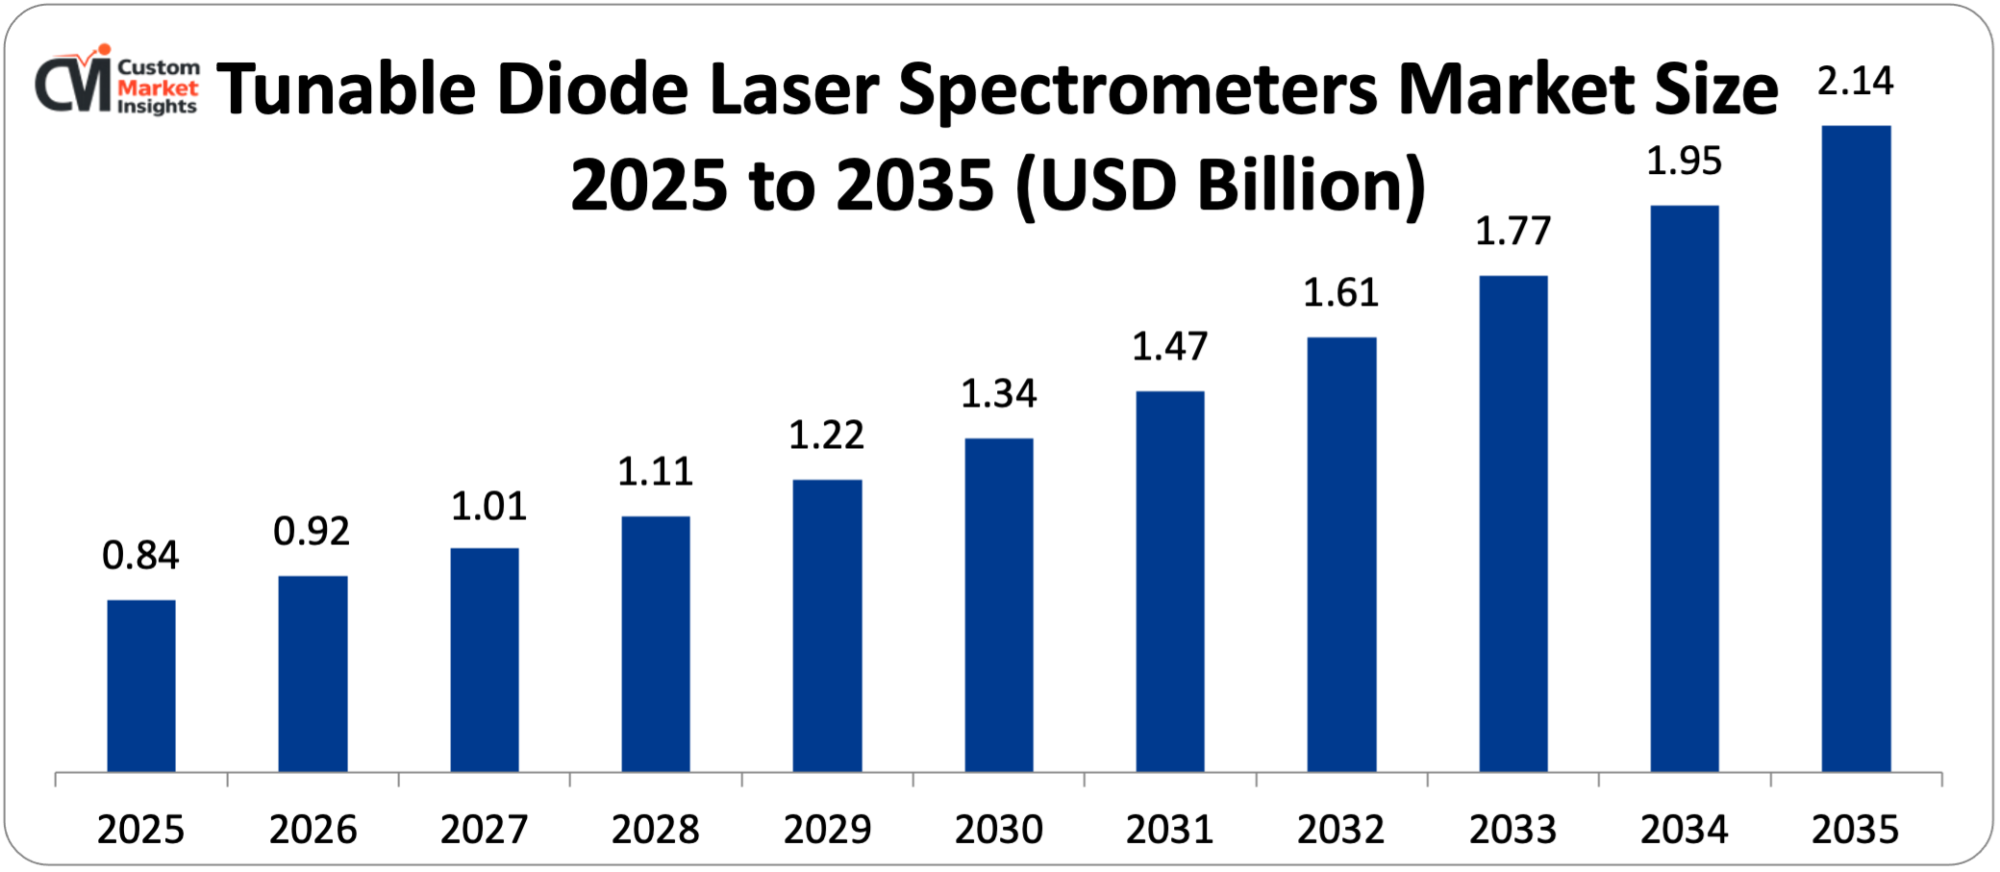
The global tunable diode laser spectrometer (TDLAS) market is expected to be worth USD 0.84 billion in 2025. After a slight increase to reach USD 0.92 billion in 2026, the market is projected to reach around USD 2.14 billion by 2035, growing at a CAGR rate of 8.8% over the forecast period 2026-2035.
The growth in the market is based on the swift deployment of TDLAS instruments in industrial process control applications, emission monitoring applications, and safety applications. These instruments provide parts per billion detection sensitivity, high levels of measurement selectivity for specific gas molecules, fast real-time responses for dynamic monitoring of a process, and non-contact in situ measurement that eliminates sample extraction delays and degradation artifacts that often accompany the extractive analytical techniques.
Additional drivers include tighter global emission standards that require continuous monitoring at power plants, cement plants, steel, and chemical plants, which require the ability to measure power plant emissions both inside and outside, the rising natural gas industry, which uses TDLAS for measuring methane leaks, detecting pipeline quality, and custody transfer measurement, the semiconductor industry, which requires TDLAs to measure process gas purity for etching processes; at sub-ppm levels, trace gas measurement can determine the product yield and quality, and finally, the continuous evolution of laser diode technology, such as quantum cascade lasers and interband cascade lasers, that allow enhanced sub ppm sensitivity in the mid infrared region, able to measure Together, these factors are contributing to strong market growth throughout the forecast period.
Market Highlight
- Asia Pacific is projected to grow the quickest, with a CAGR of 11.2%, during 2026-2035.
- By product type, the TDLAS segment accounted for around 54% of the market share in 2025.
- By type of product, the cavity-enhanced TDLAs segment is growing at the fastest CAGR of 12.6% during 2026-2035.
- The gas concentration measurement segment accounted for the maximum market share of 38% in the year 2025 and the combustion monitoring segment is projected to show the fastest CAGR of 10.8% in the years 2016-2035.
- By end-use industry, the oil & gas industry segment accounted for the largest market share of 29% in 2025; the semiconductor manufacturing industry segment is projected to grow at the fastest CAGR of 13.8% from 2026-2035.
Significant Growth Factors
The Tunable Diode Laser Spectrometers Market Trends present significant growth opportunities due to several factors:
- Industrial Emissions Regulation Tightening Driving Continuous Emissions Monitoring Deployment:
The progressive tightening of industrial air emissions regulations that are now in place, including the European Union’s Industrial Emissions Directive and its Best Available Techniques Reference Documents, which call for continuous monitoring of particulate matter, SO₂, NOx, HCl, HF, CO, and TOC at major industrial installations, the U.S. EPA’s Acid Rain Program and Clean Air Mercury Rule, which require continuous monitoring at power plants, and those of China, Japan, India, and other industrial nations, have created a steadily increasing installed base of continuous emissions monitoring systems worldwide. TDLAS instruments are the basis gas measurement technology for e.g. HCl, HF, CO, NH₃, and H₂O gases and offer excellent accuracy, selectivity, and low maintenance as compared with competing technologies.
The EU Industrial Emissions Directive applies to about 50,000 of the largest industrial installations in power generation, cement, iron and steel, chemical and waste incineration industries and requires automated monitoring systems to comply with the quality assurance standard EN 14181. TDLAS extractive and in situ cross stack analyzers certified according to TUV and MCRETS are the technology of choice for measuring HCl, HF, CO and moisture, due to their Beer – Lambert law measurement principle and molecular absorption selectivity. China’s implementation of its Ultra-Low Emissions standard for coal-fired power plants (SO₂ below 35 mg/Nm³, NOx below 50 mg/Nm³, and particulate below 10 mg/Nm³) has led to a massive installation of continuous monitoring systems on China’s 1000 GW of coal-fired power plants, TDLAS being the most demanding for emissions measurement (HCl at flue gas scrubber outlet and moisture to enable emissions based correction).
The India Central Pollution Control Board has implemented online monitoring requirements that require data on real-time emissions transmission from the major plants to expand the Asian regulatory compliance TDLAS market beyond China and Japan to India’s large and high-growth industrial sector. The proposed U.S. EPA methane emissions reporting and reduction rules for the oil and gas sector (extending continuous monitoring requirements to a much broader range of production, processing and transmission facilities) is a major expansion in the near term of regulatory-driven TDLAS deployment in the U.S. natural gas infrastructure monitoring market.
- Natural Gas Infrastructure Methane Monitoring and Leak Detection Imperatives:
Natural Gas Infrastructure, Methane Monitoring, and Leak Detection Imperatives. Increasing global need to identify and measure methane emissions across natural gas production, processing, transportation, and distribution facilities can be attributed to the fact that (with over a 20-year timeframe) the methane global-warming potential is approximately 80 to 1 greater than that of CO₂, the conclusion of the International Energy Agency that the oil and gas sector contributes about 40% of the worldwide methane emission levels, and policies in the U.S., EU, and other large economies imposing methane social and reporting mandates on operators. This has led to a fast-growing market for TDLAS based methane measurement systems such as pipeline leak detection, wellhead/compressor station based and continuous monitoring, custody transfer gas quality analysis, and large-scale aerial and ground based PM characterization. The Methane Emissions Reduction Program of the Inflation Reduction Act of the U.S. EPA provides financial benefits to monitoring and removal of methane emissions at the oil and gas facilities, whereas the OOOOa and OOOOb regulations (deliberately omitted in order to adhere to the clarity requirement) provide continuous monitoring at some types of the facility.
A new regulatory and financial incentive structure is spurring the purchase of methane TDLAs instruments in US oil and gas operations. In the newly established EU Methane Regulation (adopted in 2024), leak-detection and repair programs would be mandatory, methane would be carefully measured and reported, and the supply chain of fossil fuels would be successively limited in terms of emissions. These rules provide a similar need for methane monitoring technology across European and imported natural gas supplies – and this is pushing TDLAS deployment across European natural gas infrastructure. The natural gas custody transfer application is a new and growing TDLAS market. In this case, TDLAS instruments measure water vapor, CO₂, H₂S, and hydrocarbon dew point in natural gas streams at pipeline pressure.
The data set the quality of the gas and the caloric value for the commercial transactions. Since precise measurement is crucial for financial agreements, high-precision and reliable instruments are essential for this segment of measurement, resulting in high-quality and premium specifications as well as high-precision instruments. Industry comparison of methane leak detection technologies such as differential absorption lidar, drone-based optical gas imaging, and stationary TDLAS sensors revealed that TDLAS’s performance is the best for continuous monitoring. Example of TDLAS TDLAS is used to detect sub-ppm methane leaks in real-time at specific facility locations, providing as fast a response to leaks as possible.
What are the Major Advances Changing the Tunable Diode Laser Spectrometers Market Today?
- Quantum Cascade Laser Technology Enabling Mid-Infrared TDLAS with Superior Sensitivity: Quantum cascade lasers (QCLs) have achieved room temperature operation in the 3 – 20 μm mid-infrared region where many gas molecules exhibit strong fundamental absorption bands. QCLs offer a cross-section of absorption that is 100 to 1,000 times greater than in the overtone region near- infrared. This makes new mid-infrared TDLAS instruments much more sensitive for gases such as NO, NO₂, SO₂, CO, CO₂, N₂O, CH₄, NH₃, and formaldehyde, all of which are important to atmospheric chemistry, to the control of industrial processes, and to emission monitoring. Alpes Lasers, Daylight Solutions, and Hamamatsu offer top product lines of QCL. Their systems enable mid spectrum infrared TDLAS development in key manufacturers, including Aerodyne Research, Los Gatos Research, and Cascade Technologies. Interband cascade lasers (ICLs) have a range from 2.9 to 6 micrometers with lower operating power requirements compared to QCLs. ICLs enable handheld, battery-operated mid-infrared TDLAS systems that can be deployed in the field to monitor leakages of methane and hydrocarbons, where the QCLs used to be installed online. The commercial cost of QCLs and ICLs is decreasing. Increasing volume production in the area of spectroscopy and defense applications share the same laser manufacturing infrastructure. This is causing the prices of mid-infrared TDLAS instruments to shift out of the high-end category and into the affordable touch of a larger segment of industry users other than those that might be in the most challenging analytical markets.
- Cavity-Enhanced TDLAS Achieving Ultra-Trace Detection for Semiconductor and Research Applications:
The most recent cavity enhanced TDLAS designs have increased the effective optical path length from centimeters or meters to kilometers. These systems can be sensitive to gas (water vapor, oxygen, carbon monoxide, and thinly veiled hydrocarbons) in parts-per-trillion quantities by bouncing the laser beam thousands of times out of a high-reflectivity cavity. Applications include semiconductor process (gas) purity check applications, ultra-high purity gas quality assurance applications, atmospheric science research applications and Breath analysis diagnosis applications that require working beyond the sensitivity range of conventional TDLAs cells. Cavity ring- down spectroscopy (CRDS) is the most commercial cavity enhanced technique. It time steps the decay time of laser pulses in a high-finesse cavity to 1 km-100 km. CRDS is sensitive, at 1k-10n parts per trillion, the highest of specialty gas makes and semiconductor wafer-processing requirements. Optical frequency comb spectroscopy is a new technique in an emerging category of cavity enhancement.
A frequency comb laser provides thousands of narrow lines in its spectrum, which makes it possible to perform broadband absorption spectroscopy in a single shot. Research in TDLAS instruments, in companies like Thorlabs, Menlo Systems and APE GmbH, has developed the technology used in laboratory demonstrations to commercial instruments. These will allow the measurement of multiple species (simultaneously) in both near infrared and mid infrared with ultra trace precision. CRDS water-vapor analyzers of Picarro have a maximum detection of parts per billion in semiconductor gases and specialty gas detectors. Los Gatos Research offers Off Axial Integrated Cavity Output Spectroscopy instrumentation for sub-ppb detector concentrations for isotope ratios and atmospheric trace gas detection. Both product lines bring in high-value income in the high-value semiconductor and scientific research market.
- In Situ Cross-Stack TDLAS for Industrial Process and Emissions Monitoring:
In situ cross stack TDLAS instruments are growing commercially. The devices direct a laser beam over the entire width of industrial stacks, ducts or process pipes and the gas remains at its usual temperature and pressure. In situ TDLAS provides more representative and dependable real-time data, unlike extractive methods, which demand the use of heated sampling lines and conditioning, which makes this technique more efficient to monitor oxygen, CO, moisture, and corrosive gases. Industries that benefit from this are cement kilns, glass furnaces, power-plant flue gas, chemical-reactor off-gas, and incinerator flue gas. The benefits of in situ measurement compared to extractive TDLAS are very high for corrosive or reactive gases at high temperatures. Technically demanding and expensive sample conditioning in extractive systems are problematic. Therefore, in situ TDLAS is the technology of choice for determining HCl in waste incinerator flue gas. HF measurement in aluminum smelter emissions and NH₃ slip monitoring downstream of selective catalytic reduction NOx control systems is based on in- situ TDLAS.
The most popular business systems are the LDS 6 cross stack TDLAS offered by Endress+Hauser, the SITRANS 6 cross duplet analyzer developed by Siemens, Totalflow TDLAS developed by ABB and the LaserGas Laser series by NEO Monitors. There are thousands of locations worldwide where these instruments are installed. As the battery will require continuous service, calibration and replacement, this provides actionable revenues for them, aiding market growth beyond new installs. Fiber-optic TDLAs systems move the laser source and detector out of the zone of measurement. Optical fiber is used to transmit light in and out of the zone, making the system usable in hazardous zones where equipment must conform with the ATEX or IECEx explosion protection standards. This design also obviates the need for intrinsically safe electronics at the point of measurement which provides a measure of safety and practicality from the standpoint of installation.
Category Wise Insights
By Product Type
Why Does TDLAS Lead the Market?
Tunable diode laser absorption spectroscopy analyzers are available in single and multi pass configurations. They are the largest product segment with around 54% of market share by 2025. This speaks of the maturity of TDLAS, which is vastly deployed and is simple to comprehend in the process and emissions monitoring of industries. The working principle of standard TDLAS analyzers is through a scanning diode laser which finds application due to a gas absorption line using a distributed feedback diode laser. The intensity transmitted is measured and the Beer-Lambert law applied to calculate the concentration. These analyzers have been available for more than 30 years with gradual improvements in reliability, simplicity and maintenance. The industrial TDLAS market comprises cross stack analyzers for emissions, extractive process gas analyzer for chemical plants, oxygen analyzer for combustion optimization and moisture analyzer for natural gas pipelines. Such multifaceted uses maintain large reserves of conventional TDLAS goods. Multi-pass cells allow the laser beam to pass across the cell several times using White or Herriott mirror arrangements, which allow effective path lengths of between 10 and 200 meters in a small unit. This increases sensitivity to parts-per-billion thresholds, unnecessary in the research of greenhouse gases and tracing down to trace gases in applications compared to sophisticated cavity-enhanced systems.
By Technology
Why Does Near-Infrared TDLAS Lead the Market?
Near infrared TDLAS is the major technology in the market with a share of around 61% in 2025. The reason for its success is the mature, cost efficient, and widely available NIR distributed feedback diode lasers in particular for the telecom operating at 1,300-1,550 nm. These lasers offer low cost and high reliability as sources that make instruments available for gases including water vapor, oxygen, CO, CO₂, methane, and acetylene. The investment by the telecom industry into the manufacture of DFB lasers has created a strong supply chain, which has ensured that the price of the components lies between USD50 and USD500, something that would not be possible with custom spectroscopic lasers. NIR TDLAS instruments dominate the industrial gas analyzer market, like oxygen analyzer for combustion control, moisture analyzer for natural gasoline quality, and CO analyzers for safety monitoring. They strike an ideal balance with enough sensitivity, low cost, room-temperature performance and extensive availability and are therefore chosen in large industrial applications.
By Application
Why Does Gas Concentration Measurement Lead the Market?
Gas concentration measurement is the largest application segment comprising around 38 concerning the market share in 2025. It includes a large number of gases and applications: usage of oxygen in the combustion control of boilers and furnaces, use of moisture in natural gas plants and pipeline stations, CO in safety and process control, and Hcl/Hf in compliance with emissions in the incinerators. The broadness of the set of addressable species and the key safety and productivity frontier aspects necessitate the usage of TDLAS, rather than being optional. Combustion monitoring is the fastest growing segment, with a CAGR of 10.8% between 2026 and 2035. Growth comes with increased energy-efficiency targets in the world, growth in biomass and waste-to-energy combustion which demand tight monitoring, a transition to hydrogen, and new monitoring requirements of hydrogen which supplement traditional oxygen analyzers. TDLAS provides fuel independent accurate measurement.
By End-Use Industry
Why Does Oil & Gas Lead the Market?
The oil and gas industry is the largest end user, with approximately 29% share of the market in 2025. It is targeted to high value TDLAS applications that include custody transfer gas quality analysis, pipeline leak detection, refinery gas applications, LNG plant moisture and dew point measurement, and methane emissions monitoring. Companies of this industry have the financial power and regulatory pressure to spend on high-quality measurement technology. Their procurement requirements include that they be rigorously hazardous area certified, reliable in extreme temperatures and vibration, and have a long life with no recalibration. Major suppliers of industrial analyzers satisfy them with decades of product development. The semiconductor manufacturing segment is growing at the fastest pace with a CAGR of 13.8% during 2026-2035. This growth is due to the industry’s move into advanced node manufacturing, where ultra-clean process gases (sub-ppm and sub-ppb levels of moisture and oxygen in gases such as silane, ammonia, hydrogen chloride, and fluorine compounds of specialty) are critical to wafer yield and product reliability.
Report Scope
| Feature of the Report | Details |
| Market Size in 2026 | USD 0.92 billion |
| Projected Market Size in 2035 | USD 2.14 billion |
| Market Size in 2025 | USD 0.84 billion |
| CAGR Growth Rate | 8.8% CAGR |
| Base Year | 2025 |
| Forecast Period | 2026-2035 |
| Key Segment | By Product Type, Technology, Application, End-Use Industry and Region |
| Report Coverage | Revenue Estimation and Forecast, Company Profile, Competitive Landscape, Growth Factors and Recent Trends |
| Regional Scope | North America, Europe, Asia Pacific, Middle East & Africa, and South & Central America |
| Buying Options | Request tailored purchasing options to fulfil your requirements for research. |
Regional Analysis
How Big is the European Market Size?
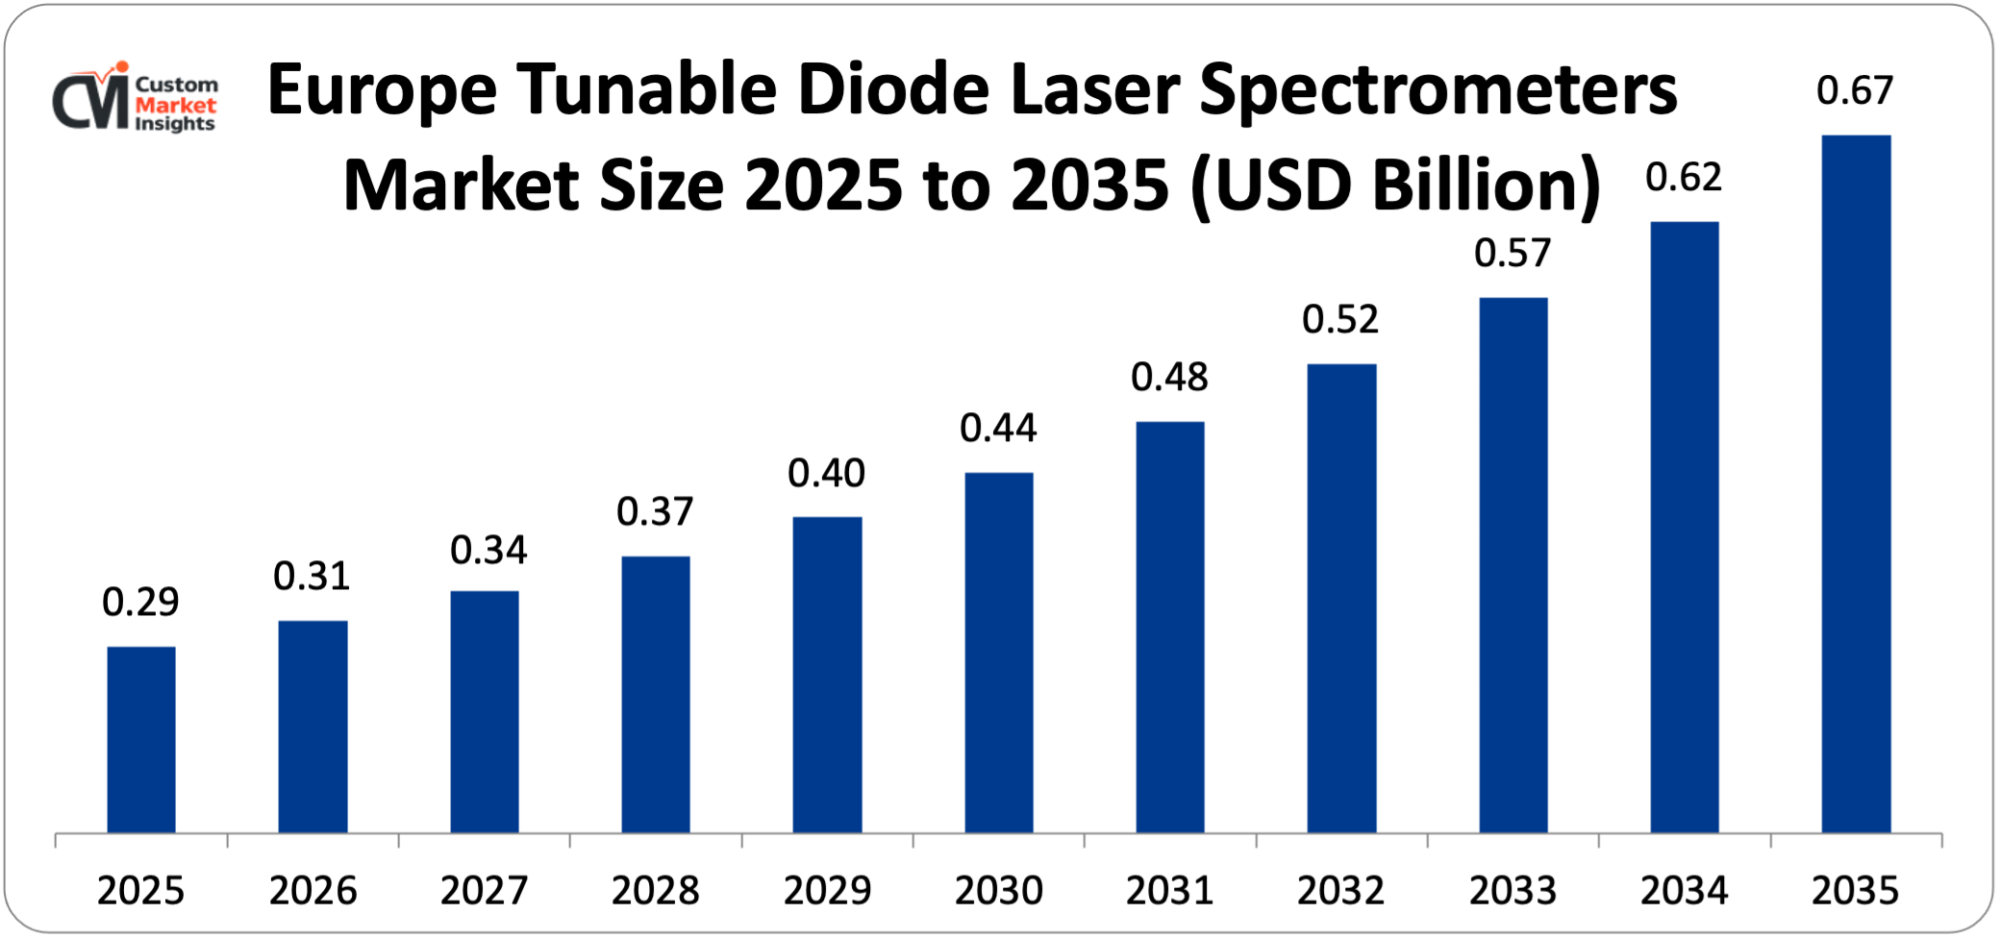
The European tunable diode laser spectrometers market size is estimated at USD 286 million in 2025 and is projected to reach approximately USD 674 million by 2035, with a CAGR of 8.9% from 2026 to 2035.
Why Did Europe Dominate the Market in 2025?
In 2025, Europe had approximately one-third of the world TDLAS market. The region owes its dominance to the fact that it is boiling down to the global center of TDLAS technology development and industrial analyser manufacture. Major manufacturers in Europe are ABB (Switzerland), Endress+Hauser (Switzerland), Siemens (Germany), and NEO Monitors (Norway). In addition, there is a high level of TDLAS research and development in European universities and national research institutes. Europe’s comprehensive industrial emissions regulations also fuel the highest concentration of regulatory-compliant TDLAs in the world, increasing on a per-facility basis the investment in process analytical technology as compared with other regions.
The EU Industrial Emissions Directive is applicable in roughly 50,000 major industrial installations in 27 member states. It requires constant monitoring of HCl, HF, Carbon Monoxide, SO₂, NOₓ, and moisture at thousands of power plants, cement kilns, glass furnaces, chemical plants, and waste incinerators. This requirement results in the highest density of regulatory-compliance TDLAS installations in the world and continues to grow as each new regulated facility means each new instrument. Germany and The United Kingdom are the two largest national TDLAS Markets in Europe. Germany, for example, has a heavy-industrial base under IED monitoring requirements and leading TDLAS manufacturers. The continuous emissions monitoring market of the UK’s MCERTS-certified market and an active North Sea oil and gas industry create significant process gas TDLAS demand.
Why is North America an Important Market?
The tunable diode laser spectrometer market in North America is predicted to further increase at an average of CAGR by 8.6 to approximately USD, between 2025 and 2035 at USD and the market is at an estimated USD 218 mills. The U.S. oil and gas market is the major market that demands TDLAS in monitoring the natural gas quality, natural gas leakage, and the process of refinements. This makes the U.S. the largest single country TDLAS application market. Additional growth occurs from the EPA’s ongoing implementation of the emissions monitoring requirements of the Clean Air Act Section 401 for coal-fired power plants and stationary sources, as well as from the EPA’s new methane monitoring requirements under the EPA’s OOOOa/OOOOb emissions monitoring rules and its methane emissions reduction program under Section 511x of the Clean Air Act, as amended by the Internal Revenue Act for the Reduction of Carbon Dioxide and Other Greenhouse Gases (IRA, 2018). The U.S. semiconductor industry, which is concentrated in Arizona, Texas, and Oregon, also requires TDLAS for process gas purity measurement in some of the main wafer fabrication facilities. Another key TDLAS market is Canada’s oil sands and conventional natural gas production industries, which are concerned with moisture measurement, H₂S monitoring, and combustion control at upgrader and processing plants.
Why is Asia Pacific the Fastest-Growing Market?
The Asia Pacific is the fastest growing region and is projected to have a CAGR of 11.2% during 2026-2035. Growth is driven by a number of factors: the ultra-low-emissions standard for coal-fired power plants in China has resulted in extensive TDLAS installations for HCl, moisture and CO measurements across the major coal generate base in the country; the highly advanced chemical and semiconductor manufacturing sectors in Japan are adopting sophisticated TDLAS process analytical technology; the semiconductor and display makers in South Korea-Samsung, SK Hynix, LG Display and Samsung Display-requires process gas purity TDLAS measurements at fabrication plants; the Central Pollution Control Board in India is promoting the adoption of online monitoring, which has triggered the installation of TDL China’s enormous investment in domestic semiconductor capacity (China Integrated Circuit Industry Investment Fund) is an additional driver in demand for TDLAS which guarantees international standard process gas quality.
Why is the Middle East & Africa Region an Emerging Market?
The Middle East and Africa (LAMEA) are exhibiting increasing TDLAS demand. Saudi Aramco, ADNOC and other national oil companies in the Gulf have extensive infrastructure for processing oil and gas processing which needs process gas monitoring for crude processing to gas sweetening and Liquefied Natural Gas processes – deploying high value instrumentation at each site. Qatar’s LNG export network has one of the largest single-country TDLAS installations in the world at the Qatargas and RasGas installations. Sasol’s synthetic fuel plants in South Africa are also using TDLAS to measure gases of processes in their coal-to-liquids processes. In case of Brazil, Petrobras employs TDLAS to process gas quality and safety monitoring in its offshore and onshore fields.
Top Players in the Market and Their Offerings
- ABB Ltd. (Analytical Instruments Division)
- Siemens AG (Process Analytics)
- Endress+Hauser Group
- Yokogawa Electric Corporation
- Emerson Electric Co. (Rosemount Analytical)
- Picarro Inc.
- Los Gatos Research (PolyScience)
- NEO Monitors AS
- Axetris AG
- Cascade Technologies Ltd. (Emerson)
- Mettler-Toledo International Inc.
- Others
Key Developments
The market has undergone significant developments as industry participants seek to advance mid-infrared QCL-based instrument capabilities, expand methane monitoring product portfolios, and respond to the growing regulatory and operational demand for continuous precision gas measurement across industrial, environmental, and semiconductor applications globally.
- In October 2024: ABB has introduced its ACF5000, a mid-infrared TDLAS analyzer for measuring formaldehyde, acetaldehyde and ethylene oxide at the same time in the pharmaceutical manufacturing environment. The device is based on a quantum-cascade laser which accesses the fundamental absorption bands of these VOCs and has detection limits of less than 0.1 ppm – much better than can be provided with near-infrared TDLAS.
- In January 2025: Picarro released its G4301 Greenhouse Gas Analyzer on a business basis. The device uses a fourth generation CRDS optical cavity, which allows CO₂, CH₄, and water vapor measurements to have a 25% improved precision compared with the predecessor, the G4302. The product targets the fast growing market atmospheric methane monitoring due to scientific studies as well as because of regulations on oil and gas operators by EPA OOOob regulations and the EU Methane Regulation.
The Tunable Diode Laser Spectrometers Market is segmented as follows:
By Product Type
- Tunable Diode Laser Absorption Spectroscopy (TDLAS) Analyzers (Single-Pass, Multi-Pass)
- Cavity-Enhanced TDLAS (CRDS, OA-ICOS, CEAS)
- Wavelength Modulation Spectroscopy (WMS) Systems
- Frequency Modulation Spectroscopy (FMS) Systems
- Other Product Types (Photoacoustic Laser Spectroscopy, Dual-Comb Spectroscopy)
By Technology
- Near-Infrared (NIR) TDLAS (780 nm–2,500 nm, Telecom-Grade DFB Lasers)
- Mid-Infrared (MIR) TDLAS (2.5 µm–20 µm, QCL, ICL)
- Other Technologies (Far-Infrared, Terahertz Laser Spectroscopy)
By Application
- Gas Concentration Measurement (O₂, CO, CO₂, CH₄, H₂O, NH₃, HCl, HF, H₂S)
- Isotope Ratio Analysis (δ¹³C, δD, δ¹⁸O, ¹²C/¹³C)
- Process Gas Analysis (Reaction Monitoring, Feed Gas Purity, Product Gas Quality)
- Combustion Monitoring (Oxygen Trim, Excess Air Control, Flue Gas Analysis)
- Environmental & Atmospheric Monitoring (Trace Gas, Greenhouse Gas, Air Quality)
- Other Applications (Breath Analysis, Leak Detection, Food Quality)
By End-Use Industry
- Oil & Gas (Upstream, Midstream, Downstream, LNG)
- Chemical & Petrochemical
- Power Generation (Coal, Gas, Nuclear, Biomass)
- Environmental Monitoring (Regulatory, Research, Urban Air Quality)
- Pharmaceutical & Life Sciences
- Semiconductor Manufacturing
- Food & Beverage (Headspace Analysis, Modified Atmosphere Packaging)
- Other Industries (Metals & Mining, Cement, Glass, Pulp & Paper)
Regional Coverage:
North America
- U.S.
- Canada
- Mexico
- Rest of North America
Europe
- Germany
- France
- U.K.
- Russia
- Italy
- Spain
- Netherlands
- Rest of Europe
Asia Pacific
- China
- Japan
- India
- New Zealand
- Australia
- South Korea
- Taiwan
- Rest of Asia Pacific
The Middle East & Africa
- Saudi Arabia
- UAE
- Egypt
- Kuwait
- South Africa
- Rest of the Middle East & Africa
Latin America
- Brazil
- Argentina
- Rest of Latin America
Table of Contents
- Chapter 1. Report Introduction
- 1.1. Report Description
- 1.1.1. Purpose of the Report
- 1.1.2. USP & Key Offerings
- 1.2. Key Benefits For Stakeholders
- 1.3. Target Audience
- 1.4. Report Scope
- 1.1. Report Description
- Chapter 2. Market Overview
- 2.1. Report Scope (Segments And Key Players)
- 2.1.1. Tunable Diode Laser Spectrometers by Segments
- 2.1.2. Tunable Diode Laser Spectrometers by Region
- 2.2. Executive Summary
- 2.2.1. Market Size & Forecast
- 2.2.2. Tunable Diode Laser Spectrometers Market Attractiveness Analysis, By Product Type
- 2.2.3. Tunable Diode Laser Spectrometers Market Attractiveness Analysis, By Technology
- 2.2.4. Tunable Diode Laser Spectrometers Market Attractiveness Analysis, By Application
- 2.2.5. Tunable Diode Laser Spectrometers Market Attractiveness Analysis, By End-Use Industry
- 2.1. Report Scope (Segments And Key Players)
- Chapter 3. Market Dynamics (DRO)
- 3.1. Market Drivers
- 3.1.1. Industrial Emissions Regulation Tightening Driving Continuous Emissions Monitoring Deployment
- 3.1.2. Natural Gas Infrastructure Methane Monitoring and Leak Detection Imperatives
- 3.2. Market Restraints
- 3.3. Market Opportunities
- 3.5. Pestle Analysis
- 3.6. Porter Forces Analysis
- 3.7. Technology Roadmap
- 3.8. Value Chain Analysis
- 3.9. Government Policy Impact Analysis
- 3.10. Pricing Analysis
- 3.1. Market Drivers
- Chapter 4. Tunable Diode Laser Spectrometers Market – By Product Type
- 4.1. Product Type Market Overview, By Product Type Segment
- 4.1.1. Tunable Diode Laser Spectrometers Market Revenue Share, By Product Type, 2025 & 2035
- 4.1.2. Tunable Diode Laser Absorption Spectroscopy (TDLAS) Analyzers (Single-Pass, Multi-Pass)
- 4.1.3. Tunable Diode Laser Spectrometers Share Forecast, By Region (USD Billion)
- 4.1.4. Comparative Revenue Analysis, By Country, 2025 & 2035
- 4.1.5. Key Market Trends, Growth Factors, & Opportunities
- 4.1.6. Cavity-Enhanced TDLAS (CRDS, OA-ICOS, CEAS)
- 4.1.7. Tunable Diode Laser Spectrometers Share Forecast, By Region (USD Billion)
- 4.1.8. Comparative Revenue Analysis, By Country, 2025 & 2035
- 4.1.9. Key Market Trends, Growth Factors, & Opportunities
- 4.1.10. Wavelength Modulation Spectroscopy (WMS) Systems
- 4.1.11. Tunable Diode Laser Spectrometers Share Forecast, By Region (USD Billion)
- 4.1.12. Comparative Revenue Analysis, By Country, 2025 & 2035
- 4.1.13. Key Market Trends, Growth Factors, & Opportunities
- 4.1.14. Frequency Modulation Spectroscopy (FMS) Systems
- 4.1.15. Tunable Diode Laser Spectrometers Share Forecast, By Region (USD Billion)
- 4.1.16. Comparative Revenue Analysis, By Country, 2025 & 2035
- 4.1.17. Key Market Trends, Growth Factors, & Opportunities
- 4.1.18. Other Product Types (Photoacoustic Laser Spectroscopy, Dual-Comb Spectroscopy)
- 4.1.19. Tunable Diode Laser Spectrometers Share Forecast, By Region (USD Billion)
- 4.1.20. Comparative Revenue Analysis, By Country, 2025 & 2035
- 4.1.21. Key Market Trends, Growth Factors, & Opportunities
- 4.1. Product Type Market Overview, By Product Type Segment
- Chapter 5. Tunable Diode Laser Spectrometers Market – By Technology
- 5.1. Technology Market Overview, By Technology Segment
- 5.1.1. Tunable Diode Laser Spectrometers Market Revenue Share, By Technology, 2025 & 2035
- 5.1.2. Near-Infrared (NIR) TDLAS (780 nm–2,500 nm, Telecom-Grade DFB Lasers)
- 5.1.3. Tunable Diode Laser Spectrometers Share Forecast, By Region (USD Billion)
- 5.1.4. Comparative Revenue Analysis, By Country, 2025 & 2035
- 5.1.5. Key Market Trends, Growth Factors, & Opportunities
- 5.1.6. Mid-Infrared (MIR) TDLAS (2.5 µm–20 µm, QCL, ICL)
- 5.1.7. Tunable Diode Laser Spectrometers Share Forecast, By Region (USD Billion)
- 5.1.8. Comparative Revenue Analysis, By Country, 2025 & 2035
- 5.1.9. Key Market Trends, Growth Factors, & Opportunities
- 5.1.10. Other Technologies (Far-Infrared, Terahertz Laser Spectroscopy)
- 5.1.11. Tunable Diode Laser Spectrometers Share Forecast, By Region (USD Billion)
- 5.1.12. Comparative Revenue Analysis, By Country, 2025 & 2035
- 5.1.13. Key Market Trends, Growth Factors, & Opportunities
- 5.1. Technology Market Overview, By Technology Segment
- Chapter 6. Tunable Diode Laser Spectrometers Market – By Application
- 6.1. Application Market Overview, By Application Segment
- 6.1.1. Tunable Diode Laser Spectrometers Market Revenue Share, By Application, 2025 & 2035
- 6.1.2. Gas Concentration Measurement (O₂, CO, CO₂, CH₄, H₂O, NH₃, HCl, HF, H₂S)
- 6.1.3. Tunable Diode Laser Spectrometers Share Forecast, By Region (USD Billion)
- 6.1.4. Comparative Revenue Analysis, By Country, 2025 & 2035
- 6.1.5. Key Market Trends, Growth Factors, & Opportunities
- 6.1.6. Isotope Ratio Analysis (δ¹³C, δD, δ¹⁸O, ¹²C/¹³C)
- 6.1.7. Tunable Diode Laser Spectrometers Share Forecast, By Region (USD Billion)
- 6.1.8. Comparative Revenue Analysis, By Country, 2025 & 2035
- 6.1.9. Key Market Trends, Growth Factors, & Opportunities
- 6.1.10. Process Gas Analysis (Reaction Monitoring, Feed Gas Purity, Product Gas Quality)
- 6.1.11. Tunable Diode Laser Spectrometers Share Forecast, By Region (USD Billion)
- 6.1.12. Comparative Revenue Analysis, By Country, 2025 & 2035
- 6.1.13. Key Market Trends, Growth Factors, & Opportunities
- 6.1.14. Combustion Monitoring (Oxygen Trim, Excess Air Control, Flue Gas Analysis)
- 6.1.15. Tunable Diode Laser Spectrometers Share Forecast, By Region (USD Billion)
- 6.1.16. Comparative Revenue Analysis, By Country, 2025 & 2035
- 6.1.17. Key Market Trends, Growth Factors, & Opportunities
- 6.1.18. Environmental & Atmospheric Monitoring (Trace Gas, Greenhouse Gas, Air Quality)
- 6.1.19. Tunable Diode Laser Spectrometers Share Forecast, By Region (USD Billion)
- 6.1.20. Comparative Revenue Analysis, By Country, 2025 & 2035
- 6.1.21. Key Market Trends, Growth Factors, & Opportunities
- 6.1.22. Other Applications (Breath Analysis, Leak Detection, Food Quality)
- 6.1.23. Tunable Diode Laser Spectrometers Share Forecast, By Region (USD Billion)
- 6.1.24. Comparative Revenue Analysis, By Country, 2025 & 2035
- 6.1.25. Key Market Trends, Growth Factors, & Opportunities
- 6.1. Application Market Overview, By Application Segment
- Chapter 7. Tunable Diode Laser Spectrometers Market – By End-Use Industry
- 7.1. End-Use Industry Market Overview, By End-Use Industry Segment
- 7.1.1. Tunable Diode Laser Spectrometers Market Revenue Share, By End-Use Industry, 2025 & 2035
- 7.1.2. Oil & Gas (Upstream, Midstream, Downstream, LNG)
- 7.1.3. Tunable Diode Laser Spectrometers Share Forecast, By Region (USD Billion)
- 7.1.4. Comparative Revenue Analysis, By Country, 2025 & 2035
- 7.1.5. Key Market Trends, Growth Factors, & Opportunities
- 7.1.6. Chemical & Petrochemical
- 7.1.7. Tunable Diode Laser Spectrometers Share Forecast, By Region (USD Billion)
- 7.1.8. Comparative Revenue Analysis, By Country, 2025 & 2035
- 7.1.9. Key Market Trends, Growth Factors, & Opportunities
- 7.1.10. Power Generation (Coal, Gas, Nuclear, Biomass)
- 7.1.11. Tunable Diode Laser Spectrometers Share Forecast, By Region (USD Billion)
- 7.1.12. Comparative Revenue Analysis, By Country, 2025 & 2035
- 7.1.13. Key Market Trends, Growth Factors, & Opportunities
- 7.1.14. Environmental Monitoring (Regulatory, Research, Urban Air Quality)
- 7.1.15. Tunable Diode Laser Spectrometers Share Forecast, By Region (USD Billion)
- 7.1.16. Comparative Revenue Analysis, By Country, 2025 & 2035
- 7.1.17. Key Market Trends, Growth Factors, & Opportunities
- 7.1.18. Pharmaceutical & Life Sciences
- 7.1.19. Tunable Diode Laser Spectrometers Share Forecast, By Region (USD Billion)
- 7.1.20. Comparative Revenue Analysis, By Country, 2025 & 2035
- 7.1.21. Key Market Trends, Growth Factors, & Opportunities
- 7.1.22. Semiconductor Manufacturing
- 7.1.23. Tunable Diode Laser Spectrometers Share Forecast, By Region (USD Billion)
- 7.1.24. Comparative Revenue Analysis, By Country, 2025 & 2035
- 7.1.25. Key Market Trends, Growth Factors, & Opportunities
- 7.1.26. Food & Beverage (Headspace Analysis, Modified Atmosphere Packaging)
- 7.1.27. Tunable Diode Laser Spectrometers Share Forecast, By Region (USD Billion)
- 7.1.28. Comparative Revenue Analysis, By Country, 2025 & 2035
- 7.1.29. Key Market Trends, Growth Factors, & Opportunities
- 7.1.30. Other Industries (Metals & Mining, Cement, Glass, Pulp & Paper)
- 7.1.31. Tunable Diode Laser Spectrometers Share Forecast, By Region (USD Billion)
- 7.1.32. Comparative Revenue Analysis, By Country, 2025 & 2035
- 7.1.33. Key Market Trends, Growth Factors, & Opportunities
- 7.1. End-Use Industry Market Overview, By End-Use Industry Segment
- Chapter 8. Tunable Diode Laser Spectrometers Market – Regional Analysis
- 8.1. Tunable Diode Laser Spectrometers Market Overview, By Region Segment
- 8.1.1. Global Tunable Diode Laser Spectrometers Market Revenue Share, By Region, 2025 & 2035
- 8.1.2. Global Tunable Diode Laser Spectrometers Market Revenue, By Region, 2026 – 2035 (USD Billion)
- 8.1.3. Global Tunable Diode Laser Spectrometers Market Revenue, By Product Type, 2026 – 2035
- 8.1.4. Global Tunable Diode Laser Spectrometers Market Revenue, By Technology, 2026 – 2035
- 8.1.5. Global Tunable Diode Laser Spectrometers Market Revenue, By Application, 2026 – 2035
- 8.1.6. Global Tunable Diode Laser Spectrometers Market Revenue, By End-Use Industry, 2026 – 2035
- 8.2. North America
- 8.2.1. North America Tunable Diode Laser Spectrometers Market Revenue, By Country, 2026 – 2035 (USD Billion)
- 8.2.2. North America Tunable Diode Laser Spectrometers Market Revenue, By Product Type, 2026 – 2035
- 8.2.3. North America Tunable Diode Laser Spectrometers Market Revenue, By Technology, 2026 – 2035
- 8.2.4. North America Tunable Diode Laser Spectrometers Market Revenue, By Application, 2026 – 2035
- 8.2.5. North America Tunable Diode Laser Spectrometers Market Revenue, By End-Use Industry, 2026 – 2035
- 8.2.6. U.S. Tunable Diode Laser Spectrometers Market Revenue, 2026 – 2035 (USD Billion)
- 8.2.7. Canada Tunable Diode Laser Spectrometers Market Revenue, 2026 – 2035 (USD Billion)
- 8.2.8. Mexico Tunable Diode Laser Spectrometers Market Revenue, 2026 – 2035 (USD Billion)
- 8.2.9. Rest of North America Tunable Diode Laser Spectrometers Market Revenue, 2026 – 2035 (USD Billion)
- 8.3. Europe
- 8.3.1. Europe Tunable Diode Laser Spectrometers Market Revenue, By Country, 2026 – 2035 (USD Billion)
- 8.3.2. Europe Tunable Diode Laser Spectrometers Market Revenue, By Product Type, 2026 – 2035
- 8.3.3. Europe Tunable Diode Laser Spectrometers Market Revenue, By Technology, 2026 – 2035
- 8.3.4. Europe Tunable Diode Laser Spectrometers Market Revenue, By Application, 2026 – 2035
- 8.3.5. Europe Tunable Diode Laser Spectrometers Market Revenue, By End-Use Industry, 2026 – 2035
- 8.3.6. Germany Tunable Diode Laser Spectrometers Market Revenue, 2026 – 2035 (USD Billion)
- 8.3.7. France Tunable Diode Laser Spectrometers Market Revenue, 2026 – 2035 (USD Billion)
- 8.3.8. U.K. Tunable Diode Laser Spectrometers Market Revenue, 2026 – 2035 (USD Billion)
- 8.3.9. Russia Tunable Diode Laser Spectrometers Market Revenue, 2026 – 2035 (USD Billion)
- 8.3.10. Italy Tunable Diode Laser Spectrometers Market Revenue, 2026 – 2035 (USD Billion)
- 8.3.11. Spain Tunable Diode Laser Spectrometers Market Revenue, 2026 – 2035 (USD Billion)
- 8.3.12. Netherlands Tunable Diode Laser Spectrometers Market Revenue, 2026 – 2035 (USD Billion)
- 8.3.13. Rest of Europe Tunable Diode Laser Spectrometers Market Revenue, 2026 – 2035 (USD Billion)
- 8.4. Asia Pacific
- 8.4.1. Asia Pacific Tunable Diode Laser Spectrometers Market Revenue, By Country, 2026 – 2035 (USD Billion)
- 8.4.2. Asia Pacific Tunable Diode Laser Spectrometers Market Revenue, By Product Type, 2026 – 2035
- 8.4.3. Asia Pacific Tunable Diode Laser Spectrometers Market Revenue, By Technology, 2026 – 2035
- 8.4.4. Asia Pacific Tunable Diode Laser Spectrometers Market Revenue, By Application, 2026 – 2035
- 8.4.5. Asia Pacific Tunable Diode Laser Spectrometers Market Revenue, By End-Use Industry, 2026 – 2035
- 8.4.6. China Tunable Diode Laser Spectrometers Market Revenue, 2026 – 2035 (USD Billion)
- 8.4.7. Japan Tunable Diode Laser Spectrometers Market Revenue, 2026 – 2035 (USD Billion)
- 8.4.8. India Tunable Diode Laser Spectrometers Market Revenue, 2026 – 2035 (USD Billion)
- 8.4.9. New Zealand Tunable Diode Laser Spectrometers Market Revenue, 2026 – 2035 (USD Billion)
- 8.4.10. Australia Tunable Diode Laser Spectrometers Market Revenue, 2026 – 2035 (USD Billion)
- 8.4.11. South Korea Tunable Diode Laser Spectrometers Market Revenue, 2026 – 2035 (USD Billion)
- 8.4.12. Taiwan Tunable Diode Laser Spectrometers Market Revenue, 2026 – 2035 (USD Billion)
- 8.4.13. Rest of Asia Pacific Tunable Diode Laser Spectrometers Market Revenue, 2026 – 2035 (USD Billion)
- 8.5. The Middle-East and Africa
- 8.5.1. The Middle-East and Africa Tunable Diode Laser Spectrometers Market Revenue, By Country, 2026 – 2035 (USD Billion)
- 8.5.2. The Middle-East and Africa Tunable Diode Laser Spectrometers Market Revenue, By Product Type, 2026 – 2035
- 8.5.3. The Middle-East and Africa Tunable Diode Laser Spectrometers Market Revenue, By Technology, 2026 – 2035
- 8.5.4. The Middle-East and Africa Tunable Diode Laser Spectrometers Market Revenue, By Application, 2026 – 2035
- 8.5.5. The Middle-East and Africa Tunable Diode Laser Spectrometers Market Revenue, By End-Use Industry, 2026 – 2035
- 8.5.6. Saudi Arabia Tunable Diode Laser Spectrometers Market Revenue, 2026 – 2035 (USD Billion)
- 8.5.7. UAE Tunable Diode Laser Spectrometers Market Revenue, 2026 – 2035 (USD Billion)
- 8.5.8. Egypt Tunable Diode Laser Spectrometers Market Revenue, 2026 – 2035 (USD Billion)
- 8.5.9. Kuwait Tunable Diode Laser Spectrometers Market Revenue, 2026 – 2035 (USD Billion)
- 8.5.10. South Africa Tunable Diode Laser Spectrometers Market Revenue, 2026 – 2035 (USD Billion)
- 8.5.11. Rest of the Middle East & Africa Tunable Diode Laser Spectrometers Market Revenue, 2026 – 2035 (USD Billion)
- 8.6. Latin America
- 8.6.1. Latin America Tunable Diode Laser Spectrometers Market Revenue, By Country, 2026 – 2035 (USD Billion)
- 8.6.2. Latin America Tunable Diode Laser Spectrometers Market Revenue, By Product Type, 2026 – 2035
- 8.6.3. Latin America Tunable Diode Laser Spectrometers Market Revenue, By Technology, 2026 – 2035
- 8.6.4. Latin America Tunable Diode Laser Spectrometers Market Revenue, By Application, 2026 – 2035
- 8.6.5. Latin America Tunable Diode Laser Spectrometers Market Revenue, By End-Use Industry, 2026 – 2035
- 8.6.6. Brazil Tunable Diode Laser Spectrometers Market Revenue, 2026 – 2035 (USD Billion)
- 8.6.7. Argentina Tunable Diode Laser Spectrometers Market Revenue, 2026 – 2035 (USD Billion)
- 8.6.8. Rest of Latin America Tunable Diode Laser Spectrometers Market Revenue, 2026 – 2035 (USD Billion)
- 8.1. Tunable Diode Laser Spectrometers Market Overview, By Region Segment
- Chapter 9. Competitive Landscape
- 9.1. Company Market Share Analysis – 2025
- 9.1.1. Global Tunable Diode Laser Spectrometers Market: Company Market Share, 2025
- 9.2. Global Tunable Diode Laser Spectrometers Market Company Market Share, 2024
- 9.1. Company Market Share Analysis – 2025
- Chapter 10. Company Profiles
- 10.1. ABB Ltd. (Analytical Instruments Division)
- 10.1.1. Company Overview
- 10.1.2. Key Executives
- 10.1.3. Product Portfolio
- 10.1.4. Financial Overview
- 10.1.5. Operating Business Segments
- 10.1.6. Business Performance
- 10.1.7. Recent Developments
- 10.2. Siemens AG (Process Analytics)
- 10.3. Endress+Hauser Group
- 10.4. Yokogawa Electric Corporation
- 10.5. Emerson Electric Co. (Rosemount Analytical)
- 10.6. Picarro Inc.
- 10.7. Los Gatos Research (PolyScience)
- 10.8. NEO Monitors AS
- 10.9. Axetris AG
- 10.10. Cascade Technologies Ltd. (Emerson)
- 10.11. Mettler-Toledo International Inc.
- 10.12. Others.
- 10.1. ABB Ltd. (Analytical Instruments Division)
- Chapter 11. Research Methodology
- 11.1. Research Methodology
- 11.2. Secondary Research
- 11.3. Primary Research
- 11.3.1. Analyst Tools and Models
- 11.4. Research Limitations
- 11.5. Assumptions
- 11.6. Insights From Primary Respondents
- 11.7. Why Custom Market Insights
- Chapter 12. Standard Report Commercials & Add-Ons
- 12.1. Customization Options
- 12.2. Subscription Module For Market Research Reports
- 12.3. Client Testimonials
List Of Figures
Figures No 1 to 40
List Of Tables
Tables No 1 to 51
Prominent Player
- ABB Ltd. (Analytical Instruments Division)
- Siemens AG (Process Analytics)
- Endress+Hauser Group
- Yokogawa Electric Corporation
- Emerson Electric Co. (Rosemount Analytical)
- Picarro Inc.
- Los Gatos Research (PolyScience)
- NEO Monitors AS
- Axetris AG
- Cascade Technologies Ltd. (Emerson)
- Mettler-Toledo International Inc.
- Others
FAQs
The key players in the market are ABB Ltd. (Analytical Instruments Division), Siemens AG (Process Analytics), Endress+Hauser Group, Yokogawa Electric Corporation, Emerson Electric Co. (Rosemount Analytical), Picarro Inc., Los Gatos Research (PolyScience), NEO Monitors AS, Axetris AG, Cascade Technologies Ltd. (Emerson), Mettler-Toledo International Inc., Others.
Government regulations are the major driving factor for the industrial TDLAS market. They take the form of emission monitoring mandates, process safety rules, product quality standards and greenhouse gas reporting, which together generate a compliance-driven demand for TDLAs installations, underpinning a steady increase in TDLAs installations. The EU Industrial Emissions Directive (IED), the most extensive air emissions legislation in the world, is compelling some 50 000 major installations in Europe to install TDLAS compatible continuous monitoring. The EN14181 quality-assurance framework sets performance and calibration guidelines that these systems need to comply with, making IED compliance the one most significant commercial force behind the need for European TDLAS demand in the case of the TDLAS. The New Source Performance Standards (NSPS) and National Emission Standards Hazardous Air Pollutants (NESHAP) in the Clean Air Act rely on the monitoring of power plants, boilers, and chemical factories constantly under the U.S. TDLAS has superior selectivity and sensitivity to species such as HCl, HF, CO, and SO₂ which gives TDLAS an edge over alternatives. China’s ambient and point source emission standards (issued by the Ministry of Ecology and Environment) provide for a rapid scale-up of monitoring infrastructure. The very low emissions numbers can also increase the measurement accuracy demands, and in this regard, TDLAS is best suited. Oil and gas facilities under the EPA methane-monitoring rule-making, which covers both old and new/modifying sources, require constant monitoring of methane and, in that way, make the use of TDLAS in oil and gas facilities an even faster adoption than voluntary programs. Process gases in semiconductor manufacturing in semiconductor manufacturing, industry organizations such as SEMI and the International Technology Roadmap for Semiconductors establish moisture and oxygen value limits in the industry process gases in the ppb-ppt range. These internal standards are the reason that TDLAS-based purity monitoring is appearing at leading edge fabs, and this is a good example of how industry technical standards can be as influential as formal government regulation.
Tunable diode laser spectrometer Price varies tremendously, based on the configuration of the instrument, the application, and the demanding performance. Entry level NIR TDLAS single species analyzers – for oxygen or moisture in noncritical processes—between USD 5 000 and USD 15 000 These offer cheap-to-budget TDLAS capacity for smaller facilities for whom the performance improvement over conventional electrochemical or NDIR sensors is worth the small premium. The primary revenue segment is the standard industrial TDLAS process analyzers that are priced between USD 15,000 and 60,000 per system, including installation hardware. They make on-site or extractive measurements of CO, CO₂, CH₄, H₂O, or NH₃ and satisfy IED or other equivalent regulatory certification, competing directly with NDIR and UV/Vis solutions. Regulatory-grade, multi-species cross-stack TDLAs analyzers – certified by TUV SUD QAL1 or MCERTS for HCl, HF, NH₃, or moisture in difficult source conditions – are available for USD 40,000 – 150,000 per installation, due to engineering complexity, expenses for certification, and requirements for infrastructure. Cavity-Enhanced TDLAS based instruments for ultra-trace applications (e.g. for atmospheric gas analysis, semiconductor process gas moisture analysis): Picarro CRDS) are priced from USD50 000 up to USD200 000. The premium reflectiveness attaches to perfect cavity bodily construction, high-summit electronics, and application-possible validation. The installed cost plus commissioning, annual calibration, and consumable transactions can be the total cost of ownership of usually 50 to 100% of the initial cost in a five-year horizon. Certified regulatory monitoring means higher service intensity, and this requires a periodic QAL2 calibration audit and QAL3 quality assurance check per EN 14181.
Based on analysis of the current scenario, the market is expected to reach around USD 2.14 billion by 2035. This growth will be driven by the increasing need in the international community for continuous emissions monitoring. As developing countries implement similar monitoring standards as defined by the European Union (EU) and the United States (US), the demand for TDLAS installations will branch out of North America and Europe. Such regulations as the EU Methane Regulation and other national programs will necessitate accuracy in measuring the quantity of methane in production sites, processing sites, and transmission sites, which will prompt the use of TDLAS throughout the entire supply chain of oil and gas supply in the world system. Semiconductor manufacturing is also taking off with the CHIPS Act and similar national investment initiatives, which makes the process gas purity TDLAS requirements in new wafer fabs demand to grow. Mid-infrared QCL TDLAS price cuts are introducing the technology to the application areas of environmental monitoring, industrial hygiene, and breath diagnostics fields where instrumentation prices were too high. The industrial eruption in the Asia Pacific (in particular, China, India, and Southeast Asia) contributes a significant amount of monitoring demands to the European and North American base. Finally, a growing IoT Sensor Network segment will lead to a high – volume, low-per-unit-value TDLAS market that complements a high value industrial analyzer market, which is well established, all at a CAGR of 8.8% from 2026 to 2035.
Europe will continue to have the largest revenue share during the forecast period and will attain about 34% of the global market in 2025. The EU Industrial Emissions Directive establishes the greatest concentration of the regulatory-compliance TDLAS demand, bearing approximately 50,000 authorized industrial installations. Europe is home to the world’s leading TDLAS manufacturers, who provide proximity and engineering expertise advantages. The industrial base of the region, such as power generation, cement, chemical, and waste incineration, results in a diversity of TDLAs demand. Germany and the United Kingdom are the biggest national markets. The new methane TDLAS demand that will arise with the adoption of the EU Methane Regulation in 2024 will be complemented by the pre-established emissions monitoring market environment in the European natural gas infrastructure.
Asia Pacific will have the fastest growth with a CAGR of 11.2% over the forecast period. The TDLAS market in China is projected to reach an estimated USD around USD112 million in 2025 with the growth rate of 12.4% CAGR during ultra-low emissions policies and semiconductor manufacturing development. South Korea’s Samsung and SK Hynix facilities need process gas purity TDLAs. The online emissions monitoring given by the CPCB of India to industries requires the installation of the TDLAS in all the industries with large and rapidly rising industries. Advanced TDLAS is also used by the chemical and semiconductor industries of Japan. Domestic Chinese manufacturers like Focused Photonics are making a run for the market and forcing international suppliers to reduce prices.
The Tunable Diode Laser Spectrometers Market is projected to rise to a greater level. The EU Industrial Emissions Directive covers some 50,000 major industrial installations, which means there will be uninterrupted emissions monitoring of HCl, HF, CO and moisture that TDLAS will be able to support better than other technologies. China’s Ultra – Low Emissions standard of SO₂ below 35 mg/Nm³ and NOx below 50 mg/Nm³ at around 1000 GW of coal fired generation are driving large TDLAs installations. According to the IEA, the oil and gas industry contributes approximately 40% of all global methane emissions, which forms a basis of policy and regulatory frameworks of TDLAS methane monitoring. The IRA Methane Emissions Reduction Program as well as U.S. EPA OOOb regulations provide financial incentives on methane TDLAS in U.S. oil and gas sites. The G4301 of Picarro has a CH₄ accuracy of 0.05 ppb, and it is certified via the correctness of NOAA, which provides metrological validity in controlling methane in the air. Quantum cascade laser technology can be used to achieve a mid-infrared TDLAS platform with 10 to 100 times improved detection sensitivity for NO, SO₂, and formaldehyde – gases which NIR TDLAS cannot detect adequately. NEO Monitors’ LaserGas Q+ TÜV SUD QAL1 certification for regulatory acceptance of simultaneous HCl/HF cross-duct TDLAS for EU IED compliance monitoring.