Electric Commercial Vehicle Market Size, Trends and Insights By Vehicle Type (Light Commercial Vehicles (LCVs), Heavy Trucks, Buses & Coaches), By Propulsion Type (Battery Electric Vehicle (BEV), Plug-in Hybrid Electric vehicle (PHEV), Fuel Cell Electric Vehicle (FCEV)), and By Region - Global Industry Overview, Statistical Data, Competitive Analysis, Share, Outlook, and Forecast 2026 – 2035
Report Snapshot
CAGR: 18.5%
| Study Period: | 2026-2035 |
| Fastest Growing Market: | Europe |
| Largest Market: | Asia Pacific |
Major Players
- BYD Auto Co. Ltd.
- Daimler Truck AG
- AB Volvo
- Traton SE
- Others
Reports Description
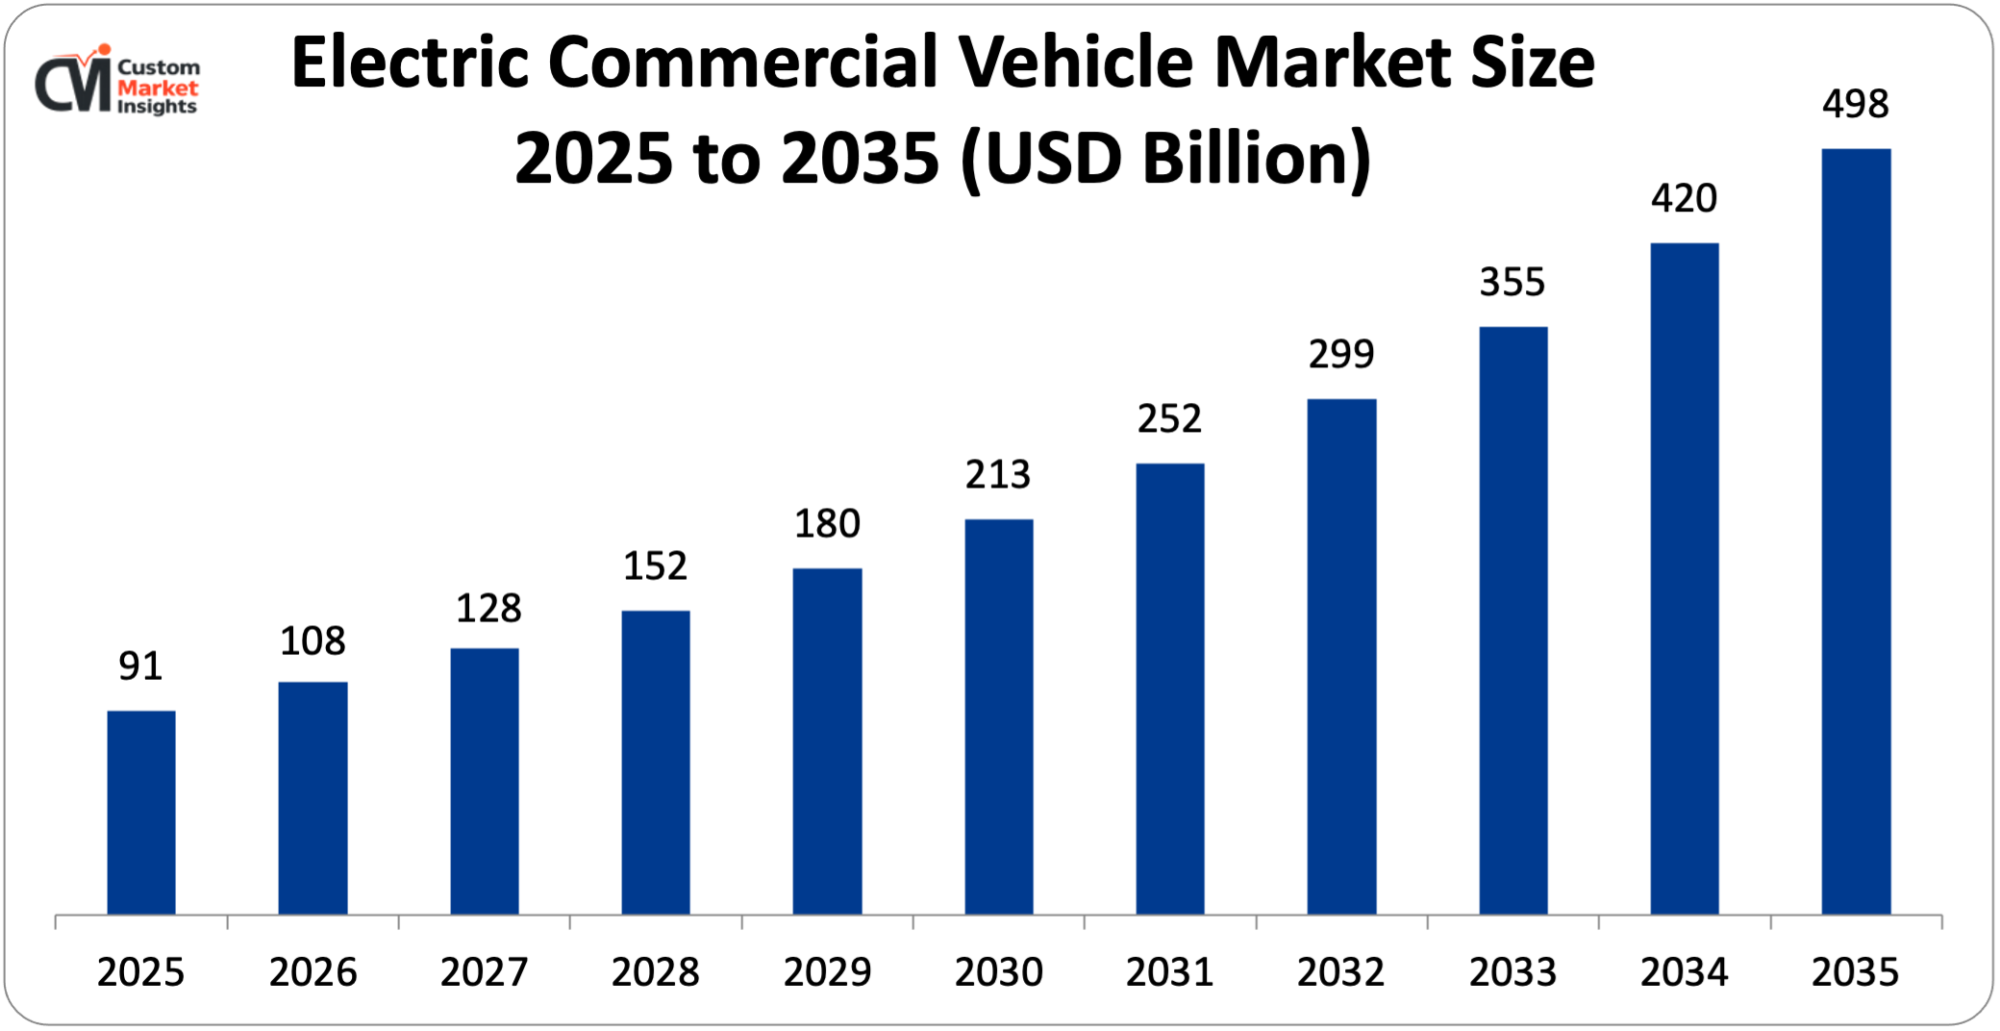
The market size of global electric commercial vehicles will be estimated at USD 91 billion in 2025 and is expected to grow to between USD 108 billion in 2026 and about USD 498 billion by 2035, with a current CAGR (compound annual growth rate) of 18.5% during the period of 2026 to 2035. The Electric Commercial Vehicle (ECV) market is describing the part of the transportation industry concerned with vehicles of commercial use only and that are running either fully or partially on electricity instead of internal combustion engines.
The vehicles are using electric drivetrains supported by battery packs or other electric energy storage systems and striving for actual operation with zero or nearly zero tailpipe emissions. It includes electric buses, passenger and light trucks, utility, service, and delivery vans, tuk-tuks, etc. Used mainly for commodity transportation, public transportation, logistics, and industrial activities. The electric commercial vehicles are getting used increasingly by transportation companies, public transportation agencies, and logistics companies because of the extended life of parts, their lower operating and maintenance costs, their better efficiency, and the fact that they are respectful of the environment. The electric vehicles are emphasizing the reduction of carbon emissions and the “green” ways of transportation.
Market Highlight
- In 2025, the Asia Pacific will dominate the global market with an estimated market share of 44%. Increasing government initiatives and product launches drive the regional expansion.
- Europe is growing at the highest CAGR over the analysis period. The increasing sustainability goals drive the industry growth.
- By vehicle type, the buses & coaches segment was the biggest in 2025 comprising over 65% of the industry.
- By propulsion type, the Battery Electric Vehicle (BEV) segment would have the highest share of the market in 2025.
Significant Growth Factors
The electric commercial vehicle market trends present significant growth opportunities due to several factors:
- Stringent Emission Regulations & Sustainability Goals: Stringent emissions regulations combined with sustainability targets are also driving growth in the ECV market. Countries around the world are introducing tighter standards to curb greenhouse gases and improve air quality in major metros, which will see an increase in emissions from commercial vehicles running in city limits. Adopting applicable standards such as BS-VI norms in India or Euro VI norms or even implementing zero-emission vehicle mandates is incentivizing fleet owners and manufacturers to transition to cleaner electric vehicles. Meanwhile, city authorities are implementing low-emissions zones and enforcement bans on diesel cars. Organizations across the world are further setting progressively ambitious sustainability and net-zero emissions goals for internal operations and supply chains, which is pressuring logistics companies and air/sea/road public transport agencies to develop their electric vehicle offerings. Electric commercial vehicles with zero tailpipe emissions and generally higher energy efficiencies are assisting organizations to accelerate compliance while also positively impacting their environmental, social, and corporate governance (ESG) metrics, which is helping drive demand.
- Rising Fuel Prices & Energy Security Concerns: Growing energy security concerns and rising fuel prices are the major factors fueling the electric commercial vehicle market. The fluctuations and escalation in prices of diesel and petrol have been pushing the commercial fleets’ running cost to new heights. The commercial fleets engaged in logistics, public transport, last-mile deliveries, and other such applications have a comparatively larger share of their fleet costs attributable to fuel than the end consumer. The cost energy required for commercial electric vehicles is more predictable over a long-term period and ultimately at a lower rate of energy compared to traditional fuel, as the electricity prices are more stable and can be derived from home or renewable sources. Moreover, many nations have increased their effort to utilize fewer amounts of imported crude to attain increased energy security and economic development. Adoption of electric commercial vehicles will help them bring down their exposure to the uncontrollable rise in global oil prices and develop a more reliable and cleaner energy system.
What are the Major Advances Changing the Electric Commercial Vehicle Market Today?
- Next-generation Battery Technologies: This is a significant step forward in the Electric Commercial Vehicle industry, mainly driven by continuous product innovations at the company level. Leading enterprises in the electric commercial vehicle sector include Contemporary Amperex Technology Co. Ltd., BYD Company Ltd., Toyota Motor Corporation, LG Energy Solution Ltd., and others. All these companies are investing heavily in the development of next-generation battery technology to improve the efficiency of Electric Commercial Vehicles. To name a few, Contemporary Amperex Technology Co. Limited is launching ultra-fast charging batteries, known as the Shenxing battery, which will provide significant driving range in just a matter of a few minutes. Moreover, the company is also developing sodium-ion batteries to avoid dependency on Lithium and reduce costs. BYD Company Limited is launching its Blade Battery innovation using better Lithium Iron Phosphate technology, which will provide better safety, lifespan, and fast charging capabilities, making this technology very suitable for commercial use. On the other hand, Toyota Motor Corporation is developing the next generation of battery technology, known as the solid-state battery, which will provide better energy density, fast charging, and better safety, making this technology very suitable for commercial use for electric trucks. In addition, LG Energy Solution Limited is in the course of developing silicon-anode and cobalt-free battery products to enhance the energy density of the batteries to be green.
- Sodium-ion Batteries – Cost Disruption Innovation: Sodium-ion batteries, as a cost-disruption innovation, are helping the growth of the Electric Commercial Vehicle Market (ECV). Comparing it with Li-ion batteries, this type of battery uses the most common resources, being sodium, which are easier to get and less critical than other so-called geopolitically critical resources from a geopolitical point of view by being less geopolitically sensitive, such as lithium, cobalt, and nickel. As a result, the final production costs for the battery will be decreased and, consequently, the costs for producing electric commercial vehicles. For critical markets, such as last-mile logistics, small fleet sizes, and new markets, this investment can be used to help electric commercial vehicle cost reduction. Well-known companies, such as Amperex Technology Co. Limited, are actively developing sodium-ion batteries in order to contribute to the commercialization of this new technology, which provides safety, more stable performance in a broader temperature range, cost competitiveness in terms of energy density, and many other positive features. Features such as improved thermal stability and reduced fire risk are important factors when choosing batteries for commercial vehicles due to the fact that these vehicles are exposed to harsher conditions and more laborious usage than other types of vehicles. The importance of sodium-ion batteries is related to the fact that the battery is responsible for a huge part of the costs involved in producing electric commercial vehicles.
Category Wise Insights
By Vehicle Type
Why do Buses & Coaches Hold a Prominent Position in the Market?
The buses & coaches segment was the biggest in 2025 comprising over 65% of the industry, dominated by rising demand for greener/eco-friendly concepts of urban mobility. Rapid urbanization coupled with various measures by the governments across the globe to restrict air pollution and carbon emissions leads to the incorporation of electric buses in public transport fleets. Electric buses offer a more economical mode of transport as total cost of ownership diminishes owing to fewer operational and maintenance costs, offering attractive benefits and eased regulation. Additionally, electric bus systems are silent and emissionless, ensuring a smooth, fuss-free environment.
The Light Commercial Vehicles (LCVs) segment is growing at the highest CAGR during the forecast period. The electric LCV market is expanding rapidly, driven by the growth of e-commerce and the ever-increasing need for urban logistics and last-mile delivery. Electric LCVs serve both purposes perfectly, having zero-emission operations, lower operating costs, and access to city centers. As, due to corporate responsibility, more and more companies are trying to minimize their impact on the environment, the electric LCV market is following suit. Once the issues surrounding range and payload limitation are resolved, their use will become widespread.
By Propulsion Type
Why Do Battery Electric Vehicles (BEVs) Capture the Highest Market Share in the Electric Commercial Vehicle Market?
The Battery Electric Vehicle (BEV) segment would have the highest share of the market in 2025. A significant increase in this segment is expected due to the innovations in batteries, decreasing battery prices, and a more widespread growth in charging infrastructure. For short- and medium-range transport within and between cities and regional connections, the case for BEVs and PHEVs as a feasible way of fulfilling demand is powerful, since their ease of use, operating costs, and lower maintenance make them so well-suited to delivery vans, buses, and town, city, and regional fleet operations. Furthermore, public policy support in the form of tax breaks and cities banning the most polluting vehicles will stimulate this market.
The Fuel Cell Electric Vehicle (FCEV) segment is growing at a rapid rate over the projected period. FCEV use in segments necessitating high range, high payload capability, and quick refueling, such as long-haul trucking and intercity buses, is promising as hydrogen infrastructure investments increase, subsidies are provided for zero-emission heavy-duty transportation, and long duty cycles and extreme weather conditions can be more efficiently managed. Additionally, as the cost per unit of energy in hydrogen production decreases and infrastructure increases, FCEVs are expected to further complement BEV use in more demanding applications that are less achievable by battery-only methods, further contributing to the segment.
Report Scope
| Feature of the Report | Details |
| Market Size in 2026 | USD 108 billion |
| Projected Market Size in 2035 | USD 498 billion |
| Market Size in 2025 | USD 91 billion |
| CAGR Growth Rate | 18.5% CAGR |
| Base Year | 2025 |
| Forecast Period | 2026-2035 |
| Key Segment | By Vehicle Type, Propulsion Type and Region |
| Report Coverage | Revenue Estimation and Forecast, Company Profile, Competitive Landscape, Growth Factors and Recent Trends |
| Regional Scope | North America, Europe, Asia Pacific, Middle East & Africa, and South & Central America |
| Buying Options | Request tailored purchasing options to fulfil your requirements for research. |
Regional Analysis
How Big is the Asia Pacific Electric Commercial Vehicle Market Size?
Its market size, in terms of the Asia Pacific electric commercial vehicle, is projected to be USD 40 billion in 2025 with a growth of about USD 240 billion in 2035 with a CAGR of 19.6% between 2026 and 2035.

Why did the Asia Pacific Dominate the Electric Commercial Vehicle Market in 2025?
In 2025, the Asia Pacific will dominate the global market with an estimated market share of 44%. This growth is supported by high urbanization, government regulations, and increasing logistics requirements in developing economies. The region is supported by a robust manufacturing industry (in China and India) coupled with increasing demand for affordable and green urban transportation solutions.
India Electric Commercial Vehicle Market Trends
In the Asia Pacific region, India is growing at a significant rate over the projected period. The market is growing with strong government support through the FAMEII scheme, rising fuel prices, and the move towards clean mobility in cities. Indicators of this can be seen from the wide penetration of electric Light Commercial Vehicles and electric buses for last-mile logistics and public transport. India OEMs are expanding into low-cost electric vehicles with incentives and state policies. Electrification is being built into India s Oil dependency and pollution mitigation requirements.
Why is Europe Experiencing Significant Growth in the Electric Commercial Vehicle Market?
Europe holds a significant market share in 2025. The market is being pushed by aggressive climate objectives, low emission zones, and sound policy support from the EU. Lenders across the region are strongly investing in the charging infrastructure covering most of the regional and urban commercial vehicles. Public and private sectors are also busily accelerating the electrification due to environmental commitments and increasing private pressure, driving the growth in Electric Commercial Vehicles industry.
UK Electric Commercial Vehicle Market Trends
The UK held the dominant position in the market in 2025. Government incentives, urban clean air programs, and a clear plan to end the sales of internal combustion vehicles support this initiative. Electric vans and light trucks meeting logistics requirements are becoming more available in the region. With such a supportive policy environment, the transition is helping delivery, municipal, and utility segments.
Why is North America Growing at a Moderate Rate in the Electric Commercial Vehicle Market?
North America is expected to grow at a moderate rate over the projected period. In North America, growth is being fueled by robust federal and state incentives, corporate fleet electrification targets, and the rapid build-out of charging infrastructure. Initiatives such as the Inflation Reduction Act in the U. S. And the California Advanced Clean Trucks regulation are pushing commercial EV adoption further along.
US Electric Commercial Vehicle Market Trends
The US holds the prominent market share in the industry. The country’s market growth is fueled by federal funding, corporate ESG commitments, and a rapidly expanding electric fleet segment.
Why is the Middle East & Africa Region is growing rapidly in the Electric Commercial Vehicle?
The MEA region is growing at a steady rate over the projected period. Being successfully promoted by a mix of government policies, economic diversification, and rising demand for green travel.
UAE Electric Commercial Vehicle Market Trends
The UAE is growing at the highest CAGR during the forecast period. The rising environmental regulation and technological innovation drive the industry growth in the region.
Top Players in the Electric Commercial Vehicle Market and Their Offerings
- BYD Auto Co. Ltd.
- Daimler Truck AG
- AB Volvo
- Traton SE
- Zhengzhou Yutong Bus Co. Ltd
- Ford Motor Company
- Tesla Inc.
- Proterra Inc.
- Rivian Automotive Inc.
- Tata Motors Limited
- Olectra Greentech Limited
- PACCAR Inc.
- Nikola Corporation
- NFI Group Inc. (New Flyer)
- Hyundai Motor Company
- Isuzu Motors Limited
- Mitsubishi Fuso Truck & Bus Corporation
- Others
Key Developments
Electric commercial vehicle market has experienced considerable changes in the last two years as the market players are trying to diversify their technological aspects and develop product portfolios using strategic approaches.
- In December 2025, YOUDHA launched the Trevo L5 electric cargo three-wheeler on Sunday in New Delhi, designed for last-mile delivery and intra-city logistics operations. The vehicle is priced between ₹4.35 lakh and ₹4.75 lakh and targets businesses transitioning from ICE-powered cargo three-wheelers to electric mobility. (https://www.autocarpro.in/news/youdha-launches-trevo-l5-electric-cargo-three-wheeler-for-last-mile-logistics-130252)
- In June 2025, IVECO unveiled two new electric vehicles dedicated to city missions, the eJolly and eSuperJolly. True Jack-of-all-trades, the vehicles combine extreme versatility, ample load capacity, and extended range and fast charging to deliver zero-emission performance for a wide variety of missions in city centers. The new ranges also benefit from the peace of mind that comes from having the backing of IVECO’s 50 years of expertise, extensive mission customization capacity, and state-of-the-art services and assistance. (https://www.iveco.com/global/press/pressreleases/2025/IVECO-completes-its-electric-offer-of-light-commercial-vehicles-with-the-new-eJolly-and-eSuperJolly)
These strategic measures have enabled the companies to reinforce their competitive positions, increase the product line, boost their technological competencies, and also seize growth opportunities in the fast-growing electric commercial vehicle market.
The Electric Commercial Vehicle Market is segmented as follows:
By Vehicle Type
- Light Commercial Vehicles (LCVs)
- Heavy Trucks
- Buses & Coaches
By Propulsion Type
- Battery Electric Vehicle (BEV)
- Plug-in Hybrid Electric vehicle (PHEV)
- Fuel Cell Electric Vehicle (FCEV)
Regional Coverage:
North America
- U.S.
- Canada
- Mexico
- Rest of North America
Europe
- Germany
- France
- U.K.
- Russia
- Italy
- Spain
- Netherlands
- Rest of Europe
Asia Pacific
- China
- Japan
- India
- New Zealand
- Australia
- South Korea
- Taiwan
- Rest of Asia Pacific
The Middle East & Africa
- Saudi Arabia
- UAE
- Egypt
- Kuwait
- South Africa
- Rest of the Middle East & Africa
Latin America
- Brazil
- Argentina
- Rest of Latin America
Table of Contents
- Chapter 1. Report Introduction
- 1.1. Report Description
- 1.1.1. Purpose of the Report
- 1.1.2. USP & Key Offerings
- 1.2. Key Benefits For Stakeholders
- 1.3. Target Audience
- 1.4. Report Scope
- 1.1. Report Description
- Chapter 2. Market Overview
- 2.1. Report Scope (Segments And Key Players)
- 2.1.1. Electric Commercial Vehicle by Segments
- 2.1.2. Electric Commercial Vehicle by Region
- 2.2. Executive Summary
- 2.2.1. Market Size & Forecast
- 2.2.2. Electric Commercial Vehicle Market Attractiveness Analysis, By Vehicle Type
- 2.2.3. Electric Commercial Vehicle Market Attractiveness Analysis, By Propulsion Type
- 2.1. Report Scope (Segments And Key Players)
- Chapter 3. Market Dynamics (DRO)
- 3.1. Market Drivers
- 3.1.1. Stringent Emission Regulations & Sustainability Goals
- 3.1.2. Rising Fuel Prices & Energy Security Concerns
- 3.2. Market Restraints
- 3.3. Market Opportunities
- 3.5. Pestle Analysis
- 3.6. Porter Forces Analysis
- 3.7. Technology Roadmap
- 3.8. Value Chain Analysis
- 3.9. Government Policy Impact Analysis
- 3.10. Pricing Analysis
- 3.1. Market Drivers
- Chapter 4. Electric Commercial Vehicle Market – By Vehicle Type
- 4.1. Vehicle Type Market Overview, By Vehicle Type Segment
- 4.1.1. Electric Commercial Vehicle Market Revenue Share, By Vehicle Type, 2025 & 2035
- 4.1.2. Light Commercial Vehicles (LCVs)
- 4.1.3. Electric Commercial Vehicle Share Forecast, By Region (USD Billion)
- 4.1.4. Comparative Revenue Analysis, By Country, 2025 & 2035
- 4.1.5. Key Market Trends, Growth Factors, & Opportunities
- 4.1.6. Heavy Trucks
- 4.1.7. Electric Commercial Vehicle Share Forecast, By Region (USD Billion)
- 4.1.8. Comparative Revenue Analysis, By Country, 2025 & 2035
- 4.1.9. Key Market Trends, Growth Factors, & Opportunities
- 4.1.10. Buses & Coaches
- 4.1.11. Electric Commercial Vehicle Share Forecast, By Region (USD Billion)
- 4.1.12. Comparative Revenue Analysis, By Country, 2025 & 2035
- 4.1.13. Key Market Trends, Growth Factors, & Opportunities
- 4.1. Vehicle Type Market Overview, By Vehicle Type Segment
- Chapter 5. Electric Commercial Vehicle Market – By Propulsion Type
- 5.1. Propulsion Type Market Overview, By Propulsion Type Segment
- 5.1.1. Electric Commercial Vehicle Market Revenue Share, By Propulsion Type, 2025 & 2035
- 5.1.2. Battery Electric Vehicle (BEV)
- 5.1.3. Electric Commercial Vehicle Share Forecast, By Region (USD Billion)
- 5.1.4. Comparative Revenue Analysis, By Country, 2025 & 2035
- 5.1.5. Key Market Trends, Growth Factors, & Opportunities
- 5.1.6. Plug-in Hybrid Electric vehicle (PHEV)
- 5.1.7. Electric Commercial Vehicle Share Forecast, By Region (USD Billion)
- 5.1.8. Comparative Revenue Analysis, By Country, 2025 & 2035
- 5.1.9. Key Market Trends, Growth Factors, & Opportunities
- 5.1.10. Fuel Cell Electric Vehicle (FCEV)
- 5.1.11. Electric Commercial Vehicle Share Forecast, By Region (USD Billion)
- 5.1.12. Comparative Revenue Analysis, By Country, 2025 & 2035
- 5.1.13. Key Market Trends, Growth Factors, & Opportunities
- 5.1. Propulsion Type Market Overview, By Propulsion Type Segment
- Chapter 6. Electric Commercial Vehicle Market – Regional Analysis
- 6.1. Electric Commercial Vehicle Market Overview, By Region Segment
- 6.1.1. Global Electric Commercial Vehicle Market Revenue Share, By Region, 2025 & 2035
- 6.1.2. Global Electric Commercial Vehicle Market Revenue, By Region, 2026 – 2035 (USD Billion)
- 6.1.3. Global Electric Commercial Vehicle Market Revenue, By Vehicle Type, 2026 – 2035
- 6.1.4. Global Electric Commercial Vehicle Market Revenue, By Propulsion Type, 2026 – 2035
- 6.2. North America
- 6.2.1. North America Electric Commercial Vehicle Market Revenue, By Country, 2026 – 2035 (USD Billion)
- 6.2.2. North America Electric Commercial Vehicle Market Revenue, By Vehicle Type, 2026 – 2035
- 6.2.3. North America Electric Commercial Vehicle Market Revenue, By Propulsion Type, 2026 – 2035
- 6.2.4. U.S. Electric Commercial Vehicle Market Revenue, 2026 – 2035 (USD Billion)
- 6.2.5. Canada Electric Commercial Vehicle Market Revenue, 2026 – 2035 (USD Billion)
- 6.2.6. Mexico Electric Commercial Vehicle Market Revenue, 2026 – 2035 (USD Billion)
- 6.2.7. Rest of North America Electric Commercial Vehicle Market Revenue, 2026 – 2035 (USD Billion)
- 6.3. Europe
- 6.3.1. Europe Electric Commercial Vehicle Market Revenue, By Country, 2026 – 2035 (USD Billion)
- 6.3.2. Europe Electric Commercial Vehicle Market Revenue, By Vehicle Type, 2026 – 2035
- 6.3.3. Europe Electric Commercial Vehicle Market Revenue, By Propulsion Type, 2026 – 2035
- 6.3.4. Germany Electric Commercial Vehicle Market Revenue, 2026 – 2035 (USD Billion)
- 6.3.5. France Electric Commercial Vehicle Market Revenue, 2026 – 2035 (USD Billion)
- 6.3.6. U.K. Electric Commercial Vehicle Market Revenue, 2026 – 2035 (USD Billion)
- 6.3.7. Russia Electric Commercial Vehicle Market Revenue, 2026 – 2035 (USD Billion)
- 6.3.8. Italy Electric Commercial Vehicle Market Revenue, 2026 – 2035 (USD Billion)
- 6.3.9. Spain Electric Commercial Vehicle Market Revenue, 2026 – 2035 (USD Billion)
- 6.3.10. Netherlands Electric Commercial Vehicle Market Revenue, 2026 – 2035 (USD Billion)
- 6.3.11. Rest of Europe Electric Commercial Vehicle Market Revenue, 2026 – 2035 (USD Billion)
- 6.4. Asia Pacific
- 6.4.1. Asia Pacific Electric Commercial Vehicle Market Revenue, By Country, 2026 – 2035 (USD Billion)
- 6.4.2. Asia Pacific Electric Commercial Vehicle Market Revenue, By Vehicle Type, 2026 – 2035
- 6.4.3. Asia Pacific Electric Commercial Vehicle Market Revenue, By Propulsion Type, 2026 – 2035
- 6.4.4. China Electric Commercial Vehicle Market Revenue, 2026 – 2035 (USD Billion)
- 6.4.5. Japan Electric Commercial Vehicle Market Revenue, 2026 – 2035 (USD Billion)
- 6.4.6. India Electric Commercial Vehicle Market Revenue, 2026 – 2035 (USD Billion)
- 6.4.7. New Zealand Electric Commercial Vehicle Market Revenue, 2026 – 2035 (USD Billion)
- 6.4.8. Australia Electric Commercial Vehicle Market Revenue, 2026 – 2035 (USD Billion)
- 6.4.9. South Korea Electric Commercial Vehicle Market Revenue, 2026 – 2035 (USD Billion)
- 6.4.10. Taiwan Electric Commercial Vehicle Market Revenue, 2026 – 2035 (USD Billion)
- 6.4.11. Rest of Asia Pacific Electric Commercial Vehicle Market Revenue, 2026 – 2035 (USD Billion)
- 6.5. The Middle-East and Africa
- 6.5.1. The Middle-East and Africa Electric Commercial Vehicle Market Revenue, By Country, 2026 – 2035 (USD Billion)
- 6.5.2. The Middle-East and Africa Electric Commercial Vehicle Market Revenue, By Vehicle Type, 2026 – 2035
- 6.5.3. The Middle-East and Africa Electric Commercial Vehicle Market Revenue, By Propulsion Type, 2026 – 2035
- 6.5.4. Saudi Arabia Electric Commercial Vehicle Market Revenue, 2026 – 2035 (USD Billion)
- 6.5.5. UAE Electric Commercial Vehicle Market Revenue, 2026 – 2035 (USD Billion)
- 6.5.6. Egypt Electric Commercial Vehicle Market Revenue, 2026 – 2035 (USD Billion)
- 6.5.7. Kuwait Electric Commercial Vehicle Market Revenue, 2026 – 2035 (USD Billion)
- 6.5.8. South Africa Electric Commercial Vehicle Market Revenue, 2026 – 2035 (USD Billion)
- 6.5.9. Rest of the Middle East & Africa Electric Commercial Vehicle Market Revenue, 2026 – 2035 (USD Billion)
- 6.6. Latin America
- 6.6.1. Latin America Electric Commercial Vehicle Market Revenue, By Country, 2026 – 2035 (USD Billion)
- 6.6.2. Latin America Electric Commercial Vehicle Market Revenue, By Vehicle Type, 2026 – 2035
- 6.6.3. Latin America Electric Commercial Vehicle Market Revenue, By Propulsion Type, 2026 – 2035
- 6.6.4. Brazil Electric Commercial Vehicle Market Revenue, 2026 – 2035 (USD Billion)
- 6.6.5. Argentina Electric Commercial Vehicle Market Revenue, 2026 – 2035 (USD Billion)
- 6.6.6. Rest of Latin America Electric Commercial Vehicle Market Revenue, 2026 – 2035 (USD Billion)
- 6.1. Electric Commercial Vehicle Market Overview, By Region Segment
- Chapter 7. Competitive Landscape
- 7.1. Company Market Share Analysis – 2025
- 7.1.1. Global Electric Commercial Vehicle Market: Company Market Share, 2025
- 7.2. Global Electric Commercial Vehicle Market Company Market Share, 2024
- 7.1. Company Market Share Analysis – 2025
- Chapter 8. Company Profiles
- 8.1. BYD Auto Co. Ltd.
- 8.1.1. Company Overview
- 8.1.2. Key Executives
- 8.1.3. Product Portfolio
- 8.1.4. Financial Overview
- 8.1.5. Operating Business Segments
- 8.1.6. Business Performance
- 8.1.7. Recent Developments
- 8.2. Daimler Truck AG
- 8.3. AB Volvo
- 8.4. Traton SE
- 8.5. Zhengzhou Yutong Bus Co. Ltd
- 8.6. Ford Motor Company
- 8.7. Tesla Inc.
- 8.8. Proterra Inc.
- 8.9. Rivian Automotive Inc.
- 8.10. Tata Motors Limited
- 8.11. Olectra Greentech Limited
- 8.12. PACCAR Inc.
- 8.13. Nikola Corporation
- 8.14. NFI Group Inc. (New Flyer)
- 8.15. Hyundai Motor Company
- 8.16. Isuzu Motors Limited
- 8.17. Mitsubishi Fuso Truck & Bus Corporation
- 8.18. Others.
- 8.1. BYD Auto Co. Ltd.
- Chapter 9. Research Methodology
- 9.1. Research Methodology
- 9.2. Secondary Research
- 9.3. Primary Research
- 9.3.1. Analyst Tools and Models
- 9.4. Research Limitations
- 9.5. Assumptions
- 9.6. Insights From Primary Respondents
- 9.7. Why Custom Market Insights
- Chapter 10. Standard Report Commercials & Add-Ons
- 10.1. Customization Options
- 10.2. Subscription Module For Market Research Reports
- 10.3. Client Testimonials
List Of Figures
Figures 1 to 20
List Of Tables
Tables 1 to 41
Prominent Players
- BYD Auto Co. Ltd.
- Daimler Truck AG
- AB Volvo
- Traton SE
- Zhengzhou Yutong Bus Co. Ltd
- Ford Motor Company
- Tesla Inc.
- Proterra Inc.
- Rivian Automotive Inc.
- Tata Motors Limited
- Olectra Greentech Limited
- PACCAR Inc.
- Nikola Corporation
- NFI Group Inc. (New Flyer)
- Hyundai Motor Company
- Isuzu Motors Limited
- Mitsubishi Fuso Truck & Bus Corporation
- Others
FAQs
The key players in the market are BYD Auto Co. Ltd., Daimler Truck AG, AB Volvo, Traton SE, Zhengzhou Yutong Bus Co. Ltd., Ford Motor Company, Tesla Inc., Proterra Inc., Rivian Automotive Inc., Tata Motors Limited, Olectra Greentech Limited, PACCAR Inc., Nikola Corporation, NFI Group Inc. (New Flyer), Hyundai Motor Company, Isuzu Motors Limited, Mitsubishi Fuso Truck & Bus Corporation, Others.
Government regulations play a crucial role in shaping market development by enforcing emission norms, offering incentives, and setting electrification targets that accelerate the adoption of electric commercial vehicles.
Price point directly influences market growth and adoption, as lower upfront vehicle costs and total cost of ownership make electric commercial vehicles more accessible to fleet operators, thereby accelerating widespread adoption.
According to the present analysis and forecast modeling, the market of electric commercial vehicles will witness a significant growth of about USD 498 million in the year 2035 with the growing innovative product launch, increasing collaboration, and rising government initiatives with a CAGR of 18.5% between the years 2026 and 2035.
It is projected that the Asia Pacific will hold the largest market share in the electric commercial vehicle market in the forecast period, with a share of about 44% of the global market share, which is attributed to the increasing government initiatives for clean technology.
Europe is expected to grow at the highest rate during the forecast period. The growth in the region is owing to the increasing sustainability goals.
The key factors driving the market are rising fossil fuel prices and demand for logistics.