Flexible Office Market Size, Trends and Insights By Product Type (On Demand, Dedicated Spaces, All Access), By Application (Large Enterprises, Start-up/Freelancers, SMSs), By Industry (IT/ITES, Retail & Consumer, BFSI, Others), and By Region - Global Industry Overview, Statistical Data, Competitive Analysis, Share, Outlook, and Forecast 2026 – 2035
Report Snapshot
| Study Period: | 2026-2035 |
| Fastest Growing Market: | Asia Pacific |
| Largest Market: | North America |
Major Players
- Mindspace Ltd.
- Vast Coworking Group
- BizSpace Ltd.
- Bond Collective
- Others
Reports Description
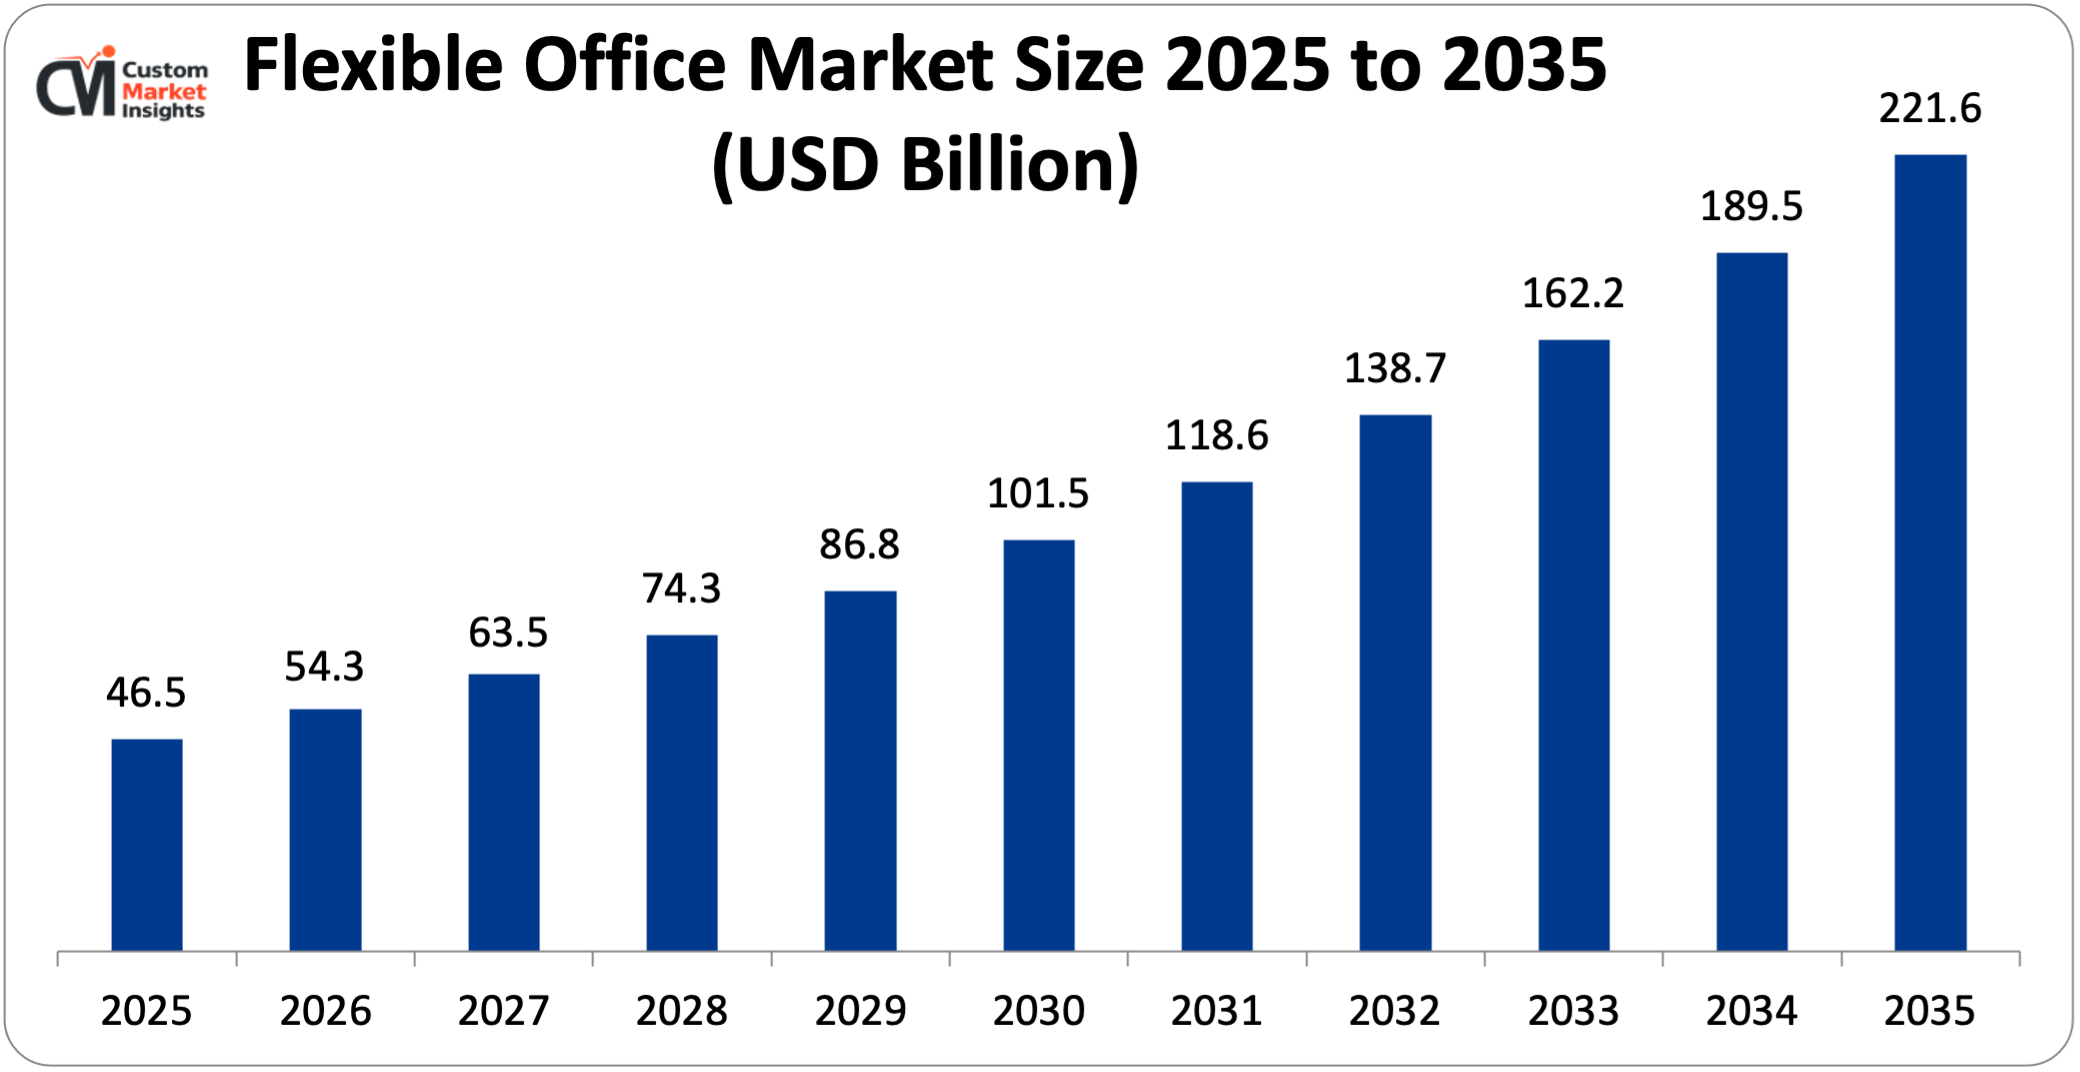
The market size of global flexible office will be estimated at USD 46.5 billion in 2025 and is expected to grow to between USD 54.3 billion in 2026 and about USD 221.6 billion by 2035, with a current CAGR (compound annual growth rate) of 16.9% during the period of 2026 to 2035. A flexible office is an office type at which company tenants lease workspaces for short periods (hours and days or months) rather than long-term contract commitments. Most contemporary flexible offices cater to the fact that companies could be required to expand or downsize their businesses and have flexible workspace capacity.
Flexible offices comprise the whole spectrum of workspace types, including shared working spaces, serviced offices, hot desks, and private offices. These workspaces often include proposed infrastructure such as wireless internet service, meeting rooms, reception, and other administrative facilities. Today more companies utilize flexible office services, as business conditions are continually changing, and companies are trying to adapt to the market through flexible and portable space. Flexible office services are very popular among start-up companies, freelancers, small and medium-sized companies, and larger companies that are trying to save costs.
Market Highlight
- In 2025, North America will dominate the global market with an estimated market share of 32%. The increasing investment in coworking space drives the market growth.
- The Asia Pacific is growing at the highest CAGR over the analysis period. The increasing hybrid and remote work drives the market growth.
- By product type, the dedicated spaces segment dominated the market in 2025 with a revenue share of 48%.
- By application, the SMSs segment captures the largest market share in 2025 of 35%.
- By industry, the IT/ITES segment captures the largest market share in 2025 of over 35%.
Significant Growth Factors
The flexible office market trends present significant growth opportunities due to several factors:
- Rise of Hybrid and Remote Work: The seemingly unstoppable growth of hybrid working and flexible working arrangements has been a major catalyst for the flexible office market, as more and more companies adopt a dispersed working model. Rather than maintaining a significant traditional office presence, corporations can now transition to hybrid working policies that incorporate a mix of working from home, corporate headquarters, and flexible workspaces. Many companies are applying flexible office brands as remote satellite offices so employees are more likely to have a close-to-home professional working environment. This shift allows these companies to increase productivity and quality of life while limiting time wasted in traffic and avoiding overcrowding in CEOs’ offices. There is a strategic dimension to this in real estate planning and development, where corporates are reducing long-term leasing commitments and replacing them with short-term, scalable, flexible office agreements through co-working and serviced office providers so that companies can flex capacity over different locations according to project-specific or workforce demands. Moreover, global firms are providing local modular flex office spaces in every city where they operate to promote distributed teams while providing office amenities without the existence of a permanent dedicated office. This combination of hybrid working policies with large-scale co-working partnerships has effectively brought equal benefits of lower operational costs and greater human capital flexibility, intensifying this market.
- Growth of Startups and Freelancers: The rapid increase of startups and the gig economy workforce is also one of the main drivers of customer demand for flexible and collaborative spaces. As startups operate with limited financial means and unstable growth rates, signing a long-term lease for an office space is generally too risky. Flexible office spaces have a cost effective, built-in full-service infrastructure on a flexible agreement, which gives the possibility for start-ups to upsize or downsize their office with their ever-fluctuating head count and cash flow. This cost-efficient and flexible solution has attracted a large number of early-stage firms, independent workers, and entrepreneurs. This trend can be underpinned even more with evidence that around 54% of freelancers and 33% of startups already use coworking or flexible office space. Additionally, 20% of flexible office users are freelancers or solopreneurs, and 15% are startup teams in the coworking population of over 15,800 individuals in 2019. Moreover, the rise of gig workers supports this trend. For instance, in India, there were 15 million gig workers in 2020, which is expected to reach 23.5 million by 2029–30. This figure bodes well for the flexible office sector, with its cost efficiency and adaptability that would appeal to this growing crowd of skilled freelancers and self-employed professionals.
What are the Major Advances Changing the Flexible Office Market Today?
- Smart Workspace Technologies: Smart workspace technologies being integrated into the workspace are aiding in the evolving flexible office market by enhancing productivity, efficiency, and the work environment and making the experience better for members. Modern flexible offices are implementing smart workspace capabilities such as using IoT-enabled sensors in the space, using AI-based space management systems, mobile-enabled access control, and automated booking of meeting room systems. These capabilities allow workspace operators to track member occupancy and space utilization as well as provide members with mobile access to all the office’s facilities. As the industry grows, smart workspace innovations will be pivotal in providing flexible office operators the ability to offer highly productive and sophisticated digital environments attractive to corporate clients and remote workers. Instant desk booking, digital visitor management, ultra-fast broadband, smart lighting, and environmental controls will be greatly appreciated by company tenants and members in a future of digital data and digital workplace management, and office space will be at a premium.
- Wellness-focused and Sustainable Office Design: Wellness and sustainability in office design have become exciting trends that contribute to growth in the flexible office market. The modern flexible office space is more purposefully designed to enhance the health, satisfaction, and overall well-being of employees through the inclusion of amenities such as exposure to natural light, increased levels of air quality, ergonomic furniture, integrated green areas, and relaxation zones. These wellness-centric flexible office environments can help reduce stress levels and improve employees’ overall well-being, as well as support higher work performance, therefore creating an added attraction for corporate tenants looking for flexible workspace options. Simultaneously, sustainability has gained frequent attention from flexible office tenants and operators alike. Flexible office providers have adopted environmentally friendly building materials and décor, low-energy LED lighting, water efficiency enhancements, and waste diversion initiatives in efforts to reduce the carbon footprint of flexible office spaces. Several flexible office providers are also striving towards attaining green building ratings and executing sustainable workspace initiatives to align with their corporate tenants’ ESG guidelines. As firms are moving towards a sense of well-being for their employees and a responsibility towards preserving the environment, the increased demand for sustainable and wellness-centered flexible office spaces has certainly assisted in the growth of the flexible office market.
Category Wise Insights
By Product Type
Why Dedicated Spaces Hold a Prominent Position in the Market
The dedicated spaces segment dominated the market in 2025 with a revenue share of 48%. The growing adoption of hybrid working and flexible office space demands will be the main factor behind the growth of revenue from dedicated space. Generally, flexible workspace companies purchase dedicated space to serve as supplementary or project-specific office space, getting in more or fewer seats whenever needed without having to sign a long-term lease. In addition, dedicated memberships of flexible workspace operators have more predictable and secure revenue streams than rental fees per desk per day/hour. As cost savings, space flexibility, and employee interchange become vital, demand for dedicated space will ever grow and will be a major driver for flexible office growth.
The on-demand segment is growing at the highest CAGR of 19.5% over the analysis period. As companies and individuals look for more short-term, pay-as-you-work services. On-demand workspace offers users access to individual workstations, conference rooms, or private offices for a few hours or days without any obligation to a long-term membership. The on-demand space concept appeals to solo entrepreneurs, mobile workers, traveling professionals, and small project teams who need temporary access to bricks-and-mortar office infrastructure. Increasing use of mobile booking services and digital access control systems has also contributed to the growth of services.
By Application
Why do SMSs Capture the Highest Market Share in the Flexible Office Market?
The SMSs segment captures the largest market share in 2025 of 35%. The revenue growth from SMEs is mainly led by their demand for flexibility and scaling. The flexible office space is clearly the best option for SMEs to scale their operations, as they are able to increase or decrease the workspace size when necessary without relocating or renegotiating any long-term lease. Moreover, SMEs are attracted by the networking opportunities and collaboration potential of coworking and their access to diverse business communities. Number of start-ups and entrepreneurial ecosystems worldwide is significantly increasing, and the flexible office market will continue to benefit from freelancers and SMEs, supporting the revenue growth.
The large enterprises segment is growing rapidly over the projected period. The large corporates mostly contribute to the growth of the flexible office market, as they are generally compelled to work efficiently, flexibly, and economically with a flexible workforce. This is what flexible office markets offer: they can always expect to increase or decrease their space depending on a new project, change in workforce, or expansion into new locations. In addition, large companies benefit from infrastructure being ready upon arrival, modern equipment, and professional surroundings with conducive environments for teamwork. As hybrid workforces and distributed office networks of enterprises become more prevalent, their demand for flexible offices will grow accordingly.
By Industry
Does IT/ITES Dominate the Flexible Office Market?
The IT/ITES segment captures the largest market share in 2025 of over 35%. The scaling and cost-effectiveness of the IT/ITES sector, coupled with its rapid market expansion, will drive revenue growth. Flexi space provider enables the establishment of a new office in a new city or a technology park, which is not only quick but also economical and less capital-intensive for the organizations. It also helps companies with satellite offices near an employee’s residence, thereby reducing the time and energy consumed during a trip to the office in a hybrid working environment. It is then expected to lead to growth in revenue from the flexi-space industry with the global expansion of the IT services market and the wake of flexible working-office strategies.
The BFSI segment is growing at the highest CAGR over the projected period. The BFSI segment is growing because of its ability to adapt to the modern workplace by offering the double benefit of digital transformation and business continuity. Financial institutions need temporary business offices or workspaces during the expansion of their teams, establishing tie-ups with fintech companies, opening regional offices for serving customers of different states, etc. Flexible offices provide these companies the luxury of expanding to a new workspace just by making an initial heavy capital investment and minimum operational setup costs. The hybrid policies being adopted by banks and insurance companies will result in the need for satellite offices that provide employees with the flexibility of working in this type of space without them compromising on the professionalism of the office environment. As they continue along this path of continuous modernization, the BFSI segment will see growing affinity for flexible office solutions, thus contributing to the growth of the flexible office market.
Report Scope
| Feature of the Report | Details |
| Market Size in 2026 | USD 54.3 billion |
| Projected Market Size in 2035 | USD 221.6 billion |
| Market Size in 2025 | USD 46.5 billion |
| CAGR Growth Rate | 16.9% CAGR |
| Base Year | 2025 |
| Forecast Period | 2026-2035 |
| Key Segment | By Product Type, Application, Industry and Region |
| Report Coverage | Revenue Estimation and Forecast, Company Profile, Competitive Landscape, Growth Factors and Recent Trends |
| Regional Scope | North America, Europe, Asia Pacific, Middle East & Africa, and South & Central America |
| Buying Options | Request tailored purchasing options to fulfil your requirements for research. |
Regional Analysis
How Big is North America Flexible Office Market Size?
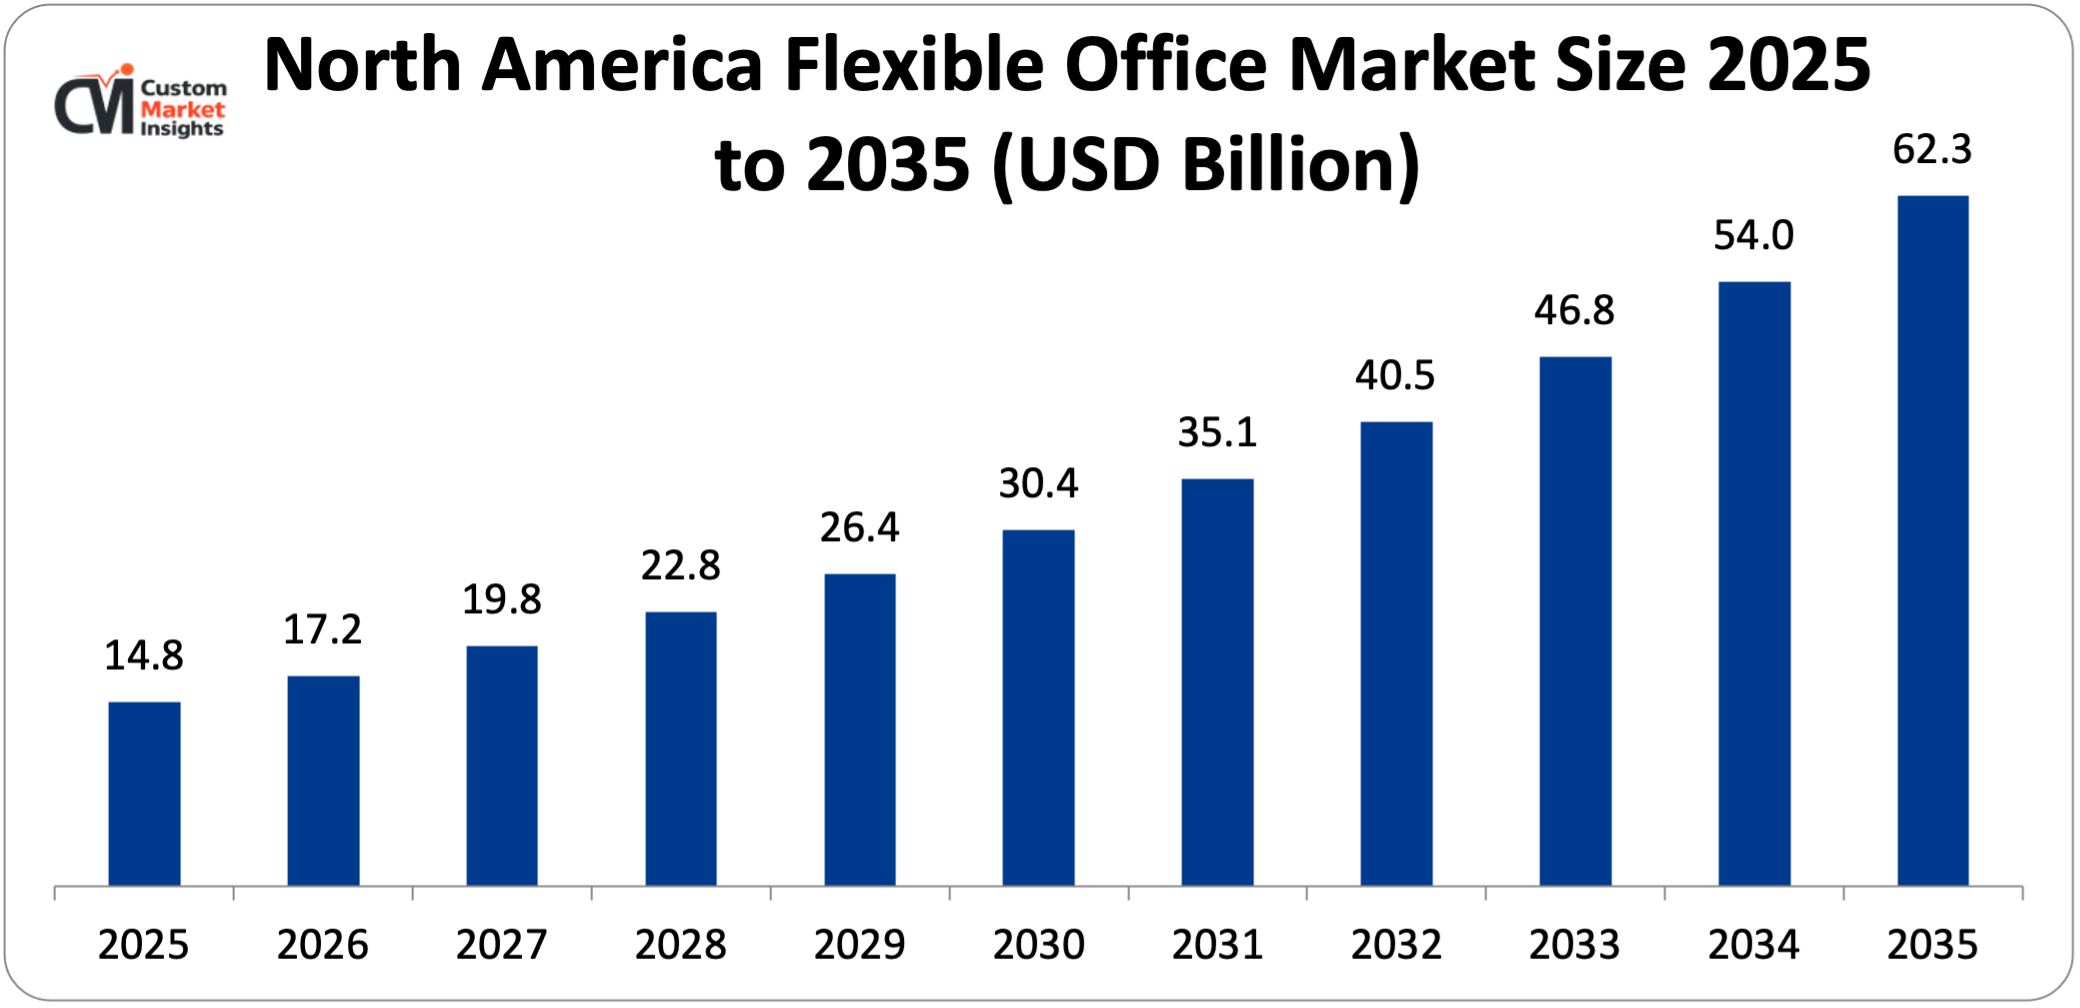
Its market size, in terms of North American flexible office, is projected to be USD 14.8 billion in 2025 with a growth of about USD 62.3 billion in 2035 with a CAGR of 15.4% between 2026 and 2035.
Why did North America Dominate the Flexible Office Market in 2025?
In 2025, North America will dominate the global market with an estimated market share of 32 The growth in revenues for the North American flexible office market reflects high appeal from technology firms, freelancers, and large organizations with distributed work models. Corporations are increasingly using flexible offices as satellite work hubs to enhance remote working and mitigate urban commute difficulty. Moreover, the expanding coworking organizations, adoption of smart workspace processes, and rising number of corporate collaborations with flexible office service providers are also fueling the market growth.
US Flexible Office Market Trends
In the North America region, the US leads the industry expansion over the projected period. The growing use of office arrangements in the United States significantly contributes to market growth. The growth of the market is fueled by the updated working culture of the working population and the increasing number of commercial real estate markets after the pandemic. According to the report by the CBRE Group Inc., which is the United States-based real estate company, the huge flexible market is in the states of Connecticut, Manhattan, San Francisco, and Los Angeles.
The growth of the flex office market was also fueled by the rise in demand for work flexibility by employees in the United States and Canada and the increase in the number of coworking office spaces, which provide several types of office arrangements ranging from co-working to hybrid and flexible arrangements at a low rate, leading to considerable growth. According to the report by the Instant Group, a United Kingdom-based company, the highest growth in the number of centers in the United States has been recorded by the states, such as New York, Texas, and California.
Why is Europe Experiencing Significant Growth in the Flexible Office Market?
Europe holds a significant market share in 2025. The rise in growth is increased due to more and more adoption of hybrid work practices, the growth of the startup ecosystem, and the rising demand from companies for flexible work spaces. Many companies of all European countries are turning away from fixed long-term leases and moving toward flexible workspace arrangements, under which they will be able to increase or decrease office capacity according to their requirements. This can be observed at a greater level in the large business centers, where the firms are interested in affordable and flexible office space but do not want to compromise on modern office infrastructure and collaborative work environments.
UK Flexible Office Market Trends
The UK held the dominant position in the market in 2025. Growing focus on sustainable office design, wellbeing-oriented workplaces, and digital workspace management systems is leading more businesses to opt for flexible office options. With more and more businesses in the UK moving to flexible and hybrid workplace models, flexible office demand will keep increasing in the coming years.
Why is the Asia Pacific Growing at a Rapid Rate in the Flexible Office Market?
The Asia Pacific is expected to grow at the highest CAGR over the projected period. The government supports the growth of the market by promoting flexible workspaces. For instance, in Sydney, the New South Wales government supported the launch of a 17,000-square-meter technology hub located in the central business district of the city to serve as a startup space that offers flexible working spaces for startups. Similarly, the government of Japan has supported the initiative of telework by promoting the day as well as introducing reforms to improve the lives of individuals and improve their productivity.
The rise in the number of flexible office providers in Asian countries such as India, Japan, China, Singapore, and many others is attributed to the boost in the real estate industry after the pandemic to boost market growth. The increase in the number of startups as well as freelancers in Asian countries is attributed to the increased demand for the co-working industry. According to an article by the Times of India, the recognized start-ups in India increased from 471 in 2016 to 72,993 in 2022.
India Flexible Office Market Trends
India is growing at a significant rate in the market. This can be attributed to the fast-growing startup community, widespread adoption of hybrid work, and increased need for cost-effective workspace among businesses and organizations, leading to several companies moving away from the traditional long-term office leasing to flexible workspaces so as to downsize or upscale according to workforce needs. The metro cities like Bangalore, Mumbai, Delhi-NCR and Hyderabad together have turned out to be the largest markets for such flexible workspaces.
Why is the Middle East & Africa Region is growing rapidly in the Flexible Office?
The MEA region is growing at a steady rate over the projected period. This growth can be explained by the flexible business environment, the historic explosion in the number of startup communities, and a change in attitude of today‘s worker, wanting to work differently. Countries like the United Arab Emirates, South Africa, and Saudi Arabia are experiencing an immense increase in the requirement for serviced offices and colocation centers. These centers would save immense capital expenditure by having the facility available for rent with all the setting up already done.
UAE Flexible Office Market Trends
The UAE is growing at the highest CAGR during the forecast period. The increasing investment in working space is the main factor driving the market growth.
Top Players in the Flexible Office Market and Their Offerings
- Mindspace Ltd.
- Vast Coworking Group
- BizSpace Ltd.
- Bond Collective
- CBRE Group Inc.
- Hub Australia Pty Ltd
- Incuspaze Solutions Pvt Ltd.
- Industrious
- International Workplace Group PLC
- Ally Spaces
- Premier Office Centers LLC
- Serendipity Labs
- Servcorp Ltd.
- Techspace Group Ltd.
- The Office Group
- United Franchise Group
- Awfis Space Solutions Ltd.
- WeWork Inc.
- Workbar
- Others
Key Developments
Flexible office market has experienced considerable changes in the last two years as the market players are trying to diversify their technological aspects and develop product portfolios using strategic approaches.
- In October 2025, The Portman Estate today unveiled Portman WorkWell, a new-to-market premium flex office offer, with the launch of 29 Gloucester Place, the first in a network of fully inclusive, design-led workspaces across the 110-acre Estate in London’s West End. Portman WorkWell responds directly to the shift in workplace culture, where demand for agility, shorter leases, and turnkey accommodation has transformed the West End into a hub for creative studios, hybrid-ready environments, and future-facing businesses. With fully fitted offices, dedicated meeting rooms, and ESG-led occupier amenities, Portman WorkWell meets the evolving expectations of SMEs and founder-led firms. (https://portmanestate.co.uk/launching-portman-workwell-a-new-standard-of-premium-flex-offices-for-marylebone/)
- In November 2025, IWG accelerates Egypt expansion, planning 30 new flexible workspace centers in 2026. The company has also expanded beyond Greater Cairo, opening new centers in Alexandria, the North Coast, and New Alamein, with plans to enter Upper Egypt soon, including Aswan and Luxor. (https://www.dailynewsegypt.com/2025/11/09/iwg-accelerates-egypt-expansion-plans-30-new-flexible-workspace-centres-in-2026/)
These strategic measures have enabled the companies to reinforce their competitive positions, increase the product line, boost their technological competencies, and also seize growth opportunities in the fast-growing Flexible Office market.
The Flexible Office Market is segmented as follows:
By Product Type
- On Demand
- Dedicated Spaces
- All Access
By Application
- Large Enterprises
- Start-up/Freelancers
- SMSs
By Industry
- IT/ITES
- Retail & Consumer
- BFSI
- Others
Regional Coverage:
North America
- U.S.
- Canada
- Mexico
- Rest of North America
Europe
- Germany
- France
- U.K.
- Russia
- Italy
- Spain
- Netherlands
- Rest of Europe
Asia Pacific
- China
- Japan
- India
- New Zealand
- Australia
- South Korea
- Taiwan
- Rest of Asia Pacific
The Middle East & Africa
- Saudi Arabia
- UAE
- Egypt
- Kuwait
- South Africa
- Rest of the Middle East & Africa
Latin America
- Brazil
- Argentina
- Rest of Latin America
Table of Contents
- Chapter 1. Report Introduction
- 1.1. Report Description
- 1.1.1. Purpose of the Report
- 1.1.2. USP & Key Offerings
- 1.2. Key Benefits For Stakeholders
- 1.3. Target Audience
- 1.4. Report Scope
- 1.1. Report Description
- Chapter 2. Market Overview
- 2.1. Report Scope (Segments And Key Players)
- 2.1.1. Flexible Office by Segments
- 2.1.2. Flexible Office by Region
- 2.2. Executive Summary
- 2.2.1. Market Size & Forecast
- 2.2.2. Flexible Office Market Attractiveness Analysis, By Product Type
- 2.2.3. Flexible Office Market Attractiveness Analysis, By Application
- 2.2.4. Flexible Office Market Attractiveness Analysis, By Industry
- 2.1. Report Scope (Segments And Key Players)
- Chapter 3. Market Dynamics (DRO)
- 3.1. Market Drivers
- 3.1.1. Rise of Hybrid and Remote Work
- 3.1.2. Growth of Startups and Freelancers
- 3.2. Market Restraints
- 3.3. Market Opportunities
- 3.5. Pestle Analysis
- 3.6. Porter Forces Analysis
- 3.7. Technology Roadmap
- 3.8. Value Chain Analysis
- 3.9. Government Policy Impact Analysis
- 3.10. Pricing Analysis
- 3.1. Market Drivers
- Chapter 4. Flexible Office Market – By Product Type
- 4.1. Product Type Market Overview, By Product Type Segment
- 4.1.1. Flexible Office Market Revenue Share, By Product Type, 2025 & 2035
- 4.1.2. On Demand
- 4.1.3. Flexible Office Share Forecast, By Region (USD Billion)
- 4.1.4. Comparative Revenue Analysis, By Country, 2025 & 2035
- 4.1.5. Key Market Trends, Growth Factors, & Opportunities
- 4.1.6. Dedicated Spaces
- 4.1.7. Flexible Office Share Forecast, By Region (USD Billion)
- 4.1.8. Comparative Revenue Analysis, By Country, 2025 & 2035
- 4.1.9. Key Market Trends, Growth Factors, & Opportunities
- 4.1.10. All Access
- 4.1.11. Flexible Office Share Forecast, By Region (USD Billion)
- 4.1.12. Comparative Revenue Analysis, By Country, 2025 & 2035
- 4.1.13. Key Market Trends, Growth Factors, & Opportunities
- 4.1. Product Type Market Overview, By Product Type Segment
- Chapter 5. Flexible Office Market – By Application
- 5.1. Application Market Overview, By Application Segment
- 5.1.1. Flexible Office Market Revenue Share, By Application, 2025 & 2035
- 5.1.2. Large Enterprises
- 5.1.3. Flexible Office Share Forecast, By Region (USD Billion)
- 5.1.4. Comparative Revenue Analysis, By Country, 2025 & 2035
- 5.1.5. Key Market Trends, Growth Factors, & Opportunities
- 5.1.6. Start-up/Freelancers
- 5.1.7. Flexible Office Share Forecast, By Region (USD Billion)
- 5.1.8. Comparative Revenue Analysis, By Country, 2025 & 2035
- 5.1.9. Key Market Trends, Growth Factors, & Opportunities
- 5.1.10. SMSs
- 5.1.11. Flexible Office Share Forecast, By Region (USD Billion)
- 5.1.12. Comparative Revenue Analysis, By Country, 2025 & 2035
- 5.1.13. Key Market Trends, Growth Factors, & Opportunities
- 5.1. Application Market Overview, By Application Segment
- Chapter 6. Flexible Office Market – By Industry
- 6.1. Industry Market Overview, By Industry Segment
- 6.1.1. Flexible Office Market Revenue Share, By Industry, 2025 & 2035
- 6.1.2. IT/ITES
- 6.1.3. Flexible Office Share Forecast, By Region (USD Billion)
- 6.1.4. Comparative Revenue Analysis, By Country, 2025 & 2035
- 6.1.5. Key Market Trends, Growth Factors, & Opportunities
- 6.1.6. Retail & Consumer
- 6.1.7. Flexible Office Share Forecast, By Region (USD Billion)
- 6.1.8. Comparative Revenue Analysis, By Country, 2025 & 2035
- 6.1.9. Key Market Trends, Growth Factors, & Opportunities
- 6.1.10. BFSI
- 6.1.11. Flexible Office Share Forecast, By Region (USD Billion)
- 6.1.12. Comparative Revenue Analysis, By Country, 2025 & 2035
- 6.1.13. Key Market Trends, Growth Factors, & Opportunities
- 6.1.14. Others
- 6.1.15. Flexible Office Share Forecast, By Region (USD Billion)
- 6.1.16. Comparative Revenue Analysis, By Country, 2025 & 2035
- 6.1.17. Key Market Trends, Growth Factors, & Opportunities
- 6.1. Industry Market Overview, By Industry Segment
- Chapter 7. Flexible Office Market – Regional Analysis
- 7.1. Flexible Office Market Overview, By Region Segment
- 7.1.1. Global Flexible Office Market Revenue Share, By Region, 2025 & 2035
- 7.1.2. Global Flexible Office Market Revenue, By Region, 2026 – 2035 (USD Billion)
- 7.1.3. Global Flexible Office Market Revenue, By Product Type, 2026 – 2035
- 7.1.4. Global Flexible Office Market Revenue, By Application, 2026 – 2035
- 7.1.5. Global Flexible Office Market Revenue, By Industry, 2026 – 2035
- 7.2. North America
- 7.2.1. North America Flexible Office Market Revenue, By Country, 2026 – 2035 (USD Billion)
- 7.2.2. North America Flexible Office Market Revenue, By Product Type, 2026 – 2035
- 7.2.3. North America Flexible Office Market Revenue, By Application, 2026 – 2035
- 7.2.4. North America Flexible Office Market Revenue, By Industry, 2026 – 2035
- 7.2.5. U.S. Flexible Office Market Revenue, 2026 – 2035 (USD Billion)
- 7.2.6. Canada Flexible Office Market Revenue, 2026 – 2035 (USD Billion)
- 7.2.7. Mexico Flexible Office Market Revenue, 2026 – 2035 (USD Billion)
- 7.2.8. Rest of North America Flexible Office Market Revenue, 2026 – 2035 (USD Billion)
- 7.3. Europe
- 7.3.1. Europe Flexible Office Market Revenue, By Country, 2026 – 2035 (USD Billion)
- 7.3.2. Europe Flexible Office Market Revenue, By Product Type, 2026 – 2035
- 7.3.3. Europe Flexible Office Market Revenue, By Application, 2026 – 2035
- 7.3.4. Europe Flexible Office Market Revenue, By Industry, 2026 – 2035
- 7.3.5. Germany Flexible Office Market Revenue, 2026 – 2035 (USD Billion)
- 7.3.6. France Flexible Office Market Revenue, 2026 – 2035 (USD Billion)
- 7.3.7. U.K. Flexible Office Market Revenue, 2026 – 2035 (USD Billion)
- 7.3.8. Russia Flexible Office Market Revenue, 2026 – 2035 (USD Billion)
- 7.3.9. Italy Flexible Office Market Revenue, 2026 – 2035 (USD Billion)
- 7.3.10. Spain Flexible Office Market Revenue, 2026 – 2035 (USD Billion)
- 7.3.11. Netherlands Flexible Office Market Revenue, 2026 – 2035 (USD Billion)
- 7.3.12. Rest of Europe Flexible Office Market Revenue, 2026 – 2035 (USD Billion)
- 7.4. Asia Pacific
- 7.4.1. Asia Pacific Flexible Office Market Revenue, By Country, 2026 – 2035 (USD Billion)
- 7.4.2. Asia Pacific Flexible Office Market Revenue, By Product Type, 2026 – 2035
- 7.4.3. Asia Pacific Flexible Office Market Revenue, By Application, 2026 – 2035
- 7.4.4. Asia Pacific Flexible Office Market Revenue, By Industry, 2026 – 2035
- 7.4.5. China Flexible Office Market Revenue, 2026 – 2035 (USD Billion)
- 7.4.6. Japan Flexible Office Market Revenue, 2026 – 2035 (USD Billion)
- 7.4.7. India Flexible Office Market Revenue, 2026 – 2035 (USD Billion)
- 7.4.8. New Zealand Flexible Office Market Revenue, 2026 – 2035 (USD Billion)
- 7.4.9. Australia Flexible Office Market Revenue, 2026 – 2035 (USD Billion)
- 7.4.10. South Korea Flexible Office Market Revenue, 2026 – 2035 (USD Billion)
- 7.4.11. Taiwan Flexible Office Market Revenue, 2026 – 2035 (USD Billion)
- 7.4.12. Rest of Asia Pacific Flexible Office Market Revenue, 2026 – 2035 (USD Billion)
- 7.5. The Middle-East and Africa
- 7.5.1. The Middle-East and Africa Flexible Office Market Revenue, By Country, 2026 – 2035 (USD Billion)
- 7.5.2. The Middle-East and Africa Flexible Office Market Revenue, By Product Type, 2026 – 2035
- 7.5.3. The Middle-East and Africa Flexible Office Market Revenue, By Application, 2026 – 2035
- 7.5.4. The Middle-East and Africa Flexible Office Market Revenue, By Industry, 2026 – 2035
- 7.5.5. Saudi Arabia Flexible Office Market Revenue, 2026 – 2035 (USD Billion)
- 7.5.6. UAE Flexible Office Market Revenue, 2026 – 2035 (USD Billion)
- 7.5.7. Egypt Flexible Office Market Revenue, 2026 – 2035 (USD Billion)
- 7.5.8. Kuwait Flexible Office Market Revenue, 2026 – 2035 (USD Billion)
- 7.5.9. South Africa Flexible Office Market Revenue, 2026 – 2035 (USD Billion)
- 7.5.10. Rest of the Middle East & Africa Flexible Office Market Revenue, 2026 – 2035 (USD Billion)
- 7.6. Latin America
- 7.6.1. Latin America Flexible Office Market Revenue, By Country, 2026 – 2035 (USD Billion)
- 7.6.2. Latin America Flexible Office Market Revenue, By Product Type, 2026 – 2035
- 7.6.3. Latin America Flexible Office Market Revenue, By Application, 2026 – 2035
- 7.6.4. Latin America Flexible Office Market Revenue, By Industry, 2026 – 2035
- 7.6.5. Brazil Flexible Office Market Revenue, 2026 – 2035 (USD Billion)
- 7.6.6. Argentina Flexible Office Market Revenue, 2026 – 2035 (USD Billion)
- 7.6.7. Rest of Latin America Flexible Office Market Revenue, 2026 – 2035 (USD Billion)
- 7.1. Flexible Office Market Overview, By Region Segment
- Chapter 8. Competitive Landscape
- 8.1. Company Market Share Analysis – 2025
- 8.1.1. Global Flexible Office Market: Company Market Share, 2025
- 8.2. Global Flexible Office Market Company Market Share, 2024
- 8.1. Company Market Share Analysis – 2025
- Chapter 9. Company Profiles
- 9.1. Mindspace Ltd.
- 9.1.1. Company Overview
- 9.1.2. Key Executives
- 9.1.3. Product Portfolio
- 9.1.4. Financial Overview
- 9.1.5. Operating Business Segments
- 9.1.6. Business Performance
- 9.1.7. Recent Developments
- 9.2. Vast Coworking Group
- 9.3. BizSpace Ltd.
- 9.4. Bond Collective
- 9.5. CBRE Group Inc.
- 9.6. Hub Australia Pty Ltd
- 9.7. Incuspaze Solutions Pvt Ltd.
- 9.8. Industrious
- 9.9. International Workplace Group PLC
- 9.10. Ally Spaces
- 9.11. Premier Office Centers LLC
- 9.12. Serendipity Labs
- 9.13. Servcorp Ltd.
- 9.14. Techspace Group Ltd.
- 9.15. The Office Group
- 9.16. United Franchise Group
- 9.17. Awfis Space Solutions Ltd.
- 9.18. WeWork Inc.
- 9.19. Workbar
- 9.20. Others.
- 9.1. Mindspace Ltd.
- Chapter 10. Research Methodology
- 10.1. Research Methodology
- 10.2. Secondary Research
- 10.3. Primary Research
- 10.3.1. Analyst Tools and Models
- 10.4. Research Limitations
- 10.5. Assumptions
- 10.6. Insights From Primary Respondents
- 10.7. Why Healthcare Foresights
- Chapter 11. Standard Report Commercials & Add-Ons
- 11.1. Customization Options
- 11.2. Subscription Module For Market Research Reports
- 11.3. Client Testimonials
- Chapter 12. List Of Figures
- 12.1. Figures No 1 to 26
- Chapter 13. List Of Tables
- 13.1. Tables No 1 to 46
Prominent Player
- Mindspace Ltd.
- Vast Coworking Group
- BizSpace Ltd.
- Bond Collective
- CBRE Group Inc.
- Hub Australia Pty Ltd
- Incuspaze Solutions Pvt Ltd.
- Industrious
- International Workplace Group PLC
- Ally Spaces
- Premier Office Centers LLC
- Serendipity Labs
- Servcorp Ltd.
- Techspace Group Ltd.
- The Office Group
- United Franchise Group
- Awfis Space Solutions Ltd.
- WeWork Inc.
- Workbar
- Others
FAQs
The key players in the market are Mindspace Ltd., Vast Coworking Group, BizSpace Ltd., Bond Collective, CBRE Group Inc., Hub Australia Pty Ltd., Incuspaze Solutions Pvt Ltd., Industrious, International Workplace Group PLC, Ally Spaces, Premier Office Centers LLC, Serendipity Labs, Servcorp Ltd., Techspace Group Ltd., The Office Group, United Franchise Group, Awfis Space Solutions Ltd., WeWork Inc., Workbar, Others.
The regulations affect the activity of the global economy in general, as well as the commercial activity and the working environment in particular, and the development of the flexible office market. The regulations related to the commercial real estate letting, the planning policies of the authorities regarding the utilization of the land, and the requirements related to the safety of the buildings have an effect on how the flexible office operators plan and operate their facilities. Conversely, the rules related to remote working and the employment laws reflect an acknowledgment of the range of flexible working practices that are available and may lead to growth through higher demand. They may also drive growth by promoting the third area of interest, that of small firms, which can benefit from flexible office spaces and contribute to the overall demand for such facilities.
Price is a key factor that will promote and encourage the flexible office market by helping to make flexible workspaces more affordable. For instance, most of the startup companies, freelancers, and SMEs are much more willing to choose the flexible office environment than the traditional office leasing due to the lower investment. Furthermore, the flexible options, such as pay-per-desk, hourly booking, or short-term membership subscriptions, are suitable for small firms to enjoy a flexible space with a relatively small investment. As flexible office providers are also having tiered price policies based upon different space types and different services, more firms will turn to the flexible office market.
According to the present analysis and forecast modeling, the market of flexible office will witness a significant growth of about USD 221.6 billion in the year 2035 with the growing innovative product launch, increasing collaboration, rising prevalence of remote and hybrid work, and emergence of smart workspaces with a CAGR of 16.9% between the years 2026 and 2035.
It is projected that North America will hold the largest market share in the flexible office market in the forecast period, with a share of about 32% of the global market share, which is attributed to the region’s growing investment in flexible office.
The Asia Pacific is expected to grow at the highest CAGR during the forecast period. The growth in the region is owing to the increasing remote and hybrid work.
The expansion of the flexible office sector is primarily the result of the trend towards flexible working, where a growing number of businesses adopt hybrid and remote work practices in favor of longer-term office leases. Additionally, the influx of entrepreneurial activity by start-ups, entrepreneurs, and small businesses is also supporting the expansion of the flexible office sector.