Lactic Acid and Polylactic Acid PLA Market Size, Trends and Insights By Type (Lactic Acid, Polylactic Acid PLA), By Lactic Acid Grade (Food Grade, Industrial Grade, Pharmaceutical Grade), By PLA Type (Regular PLA (PLLA-dominant), Racemic PLA (PDLA blends / Stereocomplex PLA), PLA Copolymers (PLGA, PLA-PEG, and Others), Other PLA Types), By Application (Food & Beverages, Packaging (Rigid and Flexible), Biomedical & Pharmaceutical, Agriculture (Mulch Films, Controlled-Release Fertilizer Coatings), Textiles & Fibers, Consumer Goods & Electronics, Other Applications), By End-Use (Food Processing Industry, Packaging Industry, Healthcare & Pharmaceutical Manufacturers, Agricultural End-Users, Consumer Goods Manufacturers, Others), and By Region - Global Industry Overview, Statistical Data, Competitive Analysis, Share, Outlook, and Forecast 2026 – 2035
Report Snapshot
| Study Period: | 2026-2035 |
| Fastest Growing Market: | Asia Pacific |
| Largest Market: | Asia Pacific |
Major Players
- NatureWorks LLC
- TOTALENERGIES Corbion BV
- Corbion NV
- Galactic SA (Biopharma Group)
- Others
Reports Description
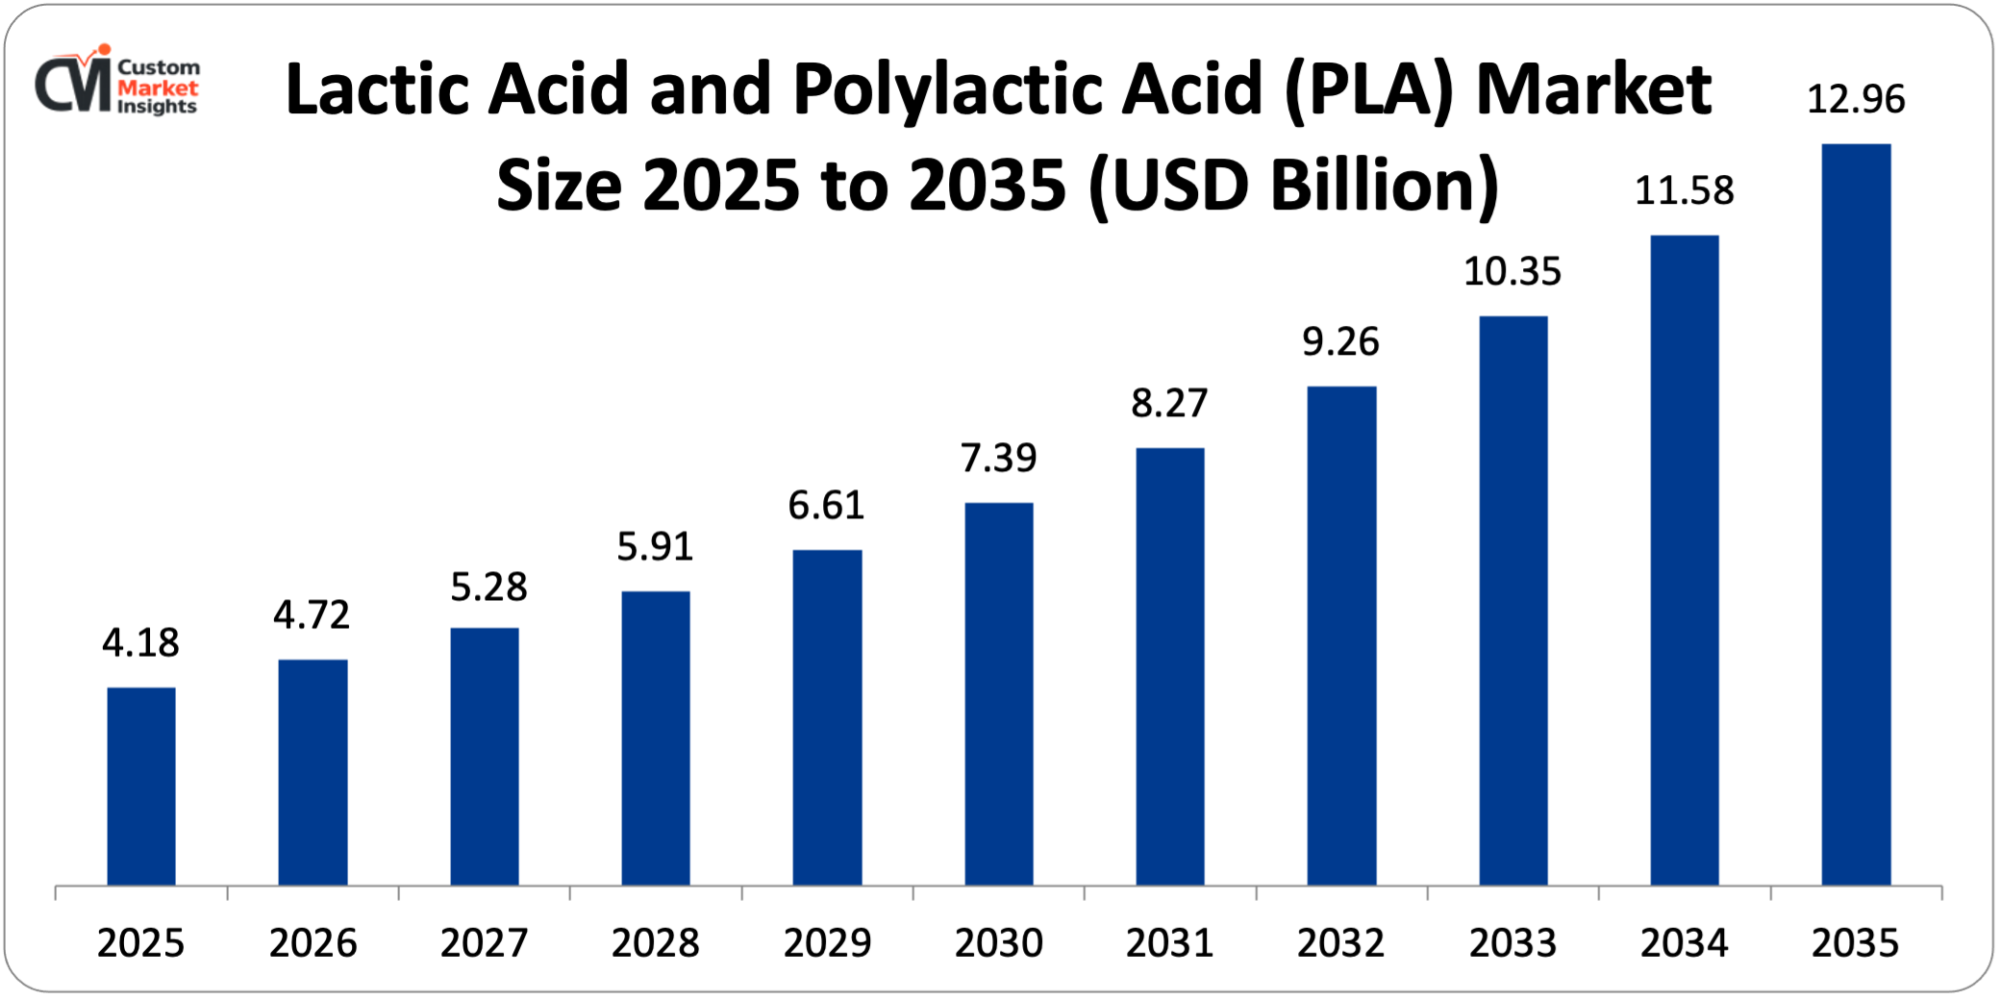
The market size of lactic acid and polylactic acid PLA is estimated as USD 4.18 billion in 2025, and is projected to grow at a CAGR of 11.9% between 2026 and 2035, ensuring a market size of USD 4.72 billion in 2026, and USD 12.96 billion in 2035. All these factors are expected to produce a strong growth of the market over the forecast period due to the accelerating global move towards bioplastics and sustainable packaging led by the strict government regulations on the use of single use plastics, increasing consumer demand and corporate demand on environmentally responsible materials, increased use of lactic acid in the fields of food preservation and pharmaceutical production, and constant further development of fermentation technology and the processing of PLA.
Market Highlight
- The market share of lactic acid and polylactic acid was 41% in Asia Pacific in 2025.
- The North American growth is forecasted to be 10.8% between 2026 and 2035.
- By type, the lactic acid segment is estimated to be at 58% market share in 2025.
- And typewise, the polylactic acid part is increasing at the highest CAGR of 14.2% between 2026 and 2035.
- By application, the food and beverages segment had the highest market share of 34% in 2025, and the packaging application segment will have the highest CAGR of 16.8% in the proposed period between 2026 and 2035.
- The food grade segment has secured 52% of the market share.
- In 2024, the breadth of bio-based chemicals and bioplastics market share was largely central to the bio-based value chain, with 36.4% dominated by lactic acid and PLA, finishing the transition to green chemistry.
Significant Growth Factors
The Lactic Acid and Polylactic Acid PLA Market Trends present significant growth opportunities due to several factors:
- Escalating Global Regulatory Pressure Against Conventional Plastics and Surge in Bioplastics Demand:
The legislative- regulatory assault on traditional petroleum-based single-use plastics occurring all over the world is the greatest structural force in the lactic acid and PLA market, since it is forcing brand owners, retailers, packaging converters, and food service operators to urgently find commercially viable solutions that are biodegradable, of which PLA is the most developed, scalable, and economically competitive alternative currently available. One of the most important regulatory interventions in the history of the plastics industry is the Single-Use Plastics Directive of the European Union that outlawed a broad category of single-use plastic items in all 27 member states beginning in July 2021 and requiring all plastic packaging to be recyclable or compostable by 2030. PLA, which is the second-largest volume bioplastic, has a production capacity of about 19% of all global bioplastics production capacity, according to the European Bioplastics Association, and has a projected capacity of increasing to exceed 0.85 million metric tons by 2028 as brand owners hasten materials shifts to PLA.
China, the largest producer of plastic waste, estimated to generate 63 million tons per year by the World Bank, unveiled its landmark Plastic Pollution Action Plan in 2020, requiring a phased ban on non-degradable single-use plastics in the large cities and tourist centers of the country – a giant local stimulus to the domestic demand of PLA and lactic acid as Chinese manufacturers of packaging shift to compliant materials. The Plastic Waste Management Amendment Rules of 2022 in India prohibited single-use plastics in the country, which covered 1.4 billion consumers and offered one of the largest transition opportunities globally to bioplastic alternatives. By 2024, the global bioplastics market had reached USD 13.6 billion and is expected to grow to USD 42.7 billion by 2033 at a CAGR of 13.5%, with the largest portion of biodegradable bioplastics being dominated by PLA due to its commercial scalability, well-established performance properties, and competitive cost environment increasing in relation to fossil-based plastics.
- Expanding Food & Beverage Applications and Clean Label Consumer Trends:
The multifunctional nature of lactic acid as an acidulant, preservative, flavor enhancer, pH regulator, and antimicrobial agent in the food and beverage sector, combined with the secular growth trend in clean label food formulation, natural preservation, and minimally processed food products, makes Lactic acid an essential ingredient. In 2024, the world food preservative market has a minimum value of USD 3.28 billion, and by 2030, it is anticipated to rise to USD 4.79 billion with a CAGR of 6.5%, where natural and fermented-derived preservatives are taking a growing market share as consumers and government agencies around the world continue to revise the use of synthetic preservatives.
Lactic acid is FDA GRAS (Generally Recognized as Safe) and has equal regulatory acceptance in the EU, Japan, and other key international markets, which gives the regulatory confidence that food manufacturing firms need when investing in formulation. It is used in exceptionally wide range of food categories, such as meat and poultry processing (where lactic acid sprays help reduce surface microbial contaminations, with the efficacy of pathogen reduction of some 2-4 log cycles reported in USDA research); dairy products such as yogurt, cheese, and fermented milk beverages, where lactic acid gives characteristic tartness; and beverages such as functional drinks, craft beers, and kombucha. where lactic acid helps regulate acidity and mouthfeel, and bakery products where it extends shelf life.
The 2024 Food & Health Survey by the International Food Information Council has shown the same trend, showing that 73% of U.S. consumers actively notice foods with simple and recognizable ingredient lists, a consumer trend that explicitly favors naturally fermented lactic acid over chemical acidulants. Foundational market: One of the root markets in which lactic acid is not just an additive but the stalwart biochemical product of fermentation, generating profound structural demand connections, is the global fermented food and beverage market, projected to reach USD 780 billion in 2024 and growing with a 5.9% CAGR.
What are the Major Advances Changing the Lactic Acid and Polylactic Acid PLA Market Today?
- Advanced Fermentation Technology and Second-Generation Feedstock Utilization:
The multifunctional nature of lactic acid as an acidulant, preservative, flavor enhancer, pH regulator, and antimicrobial agent in the food and beverage sector, combined with the secular growth trend in clean label food formulation, natural preservation, and minimally processed food products, makes Lactic acid an essential ingredient. In 2024, the world food preservative market has a minimum value of USD 3.28 billion, and by 2030, it is anticipated to rise to USD 4.79 billion with a CAGR of 6.5%, where natural and fermented-derived preservatives are taking a growing market share as consumers and government agencies around the world continue to revise the use of synthetic preservatives. Lactic acid is FDA GRAS (Generally Recognized as Safe) and has equal regulatory acceptance in the EU, Japan, and other key international markets, which gives the regulatory confidence that food manufacturing firms need when investing in formulation.
It is used in exceptionally wide range of food categories, such as meat and poultry processing (where lactic acid sprays help reduce surface microbial contaminations, with the efficacy of pathogen reduction of some 2-4 log cycles reported in USDA research), dairy products such as yogurt, cheese, and fermented milk beverages where lactic acid gives characteristic tartness, beverages such as functional drinks, craft beers, and kombucha. where lactic acid helps regulate acidity and mouthfeel, bakery products where it extends shelf life. The 2024 Food & Health Survey by the International Food Information Council has shown the same trend, showing that 73% of U.S. consumers actively notice foods with simple and recognizable ingredient lists, a consumer trend that explicitly favors naturally fermented lactic acid over chemical acidulants. Foundational market: One of the root markets in which lactic acid is not just an additive but the stalwart biochemical product of fermentation, generating profound structural demand connections, is the global fermented food and beverage market, projected to reach USD 780 billion in 2024 and growing with a 5.9% CAGR.
- Stereocomplex PLA and Advanced PLA Formulation for High-Performance Applications:
Another of the most technically important contributions to material science in the PLA arena, enabling a step-change in thermal and mechanical performance allowing a dramatic expansion of the range of applications of PLA beyond ambient temperature package work into industrial, automotive, and high-performance consumer product markets, is the development of stereocomplex polylactic acid (sc-PLA) – which is made by composing poly(L-lactic acid) (PLLA) and poly(D-lactic acid) (PDLA) in equal ratios. The Tg of conventional PLA is about 55-60°C, and the melting temperature is 170-180°C, which constrains its application in processes that demand heat resistance beyond 50-55O C under load – something that used to preclude the use of PLA in hot-fill beverage containers, microwavable-capable food packaging, and engineering thermoplastic process use. By comparison, a melting point of about 220-230°C is obtained with Stereocomplex PLA. significantly higher crystallization rates, and under-load heat deflection temperatures approaching 180°C—similar to engineering thermoplastics such as polycarbonate and ABS – and is still able to maintain the biodegradability and bio-based carbon content distinguishing PLA amongst petroleum-based analogs.
The Luminy sc-PLA product range of TOTALENERGies Corbion, and the high-performance Ingeo formulations of NatureWorks in applications requiring heat resistance are the most commercial examples of this technology direction. The market analysis shows that the heat-resistant PLA formulations attract a price premium of 25-40% over the conventional PLA grades and touch 30 segments of application representing an estimated USD 800 million incremental market opportunity in 2030. Also, property optimization is being facilitated in select applications such as flexible packaging (which generally needs to elongate upon break greater than 200% versus 5-8% with unmodified PLA), compostable agricultural films and impact-resistant rigid containers by PLA blending technologies a mix of PLA with polyhydroxyalkanoates (PHA), thermoplastic starch, and mineral fillers.
Category Wise Insights
By Type
Why Does Lactic Acid Lead the Market?
Over the long term in 2025, lactic acid will be the greater of the two key segments, as it is expected to constitute about 58% of the total market share in revenue terms because of its wide multi-industry usage base in the food and beverage manufacturing industry, the pharmaceutical production industry, personal care formulation, industrial cleaning, and the production of polylactic acid as the primary upstream feedstock. By 2024, the world capacity of lactic acid production was estimated to be about 1.5 million metric tons annually with the market being dominated by just a few large fermentation manufacturers with world-scale production plants. Asia Pacific – most of the worldwide lactic acid manufacturing capacity is located in China and Thailand; the manufacturers in China manufacture this product through facilities such as Henan Jindan Lactic Acid Technology, BBCA Group and Shandong Parkson, which provide over 600,000 metric tons/y of production capacity.
Micromolecular Lactic acid is industrially obtained in two optically pure enantiomeric forms L-lactic acid (the biologically predominant form synthesized by most food-grade fermentation organisms) and D-lactic acid (produced by certain bacterial strains and necessary to form stereocomplexes of PLA), with L-lactic acid comprising about 85% of the total production volume. With the food and beverage industry being a primary importer of lactic acid used as a food additive (E270 in EU nomenclature), the PLA production industry is the fastest-growing demand category, estimated at about 28% of the total consumption in 2025 and increasing quickly as PLA production capacities are expanded and lactic acid is used as a raw material in upstream applications. In high-purity grades of above 99.5% optical purity, pharmaceutical uses absorb about 10% of the production and are priced heavily above food-grade material at USD 2.50 to USD 5.00/kg.
By Application
Why Do Food & Beverages Dominate Lactic Acid and PLA Applications?
The largest combined market share is food and beverage applications, which will have approximately 34% of total market share in 2025, due to the widespread use of lactic acid as a food ingredient as a food preservative (preservation), food acidification (acidification), and food flavoring (flavorings) at the same time as PLA switches to fresh produce and prepared foods fresh packaging applications in the form of cups, trays, clamshell containers, and films. The GRAS status and natural source of lactic acid are such that it is the characteristic metabolite of bacterial fermentation in traditional fermented foods such as yogurt, cheese, fermented vegetables (sauerkraut and kimchi), and fermented dairy products (kefir and sourdough bread), and it is unrivaled by competing acidulants in food applications. The U.S. meat processing sector alone is estimated to use an average of 40,000-50,000 metric tons of lactic acid each year in antimicrobial treatment configurations and the mandatory pathogen reduction performance norms of beef, pork, and poultry processing by the USDA Food Safety and Inspection Service are seen to result in the widespread use of lactic acid-based carcass and trim interventions. The organic food market, which is estimated at USD 205 billion in 2024 and with a 12% CAGR, provides the global organic trade with a premium demand of naturally fermented lactic acid as a clean label acidulant and preservative in organic certified products where synthetic preservatives are banned (Organic Trade Association). Food packaging PLA has increased at a very high rate due to the major retailers such as Walmart, Target and European grocery chains, making commitments to certified compostable or recyclable packaging targets and the volume of PLA packaging penetration is greatest in the fresh produce, deli, and prepared food categories.
By Lactic Acid Grade
Why Does Food Grade Dominate the Market?
Food-grade lactic acid is the highest grade segment with the greatest market share of about 52% in the year 2025 taking the place of multi-industry applications of lactic acid in food manufacturing and personal care formulation, as well as PLA production used in food-contact applications and where food-grade material certification is a prerequisite. Food grade lactic acid specifications are usually that the optical purity exceeds 99%, residual sugars is less than 0.2%, and that the heavy metals (lead, arsenic, mercury) are within parts-per-billion limits, and there is an absence of microbiological contamination – standards that can be met through known fermentation and downstream purification processes at large producers.
Food-grade segment will expand to USD 2.89 billion in 2035 compared to USD 1.24 billion in 2025 at a CAGR of 8.8. Although the pharmaceutical-grade lactic acid takes the least volume share of about 10% of production, it has the highest price at USD 4.50USD 8.00/kg of injectable-quality material that is of pharmacopeial quality and meets USP, EP and JP specifications, with its small volume share contributing disproportionately to the overall revenue of manufacturers who have the right manufacturing capacity. The production volume of industrial grade lactic acid, used in two distinct manners, as a descaling agent, green solvent precursor (ethyl lactate), and as an intermediary in polymer chemistry applications other than PLA, is about 38% of production volume with a price range of USD 0.80-USD 1.40 per kilogram.
Report Scope
| Feature of the Report | Details |
| Market Size in 2026 | USD 4.72 billion |
| Projected Market Size in 2035 | USD 12.96 billion |
| Market Size in 2025 | USD 4.18 billion |
| CAGR Growth Rate | 11.9% CAGR |
| Base Year | 2025 |
| Forecast Period | 2026-2035 |
| Key Segment | By Type, Lactic Acid Grade, PLA Type, Application, End-Use and Region |
| Report Coverage | Revenue Estimation and Forecast, Company Profile, Competitive Landscape, Growth Factors and Recent Trends |
| Regional Scope | North America, Europe, Asia Pacific, Middle East & Africa, and South & Central America |
| Buying Options | Request tailored purchasing options to fulfil your requirements for research. |
Regional Analysis
How Big is the Asia Pacific Market Size?
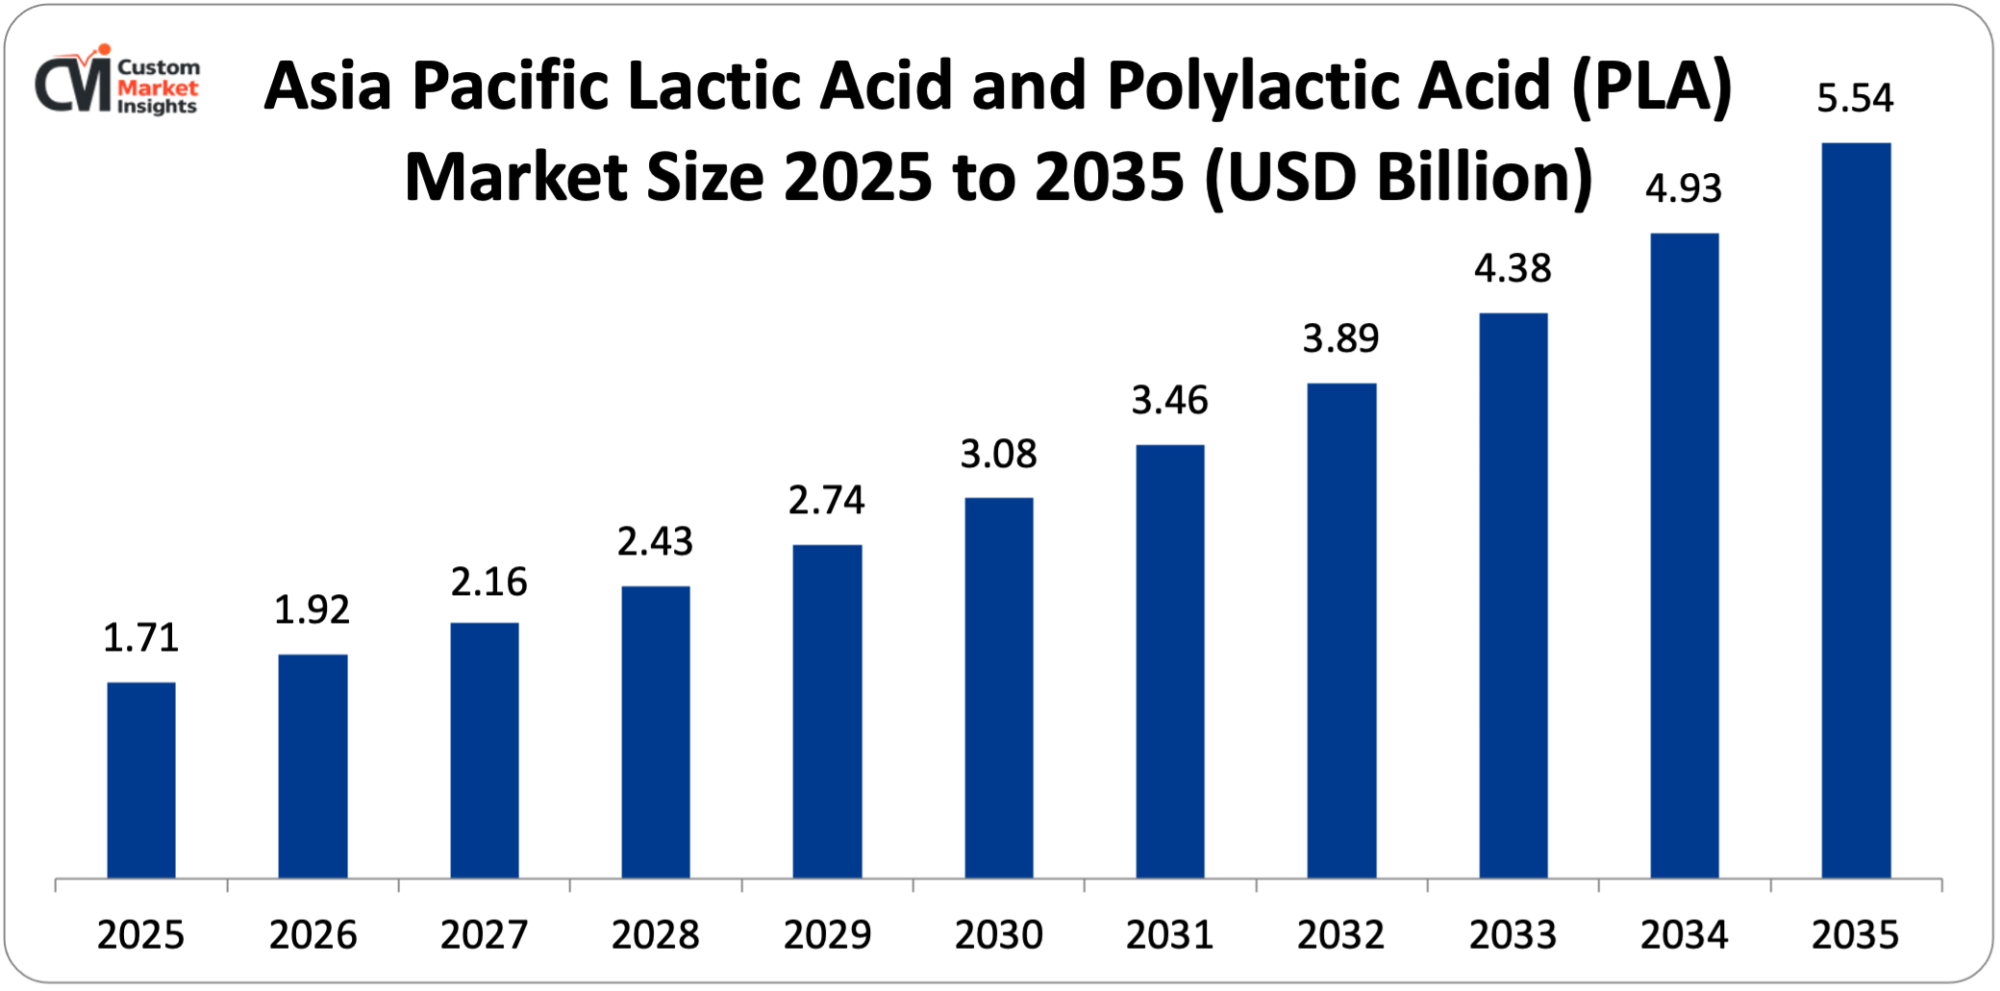
The Asia Pacific lactic acid and PLA market size is estimated at USD 1.71 billion in 2025 and is projected to reach approximately USD 5.54 billion by 2035, with a 12.4% CAGR from 2026 to 2035.
Why Did Asia Pacific Dominate the Market in 2025?
The market share of 2025 in Asia Pacific is about 41%, which indicates that the region is primarily the largest production hub of lactic acid in the world, the establishment of single-use plastic controls in leading Asian economies is creating a strong demand of single-use plastics, and the large food processing industry in the region is the largest consumer of food-grade lactic acid worldwide. China has an estimated 400,000-450,000 metric tons per year lactic acid production capacity, that is estimated to make up about 30% of the total global installed capacity, with manufacturers of lactic acid in fermentation including Henan Jindan (100,000 metric tons per year), BBCA Biochemical (80,000 metric tons per year) and Shandong Parkson among the largest manufacturers of lactic acid in the world. The TOTALENERGies Corbion plant in Thailand is capitalizing on the availability of domestically sourced sucrose derived by fermentation of sugarcane as an economical fermentation feedstock, which is also adding to the development of the nation as an export hub of PLA. Japan has a highly developed domestic high-performance PLA business such as the PLA-based fibers and films, Teijin Limited and Unitika Corporation have large production facilities on PLA fiber production, which is used by the technically-demanding textile and automotive industries of Japan.
China Market Trends
The largest lactic acid market in the Asia Pacific is China, which has a strong supply of lactic acid due to the fact that it is the largest producer and exporter of lactic acid globally, has a rapidly developing domestic PLA consumption due to the government-driven Plastic Pollution Action Plan, has the largest food processing industry in the world, which consumes a large volume of lactic acid as a food additive, and has actively invested in bio-based chemical manufacturing as highlighted by the 14 th five-year plan with its focus on green and circular economy development. The domestic PLA manufacturing capability within China has also expanded at a very sophisticated rate in the last five years with firms such as Zhejiang Hisun Biomaterials, Anhui COFCO Biochemical and Ronghu Technology ordering new PLA polymerization plants. Notwithstanding such growth in capacity, China is still a net importer of high performance grades of PLA produced by NatureWorks such as high performance packaging grade and biomedical grade as the quality of products and grade breadth of domestic manufacturers is still maturing.
Why is North America Experiencing Strong Growth?
NatureWorks LLC is dominating the world market as the largest producer of PLA, the United States has a large food processing sector that consumes large volumes of lactic acid and United States has strong growth rates with a CAGR of 10.8% between 2026-2035, and biomedical device manufacturing to drive the demand of pharmaceutical/medical-grade lactic acid and PLA copolymer, is driving strong growth in North America with a strong growth rate of 10.8% between 2026-2035. The most important aspect of the technology is the leader of PLA technology and market development in the world, NatureWorks, which is a joint venture between Cargill and PTT Global Chemical based in Minnetonka, Minnesota, and whose Ingeo brand of PLA resins has been specified by the world’s major consumer goods companies (Danone, Pepsico, and Unilever) to use in packaging applications.
What is the Size of the U.S. Market?
The market size of U.S. lactic acid and PLA is projected to grow to USD 726 million in 2025 and USD 1.94 million in 2035, with a CAGR of 10.3 between 2026 and 2035.
U.S. Market Trends
The U.S. market is influenced by an advanced downstream customer base in food manufacturing, pharmaceutical manufacturing and packaging, matched with home-market technological dominance of NatureWorks in PLA. The strictest U.S. state regulation on plastics is California SB 54 that requires all single-use plastic packaging sold in California to be recyclable or compostable by 2032; this is likely to serve as a de facto national standard because California, with its USD 3.7 trillion economy, has historically been a trendsetter in plastic regulation. One of the strongest consumers of pharmaceutical-grade lactic acid and PLGA as controlled drug release system, biodegradable orthopedic implants, and tissue engineering scaffolds is the U.S. biomedical industry, where the largest medical device industry is based, with approximately USD 200 billion in market value.
Why is Europe Emphasizing Circular Bioeconomy and Regulatory Compliance?
The European and PLA environment is marked by the most developed regulatory framework of sustainable packaging and bioplastics, which generates the most challenging compliance situation and the most commercialized source of demand of certified compostable and bio-based materials. The Packaging and Packaging Waste Regulation (PPWR), Single-Use Plastics Directive, and the Farm to Fork Strategy represent a complete policy framework that will require the decarbonization of the packaging value chain in a short time, and PLA is one of the main solutions that can be offered as an option to comply with the rules. One company, Corbion NV, based in Amsterdam, Netherlands manufactures one of the largest production lines of lactic acid and lactide and has its own fully integrated lactic acid-to-PLA production chain as part of its TOTALENERGIES Corbion joint venture. Three largest European national markets include Germany, France and Netherlands, where the advanced food processing, chemical, and packaging industries can be considered as the highest volume of lactic acid consumption in the region.
Why is the Middle East & Africa Region Emerging as a Growth Market?
The nascent but rapidly developing market in the LAMEA region is traced back to the South African legislation on plastic pollution: the South African government The National Environmental Management: Waste Amendment Act is increasingly limiting the conventional plastic packaging, the developing food processing markets in the GCC countries are producing food imports to be replaced by local production under Saudi Arabia and UAE food security policies, and the existing biorefinery of sugarcane biomass infrastructure in Brazil is making the country a future low-cost producer of lactic acid and PLA using the available bio-based feedstock. The infrastructure of ethanol and sucrose production in Brazil is on the world scale, and coupled with a high culture of bio-based chemical production where the success of bio-based ethylene production is made using sugarcane as its raw material, it makes Brazil an important potential supplier of large scale lactic acid fermentation in the future.
Top Players in the Market and Their Offerings
- NatureWorks LLC
- TOTALENERGIES Corbion BV
- Corbion NV
- Galactic SA (Biopharma Group)
- Henan Jindan Lactic Acid Technology Co. Ltd.
- BBCA Group (Anhui BBCA Biochemical)
- Musashino Chemical Laboratory Ltd.
- Futerro SA
- Uhde Inventa-Fischer GmbH (thyssenkrupp)
- Synbra Technology BV
- Teijin Limited
- Others
Key Developments
The market has seen a lot of development, with its players in the industry aiming to increase their production capacity, increasing their application portfolio and taking advantage of the increasing regulatory and consumer driven demand of bio-based and biodegradable materials.
- In October 2023: NatureWorks LLC declared that it would build its second world-scale Ingeo PLA plant in Nakhon Sawan, Thailand a joint venture with PTT Public Company Limited with an initial capacity of 75,000 metric tons of PLA resin per year.
- In March 2025: Galactic SA and Futerro SA declared a collaboration development accord to hasten the commercialization of chemical recycling technology of post-consumer PLA, with the initial commercial-scale operation of PLA-to-lactide chemical recycling in Belgium planned in 2027.
These strategic moves have seen companies gain a stronger position in markets, increase the scale of production, solve the critical end-of-life infrastructure gap facing PLA and take advantage of the massive and rapidly growing demand potential presented by global regulatory and consumer conversion to sustainable bio-based materials.
The Lactic Acid and Polylactic Acid PLA Market is segmented as follows:
By Type
- Lactic Acid
- Polylactic Acid PLA
By Lactic Acid Grade
- Food Grade
- Industrial Grade
- Pharmaceutical Grade
By PLA Type
- Regular PLA (PLLA-dominant)
- Racemic PLA (PDLA blends / Stereocomplex PLA)
- PLA Copolymers (PLGA, PLA-PEG, and Others)
- Other PLA Types
By Application
- Food & Beverages
- Packaging (Rigid and Flexible)
- Biomedical & Pharmaceutical
- Agriculture (Mulch Films, Controlled-Release Fertilizer Coatings)
- Textiles & Fibers
- Consumer Goods & Electronics
- Other Applications
By End-Use
- Food Processing Industry
- Packaging Industry
- Healthcare & Pharmaceutical Manufacturers
- Agricultural End-Users
- Consumer Goods Manufacturers
- Others
Regional Coverage:
North America
- U.S.
- Canada
- Mexico
- Rest of North America
Europe
- Germany
- France
- U.K.
- Russia
- Italy
- Spain
- Netherlands
- Rest of Europe
Asia Pacific
- China
- Japan
- India
- New Zealand
- Australia
- South Korea
- Taiwan
- Rest of Asia Pacific
The Middle East & Africa
- Saudi Arabia
- UAE
- Egypt
- Kuwait
- South Africa
- Rest of the Middle East & Africa
Latin America
- Brazil
- Argentina
- Rest of Latin America
Table of Contents
- Chapter 1. Report Introduction
- 1.1. Report Description
- 1.1.1. Purpose of the Report
- 1.1.2. USP & Key Offerings
- 1.2. Key Benefits For Stakeholders
- 1.3. Target Audience
- 1.4. Report Scope
- 1.1. Report Description
- Chapter 2. Market Overview
- 2.1. Report Scope (Segments And Key Players)
- 2.1.1. Lactic Acid and Polylactic Acid PLA by Segments
- 2.1.2. Lactic Acid and Polylactic Acid PLA by Region
- 2.2. Executive Summary
- 2.2.1. Market Size & Forecast
- 2.2.2. Lactic Acid and Polylactic Acid PLA Market Attractiveness Analysis, By Type
- 2.2.3. Lactic Acid and Polylactic Acid PLA Market Attractiveness Analysis, By Lactic Acid Grade
- 2.2.4. Lactic Acid and Polylactic Acid PLA Market Attractiveness Analysis, By PLA Type
- 2.2.5. Lactic Acid and Polylactic Acid PLA Market Attractiveness Analysis, By Application
- 2.2.6. Lactic Acid and Polylactic Acid PLA Market Attractiveness Analysis, By End-Use
- 2.1. Report Scope (Segments And Key Players)
- Chapter 3. Market Dynamics (DRO)
- 3.1. Market Drivers
- 3.1.1. Escalating Global Regulatory Pressure Against Conventional Plastics and Surge in Bioplastics Demand
- 3.1.2. Expanding Food & Beverage Applications and Clean Label Consumer Trends
- 3.2. Market Restraints
- 3.3. Market Opportunities
- 3.5. Pestle Analysis
- 3.6. Porter Forces Analysis
- 3.7. Technology Roadmap
- 3.8. Value Chain Analysis
- 3.9. Government Policy Impact Analysis
- 3.10. Pricing Analysis
- 3.1. Market Drivers
- Chapter 4. Lactic Acid and Polylactic Acid PLA Market – By Type
- 4.1. Type Market Overview, By Type Segment
- 4.1.1. Lactic Acid and Polylactic Acid PLA Market Revenue Share, By Type, 2025 & 2035
- 4.1.2. Lactic Acid
- 4.1.3. Lactic Acid and Polylactic Acid PLA Share Forecast, By Region (USD Billion)
- 4.1.4. Comparative Revenue Analysis, By Country, 2025 & 2035
- 4.1.5. Key Market Trends, Growth Factors, & Opportunities
- 4.1.6. Polylactic Acid PLA
- 4.1.7. Lactic Acid and Polylactic Acid PLA Share Forecast, By Region (USD Billion)
- 4.1.8. Comparative Revenue Analysis, By Country, 2025 & 2035
- 4.1.9. Key Market Trends, Growth Factors, & Opportunities
- 4.1. Type Market Overview, By Type Segment
- Chapter 5. Lactic Acid and Polylactic Acid PLA Market – By Lactic Acid Grade
- 5.1. Lactic Acid Grade Market Overview, By Lactic Acid Grade Segment
- 5.1.1. Lactic Acid and Polylactic Acid PLA Market Revenue Share, By Lactic Acid Grade, 2025 & 2035
- 5.1.2. Food Grade
- 5.1.3. Lactic Acid and Polylactic Acid PLA Share Forecast, By Region (USD Billion)
- 5.1.4. Comparative Revenue Analysis, By Country, 2025 & 2035
- 5.1.5. Key Market Trends, Growth Factors, & Opportunities
- 5.1.6. Industrial Grade
- 5.1.7. Lactic Acid and Polylactic Acid PLA Share Forecast, By Region (USD Billion)
- 5.1.8. Comparative Revenue Analysis, By Country, 2025 & 2035
- 5.1.9. Key Market Trends, Growth Factors, & Opportunities
- 5.1.10. Pharmaceutical Grade
- 5.1.11. Lactic Acid and Polylactic Acid PLA Share Forecast, By Region (USD Billion)
- 5.1.12. Comparative Revenue Analysis, By Country, 2025 & 2035
- 5.1.13. Key Market Trends, Growth Factors, & Opportunities
- 5.1. Lactic Acid Grade Market Overview, By Lactic Acid Grade Segment
- Chapter 6. Lactic Acid and Polylactic Acid PLA Market – By PLA Type
- 6.1. PLA Type Market Overview, By PLA Type Segment
- 6.1.1. Lactic Acid and Polylactic Acid PLA Market Revenue Share, By PLA Type, 2025 & 2035
- 6.1.2. Regular PLA (PLLA-dominant)
- 6.1.3. Lactic Acid and Polylactic Acid PLA Share Forecast, By Region (USD Billion)
- 6.1.4. Comparative Revenue Analysis, By Country, 2025 & 2035
- 6.1.5. Key Market Trends, Growth Factors, & Opportunities
- 6.1.6. Racemic PLA (PDLA blends / Stereocomplex PLA)
- 6.1.7. Lactic Acid and Polylactic Acid PLA Share Forecast, By Region (USD Billion)
- 6.1.8. Comparative Revenue Analysis, By Country, 2025 & 2035
- 6.1.9. Key Market Trends, Growth Factors, & Opportunities
- 6.1.10. PLA Copolymers (PLGA, PLA-PEG, and Others)
- 6.1.11. Lactic Acid and Polylactic Acid PLA Share Forecast, By Region (USD Billion)
- 6.1.12. Comparative Revenue Analysis, By Country, 2025 & 2035
- 6.1.13. Key Market Trends, Growth Factors, & Opportunities
- 6.1.14. Other PLA Types
- 6.1.15. Lactic Acid and Polylactic Acid PLA Share Forecast, By Region (USD Billion)
- 6.1.16. Comparative Revenue Analysis, By Country, 2025 & 2035
- 6.1.17. Key Market Trends, Growth Factors, & Opportunities
- 6.1. PLA Type Market Overview, By PLA Type Segment
- Chapter 7. Lactic Acid and Polylactic Acid PLA Market – By Application
- 7.1. Application Market Overview, By Application Segment
- 7.1.1. Lactic Acid and Polylactic Acid PLA Market Revenue Share, By Application, 2025 & 2035
- 7.1.2. Food & Beverages
- 7.1.3. Lactic Acid and Polylactic Acid PLA Share Forecast, By Region (USD Billion)
- 7.1.4. Comparative Revenue Analysis, By Country, 2025 & 2035
- 7.1.5. Key Market Trends, Growth Factors, & Opportunities
- 7.1.6. Packaging (Rigid and Flexible)
- 7.1.7. Lactic Acid and Polylactic Acid PLA Share Forecast, By Region (USD Billion)
- 7.1.8. Comparative Revenue Analysis, By Country, 2025 & 2035
- 7.1.9. Key Market Trends, Growth Factors, & Opportunities
- 7.1.10. Biomedical & Pharmaceutical
- 7.1.11. Lactic Acid and Polylactic Acid PLA Share Forecast, By Region (USD Billion)
- 7.1.12. Comparative Revenue Analysis, By Country, 2025 & 2035
- 7.1.13. Key Market Trends, Growth Factors, & Opportunities
- 7.1.14. Agriculture (Mulch Films, Controlled-Release Fertilizer Coatings)
- 7.1.15. Lactic Acid and Polylactic Acid PLA Share Forecast, By Region (USD Billion)
- 7.1.16. Comparative Revenue Analysis, By Country, 2025 & 2035
- 7.1.17. Key Market Trends, Growth Factors, & Opportunities
- 7.1.18. Textiles & Fibers
- 7.1.19. Lactic Acid and Polylactic Acid PLA Share Forecast, By Region (USD Billion)
- 7.1.20. Comparative Revenue Analysis, By Country, 2025 & 2035
- 7.1.21. Key Market Trends, Growth Factors, & Opportunities
- 7.1.22. Consumer Goods & Electronics
- 7.1.23. Lactic Acid and Polylactic Acid PLA Share Forecast, By Region (USD Billion)
- 7.1.24. Comparative Revenue Analysis, By Country, 2025 & 2035
- 7.1.25. Key Market Trends, Growth Factors, & Opportunities
- 7.1.26. Other Applications
- 7.1.27. Lactic Acid and Polylactic Acid PLA Share Forecast, By Region (USD Billion)
- 7.1.28. Comparative Revenue Analysis, By Country, 2025 & 2035
- 7.1.29. Key Market Trends, Growth Factors, & Opportunities
- 7.1. Application Market Overview, By Application Segment
- Chapter 8. Lactic Acid and Polylactic Acid PLA Market – By End-Use
- 8.1. End-Use Market Overview, By End-Use Segment
- 8.1.1. Lactic Acid and Polylactic Acid PLA Market Revenue Share, By End-Use, 2025 & 2035
- 8.1.2. Food Processing Industry
- 8.1.3. Lactic Acid and Polylactic Acid PLA Share Forecast, By Region (USD Billion)
- 8.1.4. Comparative Revenue Analysis, By Country, 2025 & 2035
- 8.1.5. Key Market Trends, Growth Factors, & Opportunities
- 8.1.6. Packaging Industry
- 8.1.7. Lactic Acid and Polylactic Acid PLA Share Forecast, By Region (USD Billion)
- 8.1.8. Comparative Revenue Analysis, By Country, 2025 & 2035
- 8.1.9. Key Market Trends, Growth Factors, & Opportunities
- 8.1.10. Healthcare & Pharmaceutical Manufacturers
- 8.1.11. Lactic Acid and Polylactic Acid PLA Share Forecast, By Region (USD Billion)
- 8.1.12. Comparative Revenue Analysis, By Country, 2025 & 2035
- 8.1.13. Key Market Trends, Growth Factors, & Opportunities
- 8.1.14. Agricultural End-Users
- 8.1.15. Lactic Acid and Polylactic Acid PLA Share Forecast, By Region (USD Billion)
- 8.1.16. Comparative Revenue Analysis, By Country, 2025 & 2035
- 8.1.17. Key Market Trends, Growth Factors, & Opportunities
- 8.1.18. Consumer Goods Manufacturers
- 8.1.19. Lactic Acid and Polylactic Acid PLA Share Forecast, By Region (USD Billion)
- 8.1.20. Comparative Revenue Analysis, By Country, 2025 & 2035
- 8.1.21. Key Market Trends, Growth Factors, & Opportunities
- 8.1.22. Others
- 8.1.23. Lactic Acid and Polylactic Acid PLA Share Forecast, By Region (USD Billion)
- 8.1.24. Comparative Revenue Analysis, By Country, 2025 & 2035
- 8.1.25. Key Market Trends, Growth Factors, & Opportunities
- 8.1. End-Use Market Overview, By End-Use Segment
- Chapter 9. Lactic Acid and Polylactic Acid PLA Market – Regional Analysis
- 9.1. Lactic Acid and Polylactic Acid PLA Market Overview, By Region Segment
- 9.1.1. Global Lactic Acid and Polylactic Acid PLA Market Revenue Share, By Region, 2025 & 2035
- 9.1.2. Global Lactic Acid and Polylactic Acid PLA Market Revenue, By Region, 2026 – 2035 (USD Billion)
- 9.1.3. Global Lactic Acid and Polylactic Acid PLA Market Revenue, By Type, 2026 – 2035
- 9.1.4. Global Lactic Acid and Polylactic Acid PLA Market Revenue, By Lactic Acid Grade, 2026 – 2035
- 9.1.5. Global Lactic Acid and Polylactic Acid PLA Market Revenue, By PLA Type, 2026 – 2035
- 9.1.6. Global Lactic Acid and Polylactic Acid PLA Market Revenue, By Application, 2026 – 2035
- 9.1.7. Global Lactic Acid and Polylactic Acid PLA Market Revenue, By End-Use, 2026 – 2035
- 9.2. North America
- 9.2.1. North America Lactic Acid and Polylactic Acid PLA Market Revenue, By Country, 2026 – 2035 (USD Billion)
- 9.2.2. North America Lactic Acid and Polylactic Acid PLA Market Revenue, By Type, 2026 – 2035
- 9.2.3. North America Lactic Acid and Polylactic Acid PLA Market Revenue, By Lactic Acid Grade, 2026 – 2035
- 9.2.4. North America Lactic Acid and Polylactic Acid PLA Market Revenue, By PLA Type, 2026 – 2035
- 9.2.5. North America Lactic Acid and Polylactic Acid PLA Market Revenue, By Application, 2026 – 2035
- 9.2.6. North America Lactic Acid and Polylactic Acid PLA Market Revenue, By End-Use, 2026 – 2035
- 9.2.7. U.S. Lactic Acid and Polylactic Acid PLA Market Revenue, 2026 – 2035 (USD Billion)
- 9.2.8. Canada Lactic Acid and Polylactic Acid PLA Market Revenue, 2026 – 2035 (USD Billion)
- 9.2.9. Mexico Lactic Acid and Polylactic Acid PLA Market Revenue, 2026 – 2035 (USD Billion)
- 9.2.10. Rest of North America Lactic Acid and Polylactic Acid PLA Market Revenue, 2026 – 2035 (USD Billion)
- 9.3. Europe
- 9.3.1. Europe Lactic Acid and Polylactic Acid PLA Market Revenue, By Country, 2026 – 2035 (USD Billion)
- 9.3.2. Europe Lactic Acid and Polylactic Acid PLA Market Revenue, By Type, 2026 – 2035
- 9.3.3. Europe Lactic Acid and Polylactic Acid PLA Market Revenue, By Lactic Acid Grade, 2026 – 2035
- 9.3.4. Europe Lactic Acid and Polylactic Acid PLA Market Revenue, By PLA Type, 2026 – 2035
- 9.3.5. Europe Lactic Acid and Polylactic Acid PLA Market Revenue, By Application, 2026 – 2035
- 9.3.6. Europe Lactic Acid and Polylactic Acid PLA Market Revenue, By End-Use, 2026 – 2035
- 9.3.7. Germany Lactic Acid and Polylactic Acid PLA Market Revenue, 2026 – 2035 (USD Billion)
- 9.3.8. France Lactic Acid and Polylactic Acid PLA Market Revenue, 2026 – 2035 (USD Billion)
- 9.3.9. U.K. Lactic Acid and Polylactic Acid PLA Market Revenue, 2026 – 2035 (USD Billion)
- 9.3.10. Russia Lactic Acid and Polylactic Acid PLA Market Revenue, 2026 – 2035 (USD Billion)
- 9.3.11. Italy Lactic Acid and Polylactic Acid PLA Market Revenue, 2026 – 2035 (USD Billion)
- 9.3.12. Spain Lactic Acid and Polylactic Acid PLA Market Revenue, 2026 – 2035 (USD Billion)
- 9.3.13. Netherlands Lactic Acid and Polylactic Acid PLA Market Revenue, 2026 – 2035 (USD Billion)
- 9.3.14. Rest of Europe Lactic Acid and Polylactic Acid PLA Market Revenue, 2026 – 2035 (USD Billion)
- 9.4. Asia Pacific
- 9.4.1. Asia Pacific Lactic Acid and Polylactic Acid PLA Market Revenue, By Country, 2026 – 2035 (USD Billion)
- 9.4.2. Asia Pacific Lactic Acid and Polylactic Acid PLA Market Revenue, By Type, 2026 – 2035
- 9.4.3. Asia Pacific Lactic Acid and Polylactic Acid PLA Market Revenue, By Lactic Acid Grade, 2026 – 2035
- 9.4.4. Asia Pacific Lactic Acid and Polylactic Acid PLA Market Revenue, By PLA Type, 2026 – 2035
- 9.4.5. Asia Pacific Lactic Acid and Polylactic Acid PLA Market Revenue, By Application, 2026 – 2035
- 9.4.6. Asia Pacific Lactic Acid and Polylactic Acid PLA Market Revenue, By End-Use, 2026 – 2035
- 9.4.7. China Lactic Acid and Polylactic Acid PLA Market Revenue, 2026 – 2035 (USD Billion)
- 9.4.8. Japan Lactic Acid and Polylactic Acid PLA Market Revenue, 2026 – 2035 (USD Billion)
- 9.4.9. India Lactic Acid and Polylactic Acid PLA Market Revenue, 2026 – 2035 (USD Billion)
- 9.4.10. New Zealand Lactic Acid and Polylactic Acid PLA Market Revenue, 2026 – 2035 (USD Billion)
- 9.4.11. Australia Lactic Acid and Polylactic Acid PLA Market Revenue, 2026 – 2035 (USD Billion)
- 9.4.12. South Korea Lactic Acid and Polylactic Acid PLA Market Revenue, 2026 – 2035 (USD Billion)
- 9.4.13. Taiwan Lactic Acid and Polylactic Acid PLA Market Revenue, 2026 – 2035 (USD Billion)
- 9.4.14. Rest of Asia Pacific Lactic Acid and Polylactic Acid PLA Market Revenue, 2026 – 2035 (USD Billion)
- 9.5. The Middle-East and Africa
- 9.5.1. The Middle-East and Africa Lactic Acid and Polylactic Acid PLA Market Revenue, By Country, 2026 – 2035 (USD Billion)
- 9.5.2. The Middle-East and Africa Lactic Acid and Polylactic Acid PLA Market Revenue, By Type, 2026 – 2035
- 9.5.3. The Middle-East and Africa Lactic Acid and Polylactic Acid PLA Market Revenue, By Lactic Acid Grade, 2026 – 2035
- 9.5.4. The Middle-East and Africa Lactic Acid and Polylactic Acid PLA Market Revenue, By PLA Type, 2026 – 2035
- 9.5.5. The Middle-East and Africa Lactic Acid and Polylactic Acid PLA Market Revenue, By Application, 2026 – 2035
- 9.5.6. The Middle-East and Africa Lactic Acid and Polylactic Acid PLA Market Revenue, By End-Use, 2026 – 2035
- 9.5.7. Saudi Arabia Lactic Acid and Polylactic Acid PLA Market Revenue, 2026 – 2035 (USD Billion)
- 9.5.8. UAE Lactic Acid and Polylactic Acid PLA Market Revenue, 2026 – 2035 (USD Billion)
- 9.5.9. Egypt Lactic Acid and Polylactic Acid PLA Market Revenue, 2026 – 2035 (USD Billion)
- 9.5.10. Kuwait Lactic Acid and Polylactic Acid PLA Market Revenue, 2026 – 2035 (USD Billion)
- 9.5.11. South Africa Lactic Acid and Polylactic Acid PLA Market Revenue, 2026 – 2035 (USD Billion)
- 9.5.12. Rest of the Middle East & Africa Lactic Acid and Polylactic Acid PLA Market Revenue, 2026 – 2035 (USD Billion)
- 9.6. Latin America
- 9.6.1. Latin America Lactic Acid and Polylactic Acid PLA Market Revenue, By Country, 2026 – 2035 (USD Billion)
- 9.6.2. Latin America Lactic Acid and Polylactic Acid PLA Market Revenue, By Type, 2026 – 2035
- 9.6.3. Latin America Lactic Acid and Polylactic Acid PLA Market Revenue, By Lactic Acid Grade, 2026 – 2035
- 9.6.4. Latin America Lactic Acid and Polylactic Acid PLA Market Revenue, By PLA Type, 2026 – 2035
- 9.6.5. Latin America Lactic Acid and Polylactic Acid PLA Market Revenue, By Application, 2026 – 2035
- 9.6.6. Latin America Lactic Acid and Polylactic Acid PLA Market Revenue, By End-Use, 2026 – 2035
- 9.6.7. Brazil Lactic Acid and Polylactic Acid PLA Market Revenue, 2026 – 2035 (USD Billion)
- 9.6.8. Argentina Lactic Acid and Polylactic Acid PLA Market Revenue, 2026 – 2035 (USD Billion)
- 9.6.9. Rest of Latin America Lactic Acid and Polylactic Acid PLA Market Revenue, 2026 – 2035 (USD Billion)
- 9.1. Lactic Acid and Polylactic Acid PLA Market Overview, By Region Segment
- Chapter 10. Competitive Landscape
- 10.1. Company Market Share Analysis – 2025
- 10.1.1. Global Lactic Acid and Polylactic Acid PLA Market: Company Market Share, 2025
- 10.2. Global Lactic Acid and Polylactic Acid PLA Market Company Market Share, 2024
- 10.1. Company Market Share Analysis – 2025
- Chapter 11. Company Profiles
- 11.1. NatureWorks LLC
- 11.1.1. Company Overview
- 11.1.2. Key Executives
- 11.1.3. Product Portfolio
- 11.1.4. Financial Overview
- 11.1.5. Operating Business Segments
- 11.1.6. Business Performance
- 11.1.7. Recent Developments
- 11.2. TOTALENERGIES Corbion BV
- 11.3. Corbion NV
- 11.4. Galactic SA (Biopharma Group)
- 11.5. Henan Jindan Lactic Acid Technology Co. Ltd.
- 11.6. BBCA Group (Anhui BBCA Biochemical)
- 11.7. Musashino Chemical Laboratory Ltd.
- 11.8. Futerro SA
- 11.9. Uhde Inventa-Fischer GmbH (thyssenkrupp)
- 11.10. Synbra Technology BV
- 11.11. Teijin Limited
- 11.12. Others.
- 11.1. NatureWorks LLC
- Chapter 12. Research Methodology
- 12.1. Research Methodology
- 12.2. Secondary Research
- 12.3. Primary Research
- 12.3.1. Analyst Tools and Models
- 12.4. Research Limitations
- 12.5. Assumptions
- 12.6. Insights From Primary Respondents
- 12.7. Why Custom Market Insights
- Chapter 13. Standard Report Commercials & Add-Ons
- 13.1. Customization Options
- 13.2. Subscription Module For Market Research Reports
- 13.3. Client Testimonials
List Of Figures
Figures No 1 to 42
List Of Tables
Tables No 1 to 56
Prominent Player
- NatureWorks LLC
- TOTALENERGIES Corbion BV
- Corbion NV
- Galactic SA (Biopharma Group)
- Henan Jindan Lactic Acid Technology Co. Ltd.
- BBCA Group (Anhui BBCA Biochemical)
- Musashino Chemical Laboratory Ltd.
- Futerro SA
- Uhde Inventa-Fischer GmbH (thyssenkrupp)
- Synbra Technology BV
- Teijin Limited
- Others
FAQs
The key players in the market are NatureWorks LLC, TOTALENERGIES Corbion BV, Corbion NV, Galactic SA (Biopharma Group), Henan Jindan Lactic Acid Technology Co. Ltd., BBCA Group (Anhui BBCA Biochemical), Musashino Chemical Laboratory Ltd., Futerro SA, Uhde Inventa-Fischer GmbH (thyssenkrupp), Synbra Technology BV, Teijin Limited, Others.
The incontrovertible market shaper in the lactic acid and PLA industry is government regulations that occur at both ends of the value chain, in feedstock policy and end-of-life waste management infrastructure. Plastic ban laws in over 60 national jurisdictions that require compostable or recyclable substitutes impose binding demand transitions that cannot adopt a normal schedule of market adoption. EU taxonomies targeting bio-based chemical investments as assets that can be invested under sustainable finance elicit interest in ESG capital to fund lactic acid and PLA capacity increases at favourable financing terms. Certification standards of compostable packaging, such as EN 13432 and ASTM D6400 defines the technical performance of PLA formulations that are needed to make regulatory claims of compostability, leading to the ongoing R&D commitment on compostability optimization. The Farm to Fork Strategy agricultural input policies in the European Union are also encouraging the use of biodegradable mulch film in place of polyethylene agricultural films – an area where PLA based materials are proving technically competitive and where regulatory requirements in France, Italy, and Spain are providing new commercial segments. The lactic acid food additive regulation in major markets is strong yet well-established such that the regulatory predictability allows capital investment in the food-grade fermentation capacity in the long term.
The pricing of lactic acid commodity has been USD 1.20 to USD 2.00 per kilogram of food-grade material in the last five years, which has differed depending on the price of the fermentation feedstock materials such as corn and sugarcane and the cost of natural gas energy used to purify the downstream. PLA has traditionally in the past been priced at a premium of USD 0.30 -USD 0.80 per kilogram over similar thermoplastics derived out of fossil fuels such as PET and PP, a difference that has been steadily decreasing as the scale of PLA production capacity expands, fermented feedstock yields rise, and petroleum-based feedstock prices gain the growing pressure of carbon costs. According to industry predictions, it would be possible to achieve cost parity between PLA and PET in packaging by 2028-2030 in the base case under conditions of no adjustments when the economies of scale are considered, a feat that would see the significant acceleration of market penetration by eliminating the primary barrier to commercial adoption, the price premium. The regulatory non-adherence cost, such as the possible ban on selling the products in the key markets and the reputational risk of failing to deliver on the sustainability of the packaging as publicly stated, is becoming increasingly considered in the buying decisions of brand owners, effectively increasing the implicit value of compliant bioplastic substitutes and lowering the weight given to the cost differentials in the material selection decisions.
Using the current analysis, the market is estimated to grow to about USD 12.96 billion by 2035 due to the global regulatory requirements of using conventional plastics, the second generation technology of fermenting feedstock to produce plastics reducing the cost of producing PLA and improving its sustainability profile, stereocomplex and advanced formulations of plastics accessing high-value engineering thermoplastic markets previously served by fossil-based polymers, chemical recycling infrastructure closing the bioplastic material loop and improving the environmental credibility of PLA to its brand owner customers, biomedical and pharmaceutical applications delivering premium growth vectors, and agricultural film applications creating substantial new volume markets, at a CAGR of 11.9% from 2026 to 2035.
It is projected that Asia Pacific will continue to hold the largest revenue share during the prediction period, with its unmatched concentration of lactic acid production capacity approximating more than 60% of the world’s installed volume; its largest food processing industry with its largest concentration in China, India, and Southeast Asia will continue to drive structural food-grade lactic acid demand, the rapid adoption of PLA packaging in the region due to regulation, the increasing production capacity of PLA lessening reliance on imports and the long-term growth prospects in all its major end-use markets.
It is forecasted that the regional CAGR will grow at the highest rate of 12.4% per Asia Pacific with China pushing forward with its ambitious Plastic Pollution Action Plan that could result in such large scale domestic consumption of switchable-to-biodegradable packaging potentially altering its conventional packaging production, India with its 2022 single-use plastics ban policy that impacts a 1.4 billion consumer population with India changing to biodegradable packaging; and Thailand as a new investment location of TOTALENERGIES. Corbion and NatureWorks’ Thailand production investments are positioning the region as a global PLA supply hub, rapidly expanding food processing industries in Southeast Asia are driving food-grade lactic acid consumption, and the explosive growth of e-commerce packaging demand across the region is creating substantial incremental sustainable packaging requirements.
It is also estimated that the Global Lactic Acid and Polylactic Acid Market will grow significantly as a result of the EU Single-Use Plastics Directive and similar requirements in China and India as well as dozens of other nations that will replace conventional plastic packaging with biodegradable materials; that the bioplastics market will reach USD 42.7 billion by 2033 with PLA taking the largest biodegradable bioplastic market share; that synthetic substitutes and biomedical device and drug delivery markets expanding at 6.5% CAGR with lactic acid taking a larger share from synthetic alternatives; that biomedical device and drug delivery market expansion toward USD 15.7 billion by 2030 will drive pharmaceutical-grade PLA and lactic acid demand; and that fermentation technology advances are projected to reduce lactic acid production costs by 20–35% by 2030 improving PLA price competitiveness against fossil-based plastics.