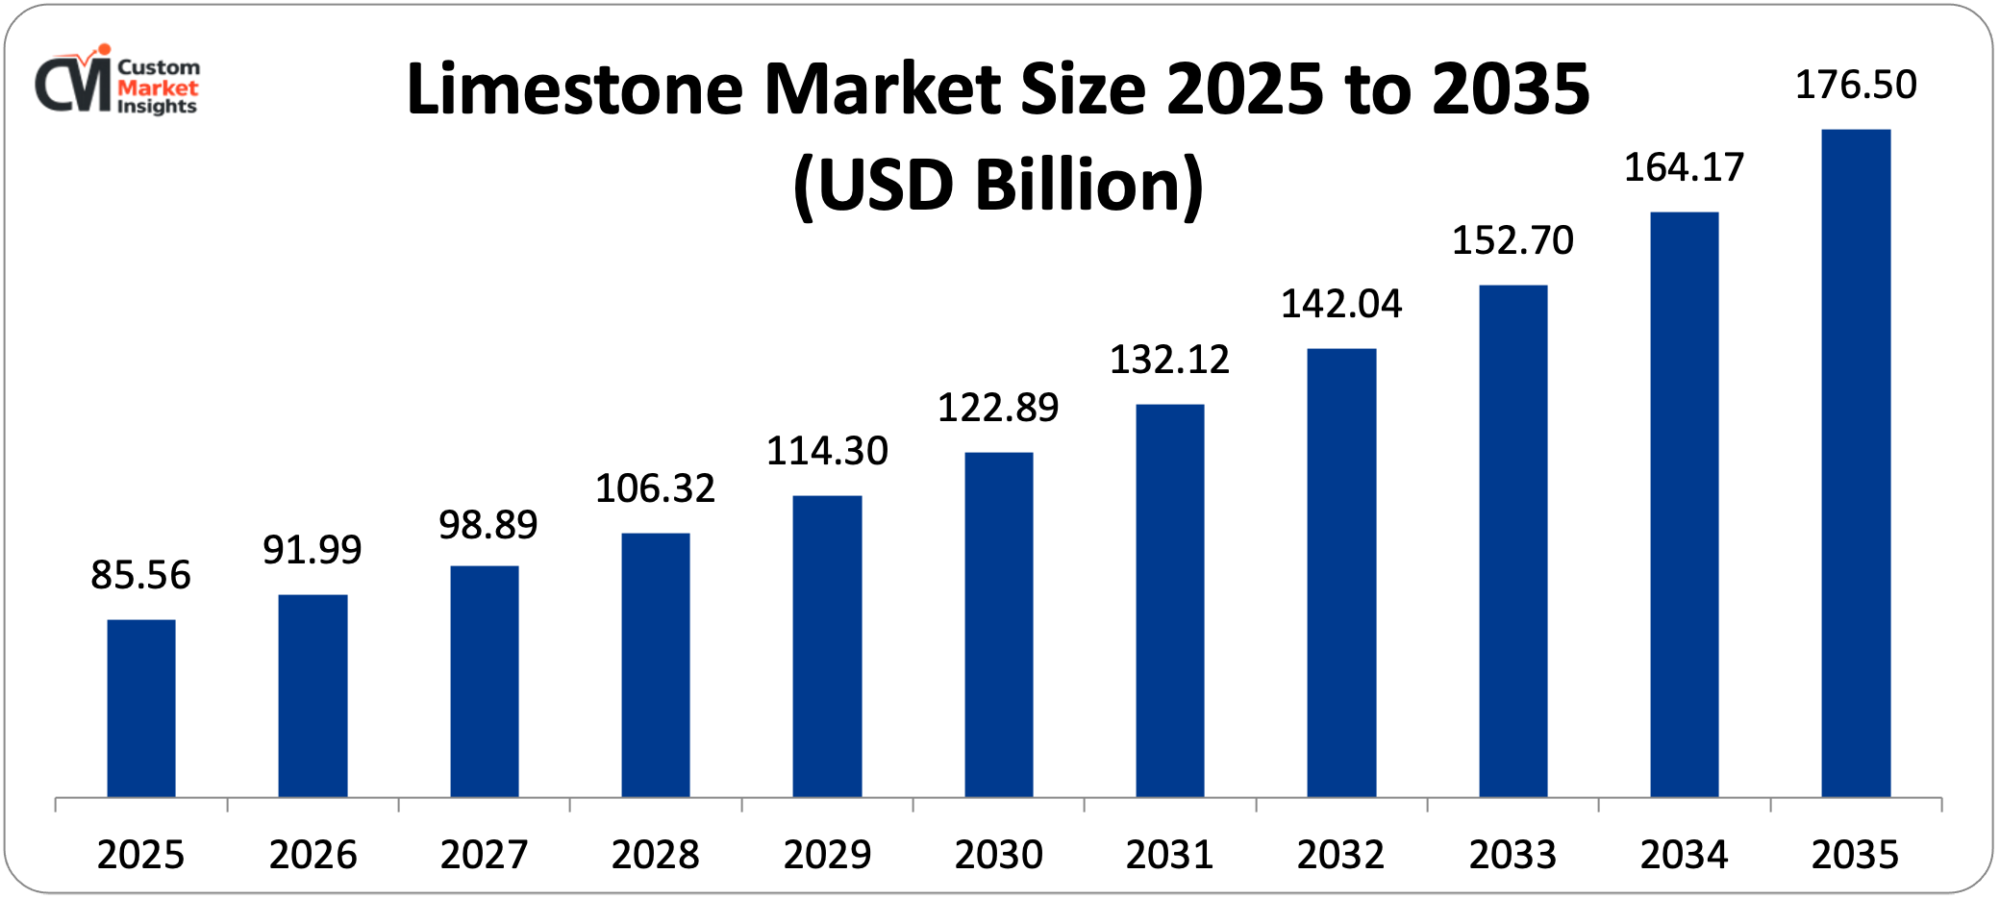
Valued at USD 91.99 Bn in 2026, the market is projected to reach USD 177 Bn by 2035, growing at a 7.5% CAGR. Asia Pacific is both the largest and the fastest-growing region. The report profiles 14 companies.
The global limestone market was valued at USD 91.99 Bn in 2026 and is projected to reach USD 177 Bn by 2035, growing at a CAGR of 7.5%. Asia Pacific is both the largest and the fastest-growing regional market.
The global limestone market is expected to grow at a CAGR of 7.51% from the value of USD 85.56 billion in 2025 to USD 164.17 billion by 2034. The global limestone market is expected to grow at a CAGR of 7.5% and reach USD 176.50 billion by 2035.
Asia Pacific held the largest share of the limestone market, accounting for nearly 56% of the market revenue in 2024, which is due to the region being the largest steel producer in the world and the construction industry's development in the developing economies of the region.
India is projected to achieve the steepest CAGR from 2025 to 2030 as the country is witnessing huge investments in government infrastructure and a rapid expansion in cement production capacity.
High calcium limestone accounted for the largest share, 65.2% of the global market, in 2024, with its use across a range of applications, including cement production, construction and flue gas desulfurization.
The building and construction applications held the lion's share of limestone revenue in 2024, over 82%, with limestone being key to cement, aggregates and road base applications.
Industrial lime accounted for 66.49% of the 2024 volume and is expected to grow at 4.06% CAGR till 2030.
Impact of Middle East War on Limestone Market
Due to supply chain issues related to mining operations and the effect on transportation networks in regions affected by the Middle East war, there is likely to be an increase in supply problems in the global limestone industry. With the rising prices of fuel and energy, limestone producers face rising costs associated with limestone quarrying and shipping. There is a reduction in the demand for limestone due to reduced demands from the construction and cement industries because of delayed projects.
Significant Growth Factors
The Limestone Market Trends present significant growth opportunities due to several factors:
Accelerating Global Infrastructure Development and Urbanization Driving Cement Demand: The worldwide infrastructure investment supercycle, which involves road and highway infrastructure, bridges, dams, urban transit systems, airports, ports and affordable housing building in developing and developed economies, is the strongest and most persistent demand driver for limestone globally. More than 65 per cent of limestone demand is from construction-related activities, and the cement industry, consuming about 3.6 billion metric tons of limestone per year, is still contributing to the demand due to the large-scale commercial and residential development projects. In 2023, the global urban population surpassed 4.4 billion, resulting in a substantial demand for cement and concrete-related infrastructure—this also meant a substantial rise in limestone mining. About 80–90% of the raw material feed to Portland cement kilns is limestone; it is an irreplaceable feedstock for the global cement industry, which produces about 4.1 billion metric tons of Portland cement per year. By 2050 the world's urban population will grow by about 2.5 billion people, mainly in Asia, Africa, and Latin America, creating an unprecedented multi-decade demand pipeline for cement and concrete that will drive unprecedented demand for limestone. The construction of roads, bridges, and business buildings has increased owing to infrastructure development projects such as PM Gati Shakti in India and the Belt and Road Initiative in China, which have led to the increased activity of limestone mining. Also, more than 25,000 cement factories in the world use limestone as a main raw material. The U.S. Infrastructure Investment and Jobs Act, a USD 1.2 trillion program of authorized federal infrastructure spending, is now at its peak for capital deployment in 2025–2026, and this surge in demand for infrastructure will be pushing limestone use to new highs as the demand for cement and aggregate for bridge rehabilitation, highway reconstruction, and port modernization projects is massive. The initiating policy environment, including a multi-year base load of aggregate and high-purity lime consumption, is being driven by long-dated policy tailwinds, such as the Infrastructure Investment and Jobs Act and reshoring-related megaprojects, which include semiconductor fabs, EV-battery plants, and grid upgrades, continuing well beyond the typical construction cycles.
Growing Environmental Applications and Industrial Emission Control Mandates: The increasing complexity of industrial air quality and water treatment standards around the world is driving a growing demand for limestone in environmental uses, especially in the field of flue gas desulfurization (FGD) with the largest growth segments in wastewater neutralization, acid mine drainage treatment, and soil remediation. More than 150 coal-fired power plants (CFPPs) worldwide have already installed flue gas desulfurization (FGD) units based on limestone in order to meet emissions standards. To meet emissions standards, more than 150 coal-fired power plants (CFPPs) around the world have already installed flue gas desulfurization (FGD) units based on limestone. The amount of limestone consumed by each unit has reached up to 300,000 tons per year, and it has become a mineral used in the environment. The FGD process uses limestone slurry to take up SO₂ in the flue gases from power plants to generate over 95% removal of SO₂ emissions and a marketable by-product of gypsum (CaSO₄). To reduce SO₂ emission limits, the operators of power plants in China, India, and other Southeast Asian countries are required to install FGD units that will absorb SO₂ at 1.2–1.5 tons of limestone per ton of SO₂ removed. The specifications require a level of not less than 90% CaCO₃ and require a very narrow particle-size distribution, giving some pricing power to quarries that are able to beneficiate. Limestone plays an important role in water treatment applications, such as pH adjustment of drinking water, precipitation of heavy metals, and controlling the alkalinity of wastewater in municipal treatment plants. The increasing awareness of clean water and health is expected to boost the sales of limestone, while government policies and directives are expected to drive the market, as the U.S. EPA announced enforcement of the clean water and safe drinking water law in support of municipal wastewater treatment plants. The U.S., China, and Germany alone accounted for over 22 million metric tons of limestone used in flue gas scrubbers each year, and this demand becomes increasingly important as industrial air quality law enforcement efforts increase.
What are the Major Advances Changing the Limestone Market Today?
Carbon Capture, Utilization, and the Decarbonization Technology Opportunity: Limestone, which is traditionally a product of cement and lime manufacturing that is associated with carbon intensive processes, is today facing paradoxical demand opportunities in emerging carbon capture, utilization and storage (CCUS) technologies and in new low-carbon cement alternatives due to the global industrial decarbonization imperative. In June 2025, Holcim started the OLYMPUS project in Milaki, Greece, using the latest carbon capture technology to lower emissions and to pave the way for the cement industry. The calcination of limestone is an intrinsic process in cement making and the biggest contributor of CO₂ with around 60% of the carbon footprint of the cement process, as it produces CO₂ when CaCO₃ is fired in the kiln to CaO. The cement industry accounts for around 7–8% of global CO₂ emissions, and the industry is making substantial investments in carbon capture technologies to capture this process CO₂ stream for geological disposal or industrial use, resulting in new infrastructure investments and increased demand for high purity limestone feed. The International Energy Agency projects a reduction in CO₂ from the cement industry of up to 15–20% when using limestone-based alternatives, and government policy such as the EU's Circular Economy Action Plan favours the use of sustainable materials and encourages the use of limestone in low-carbon construction applications. One carbon removal method that has garnered a lot of investment and early pilot deployment is enhanced weathering, which involves spreading finely ground calcium silicate or carbonate minerals on agricultural land to speed up the naturally occurring reactions that convert carbon into minerals. Limestone-derived materials are available as feedstock and are abundant and available worldwide. Hence, producers using surveying software based on drone technology, AI-optimized blasting, energy-efficient PFR/VSK kilns and CO₂-capture or utilization pathways are structurally more resilient when it comes to safeguarding margins in carbon- and compliance-limited scenarios until 2035.
Technological Innovation in Mining, Processing, and Quality Enhancement: Technological improvements in quarrying, mineral processing and quality management of limestone products are changing the economic and environmental outcomes of limestone production, allowing producers to meet the growing expectations and requirements from industry for limestone products and minimize their environmental footprint. The development of mining, crushing and processing technologies has increased the efficiency of the operations, decreased the impact on the environment and contributed to better product quality, positioning the industry in line with the global efforts for sustainability and energy conservation. Drone-based surveying coupled with AI optimized blasting is delivering better resource utilization and reducing waste and environmental impacts. The use of ultra-fine grinding technology to produce particles of precipitated calcium carbonate and ground calcium carbonate that are less than 1 micron is driving increased applications of limestone in high-value markets such as pharmaceutical excipients, food additives, specialty coatings and polymer composites, which command significantly higher prices than conventional construction-grade limestone. Longcliffe Quarries invested USD 3 million in two new ultra-fine grinding mills to satisfy new standards for purity in high-spec calcium-carbonate applications and reduce the industry's energy intensity, while simultaneously upgrading processing ability to deliver better product quality and production economics. This is challenging for quarry operators who are now looking for ways to monitor and keep the calcium carbonate under their product purity specification throughout the extraction and crushing process and, crucially, to identify any off-specification product before it reaches the customer, with the latest automated sorting and real-time X-ray fluorescence (XRF) analysis systems helping them achieve this. The best limestone producers are already using digital twins to improve blast design, crusher throughput, kiln operating conditions, and logistics scheduling, all resulting in an energy saving per ton of product and a general improvement in the overall equipment effectiveness.
Expanding Agricultural Applications and Sustainable Soil Management: Increasing global focus on agricultural productivity, sustainable soil health management and food security is leading to a rapid increase in the use of agricultural limestone, both high calcium and magnesian, as an essential tool for managing soil acidity, increasing nutrient availability and optimizing crop yields on the world's ever expanding area of cultivated soils. Limestone is used in agriculture as a soil conditioner and for its buffering capacity, which improves crop yields. The market is also being driven by industrial applications such as steel manufacturing and water treatment. On the other hand, some 30–40% of global agricultural soils are acidic enough to seriously limit crop production and agricultural limestone application, which is a non-toxic source of calcium, is capable of boosting yields by 10–30% in affected fields—an enormous and underaddressed market opportunity as developing world agricultural systems modernize. The magnesian limestone segment is expected to grow at a CAGR of 5.2% during the forecast period, primarily due to rising demand for the segment in some of its specialized applications including refractories, glass production, and soil stabilization. The European Lime Association (EuLA) points out that special characteristics of magnesian limestone like content of magnesium make it one of the most suitable materials for soil with magnesium deficiencies to improve the yield of crops. Africa, Southeast Asia, and Latin America are seeing a growing surge in soil health restoration efforts, including large-scale soil liming projects sponsored by governments and international development agencies, in response to the global food security crisis, which is linked to the need to grow food for a projected 9.7 billion people by 2050 on a limited land base under soil degradation, climate stress, and nutrient depletion.
Category Wise Insights
By Product Type
Why Does High-Calcium Limestone Dominate the Market?
High-calcium limestone was the main product in global demand, accounting for 65.2% of the market share in 2024. The major reason for this supremacy is that the high calcium limestone used in the cement making process, in construction, and in flue gas desulfurization applications are widely used. The high calcium limestone is essential in various industries, resulting in its market leadership, as it is cost-effective and versatile. The basic raw material for Portland cement clinker production is high calcium limestone containing a percentage of calcium carbonate generally higher than 95%. Cement is by far the biggest single end-use for high-calcium limestone at 4.1 billion metric tons of annual production, which directly correlates to approximately 3.3–3.7 billion metric tons of annual limestone feed consumption per year across the globe. With its high CaCO₃ content, high calcium limestone is the preferred grade for lime burning, for which purity is directly related to kiln productivity and the quality of the resulting lime, and it is also used in high purity industrial applications such as the making of FGD reagents, steel fluxes, and high-quality GCC and PCC production, where chemical purity is critical. With the emphasis on quality and purity in industries, high calcium limestone is becoming a preferred source for flue gas desulfurization and water treatment, as well as being used as a flux in steelmaking.
By Processing Method
Why Does Crushed Limestone Lead the Processing Method Segment?
Crushed limestone is dominant in terms of volume of processing, with about 75 - 80% of the total production used in these processing applications, which include the use of crushed limestone as an aggregate and construction material in cement production, road base, concrete production and general civil engineering. Quarry stone, due to its short economic transportation radius (usually less than 200 km for cost competitiveness in transport), has a geographically distributed demand, which makes it possible to have a large number of quarry activities serving local construction markets. The price power is structurally greater in the ultra pure high calcium lime and PCC produced synthetically for specialty fillers in steel production and environmental remediation and the price power is structurally greater in the ultra pure high calcium lime and PCC produced synthetically for specialty fillers in steel production and environmental remediation.
By End-Use Industry
Why Does Building & Construction Dominate the End-Use Industry Segment?
The building and construction segment held the largest market share and contributed to over 82% of the limestone's revenue in 2024 owing to the use of the limestone in the construction industry including cement and concrete, road base, and other applications. The vast amount of construction is a testament to the fact that limestone is the backbone of today's built environment: it is used in virtually every aspect of the built environment, from construction (houses and roads, dams, factories, and cities) to cement production and the supply of aggregates for construction. The biggest driver in the U.S. limestone market is the building and construction industry, accounting for 82% of the total. Limestone plays a crucial role in the production of Portland cement, which is a key component in the construction of roads, highways, and other infrastructure projects and is also a key ingredient in the production of concrete and asphalt.
Report Scope
Feature of the Report
Details
Market Size in 2026
USD 91.99 billion
Projected Market Size in 2035
USD 176.50 billion
Market Size in 2025
USD 85.56 billion
CAGR Growth Rate
7.5% CAGR
Base Year
2025
Forecast Period
2026-2035
Key Segment
By Product Type, Processing Method, End-Use Industry and Region
Report Coverage
Revenue Estimation and Forecast, Company Profile, Competitive Landscape, Growth Factors and Recent Trends
Regional Scope
North America, Europe, Asia Pacific, Middle East & Africa, and South & Central America
Buying Options
Request tailored purchasing options to fulfil your requirements for research.
Regional Analysis
How Big is the Asia Pacific Limestone Market?
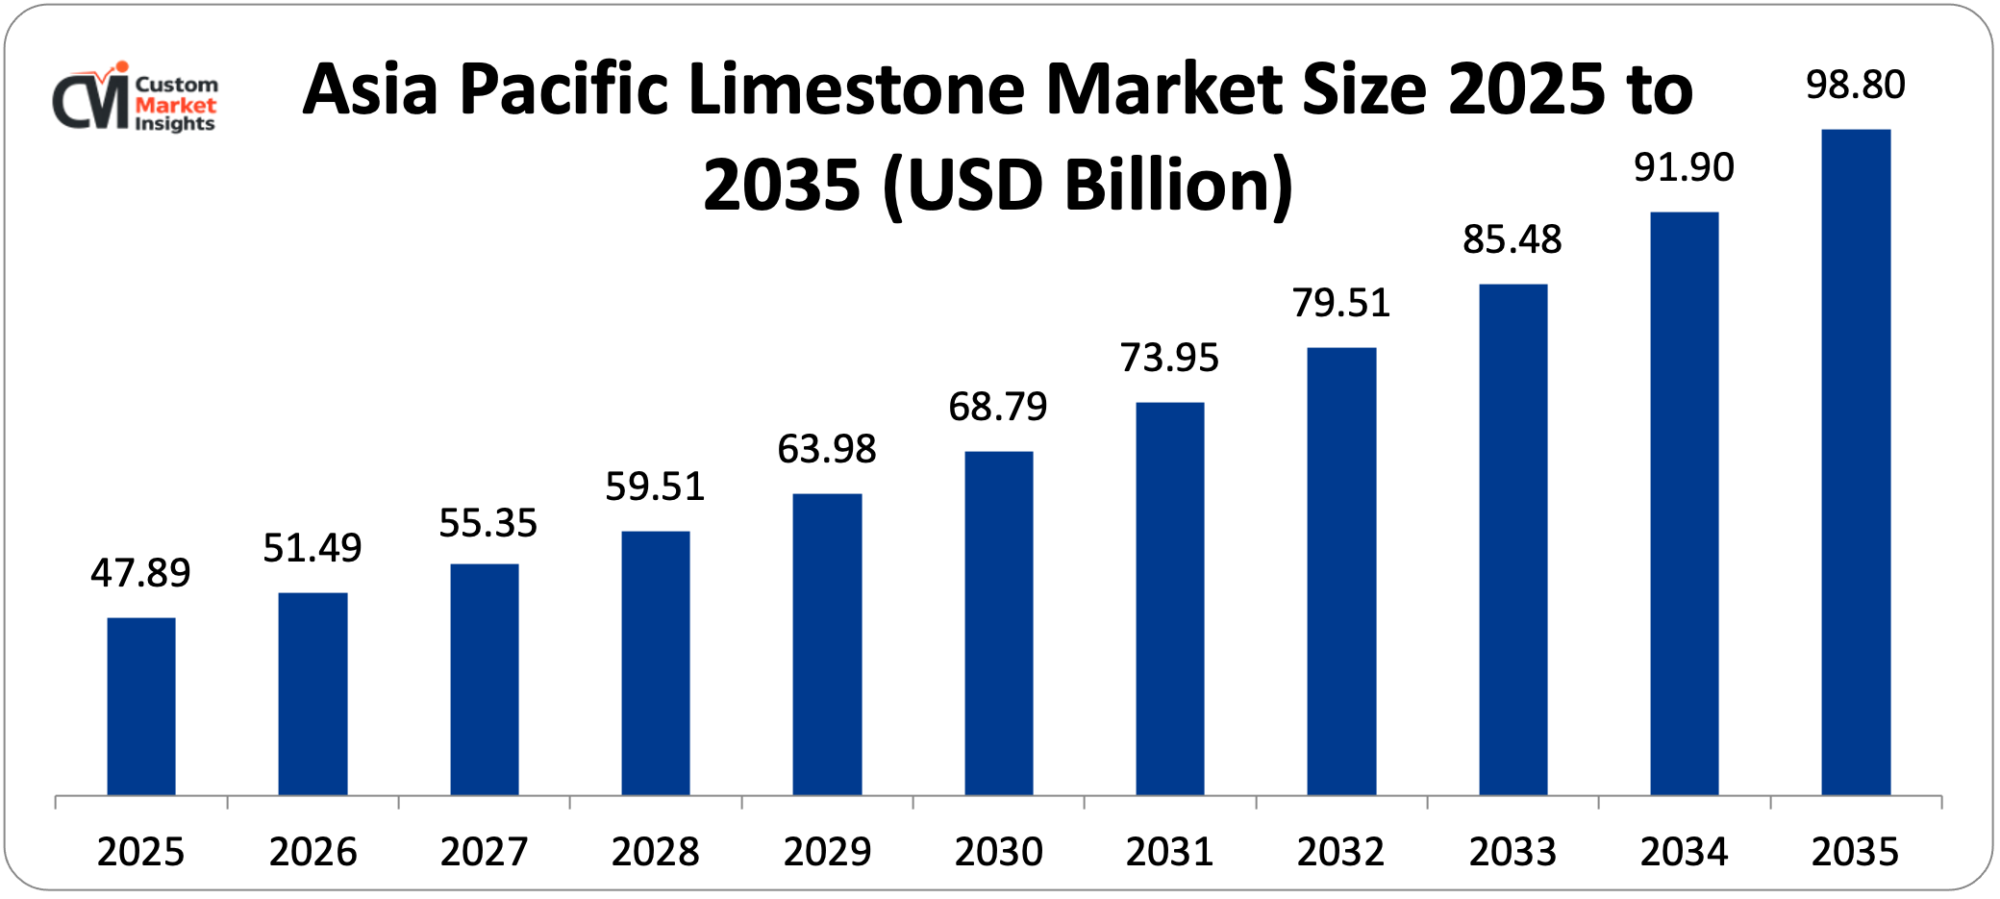
Asia Pacific accounted for the largest market share of the limestone market, with a revenue share of nearly 56% in 2024, due to the region's status as the region's top steel producer and the fast expansion of the construction industry in developing economies. In terms of value, the Asia Pacific limestone market is expected to grow from USD 47.89 billion in 2025 to USD 98.80 billion by 2035, at a CAGR of 7.5% during the forecast period from 2026 to 2035.
Why Does Asia Pacific Dominate the Limestone Market?
Construction activities are massive, as seen in the region, from megacities to transport systems, and they cause a large demand for limestone in making cement and concrete. Another significant amount of limestone is used in the region by the steel industry, especially in China and India. Asia Pacific will remain the most important region as it has the highest population growth rate and urbanization rate, which will drive demand for limestone as well. The dominance of the former is seen in the fact that China is the leading world producer of cement, with more than 2.2 billion metric tons produced annually, the largest producer of steel and the biggest construction market.
China has huge limestone resources, especially in the coastal provinces of Guangdong, Shandong, Hubei, Guizhou, and Yunnan, and limestone is cheap in this country, supporting the huge infrastructure of the Chinese cement and lime industry. India, Indonesia, Vietnam, and Cambodia have accelerated infrastructure build out programs, keeping cement kilns operating well above their nameplate. India, Indonesia, Vietnam and Cambodia have accelerated their infrastructure build out programs and kept cement kilns operating well above the nameplates, resulting in increased pull through of limestone for cement, which is about 80% of cement feedstock.
How Big is the North America Limestone Market?
The North America limestone market size is estimated to be USD 28.94 billion in 2024, and is anticipated to reach USD 45.29 billion by 2033 at 5.1% CAGR from 2025 to 2033. In North America, the limestone market is estimated to be valued at approximately USD 30.49 billion in 2025 and is expected to reach approximately USD 62.54 billion by 2035 with a CAGR of approximately 7.2% between 2026 and 2035.
Why is North America a Critical Market for Limestone?
Limestone continues to be one of the critical raw materials for the industrial infrastructure of the North American continent. Limestone is used as a basic material in traditional applications such as cement manufacturing and steel production, as well as in other applications like agriculture, water treatment and chemical processing. Governments are driving infrastructure modernisation, while industries are constantly striving to become more sustainable, and the demand for limestone keeps growing.
The U.S. limestone industry enjoys a favorable situation with high quality limestone reserves in commercially viable limestone formations in states with both large reserves of limestone and strong industrial construction demand centers, such as Missouri, Texas, Indiana, Pennsylvania, Florida, and Ohio. Mining technology, such as automated drilling, GPS guided blast design and continuous mining equipment, is helping to achieve world-class operational efficiency in limestone quarrying operations in the U.S.
Why is Europe a High-Value Market for Limestone?
The European limestone market size is forecasted to hit the mark of USD 15.74 billion in 2025. Valuable uses include specialty lime, environmental applications, and sustainable construction, with Germany, the UK, and France being the principal countries in this sphere. The European limestone market is characterized by the massive usage of limestone in construction, steel production, and environmentally oriented applications. Lime production is estimated to amount to 2.6 million metric tons per year in Europe in 2023 the largest producers being Germany, the UK, and France.
The EU Green Deal has focused on sustainable construction and decarbonization of building materials making limestone even more important for a range of low-carbon cement alternative production. The EU Green Deal and the emphasis on sustainable construction and decarbonisation of building materials have contributed to the growing importance of limestone as an ingredient for different low-carbon cement substitutes. Moreover, its demand is also influenced by its use as a soil conditioner in agriculture. In addition, FGD systems have been positioned to dominate the European coal and industrial power plants market thanks to the IED regulation and current air quality control application needs for limestone.
Germany Limestone Market Trends
Germany is the biggest market for limestone in Europe, with a leading steel industry with multiple integrated blast furnace complexes having significant demands for lime flux, a large cement and construction aggregate industry, and some of the most demanding FGD specifications for its coal and gas power generation fleet. Carmeuse's pilot carbon capture program on its Belgian kilns and European operators' parallel innovative investments are based upon the industry's strong interest in the development of low carbon limestone production pathways in line with the industrial decarbonisation commitments set by the European Green Deal.
Why is the LAMEA Region Showing Significant Limestone Market Growth?
The limestone market is growing rapidly in the LAMEA region due to the Middle East's huge infrastructure investment programs, the expansion of the mining and construction industries in Africa, and the booming cement and agricultural lime market in Latin America. The Middle East and Africa limestone market is forecast to witness a significant CAGR during the forecast period, driven by the increasing investments in water treatment, infrastructure and mining projects. Saudi Arabia is investing USD1 trillion in infrastructure as part of its Vision 2030 project, which will increase the demand for limestone. In addition, South Africa's Department of Water and Sanitation mentions the use of limestone-based solutions in many systems of purification.
Brazil Limestone Market Trends
Brazil is the largest market in Latin America with the country's cement production capacity being substantial, with Brazil being among the top-10 cement producers in the world, a large agricultural sector with demand for lime to manage the acidic tropical soils and an expanding steel industry. The Cerrado and Amazon agricultural frontier in Brazil have enormous amounts of acid soils that will need systematic lime application to make them more productive, which will form a large and growing agricultural lime demand base. CALIDRA announced in August 2025 a USD 30 million investment in the expansion of limestone operations in Latin America, in the Argentine and Chilean markets, highlighting the importance of these investors in this region's market growth until 2035.
Top Players in the Limestone Market and Their Offerings
Lhoist Group
Carmeuse Group
Graymont Limited
Omya International AG
Imerys S.A.
Minerals Technologies Inc.
Mississippi Lime Company
Vulcan Materials Company
Martin Marietta Materials Inc.
Holcim Group
CEMEX S.A.B. de C.V.
SCR-Sibelco NV
M. Huber Corporation
Longcliffe Quarries Ltd.
Others
Key Developments
The limestone market has witnessed a tremendous transformation in the last few years, with companies striving to gain greater capabilities and strengthen their product offerings.
In May 2025:Holcim introduced the OLYMPUS project in Milaki, Greece, using state-of-the-art carbon capture technology to decrease CO₂ emissions from its limestone cement production process and set a new benchmark for the European cement industry's decarbonization pathway, one of the most advanced commercial carbon capture deployments in cement manufacturing.
In March 2025:CALIDRA announced the investment of USD 30 million to expand its limestone operations in Argentina and Chile, intending to grow in the mining, steel and construction industries in Latin America, consolidating its position as the region's main producer of lime, and capitalizing on the infrastructure and industrial development that is taking place in the region.
Through these strategic activities, companies have reinforced their market positions, increased production capacity in high growth markets, developed new low carbon manufacturing technologies and benefited from new growth opportunities in the emerging global limestone market.
The key players in the market are Lhoist Group, Carmeuse Group, Graymont Limited, Omya International AG, Imerys S.A., Minerals Technologies Inc., Mississippi Lime Company, Vulcan Materials Company, Martin Marietta Materials Inc., Holcim Group, CEMEX S.A.B. de C.V., SCR-Sibelco NV, J.M. Huber Corporation, Longcliffe Quarries Ltd., Others.
What role do environmental regulations play in shaping this market's development?
Regulations simultaneously limit and promote limestone market development in several aspects. On the demand side, air quality regulations that require a decrease in SO₂ emissions from power plants and industries. On the demand side, air quality regulations that require a decrease in SO₂ emissions from power plants and industries — including the U.S. EPA's Mercury and Air Toxics Standards, the EU's Industrial Emissions Directive, and China's ultra-low emission standards for power generation — compel adoption of limestone-based FGD systems that consume hundreds of thousands of tons of limestone per installation annually. According to the U.S. Geological Survey, more than 90% of the lime derived from limestone is used for chemical and industrial purposes, with environmental applications including water purification and pollution control representing growing portions of this chemical and industrial use base. Water treatment regulations mandating drinking water pH standards and wastewater alkalinity requirements create additional regulatory-driven demand for limestone in municipal water management. On the supply side, mining environmental regulations — encompassing dust emission limits, blasting vibration controls, stormwater management requirements, land rehabilitation obligations, and protected habitat restrictions — increase quarry operating and compliance costs while constraining new reserve development, creating supply-side constraints in regions with the most stringent environmental governance frameworks.
What challenges could constrain market growth?
Growing regulatory pressure on open-pit mining and emissions is one of the primary restraints on the limestone market. More than 60 countries enacted tougher quarrying laws in 2023 which restrict quarrying in ecologically sensitive areas. Over 1,000 protected habitats are affected by the EU's Natura 2000 Network, which limits the scope of limestone quarry development. In the U.S., mining permits for new limestone quarries fell from 420 in 2022 to 285 in 2023, limiting the growth of supply in regions with robust demand growth. Other restrictions are the high energy costs for lime calcination, resulting in a sensitivity of production costs to energy price fluctuations, the logistics/transportation cost problem of transporting a low value-to-weight commodity over a long distance, and a strong opposition from the local community to new quarrying operations, which typically require permits to be issued for 5-10 years, depending on the location, before the project can be implemented in many populous localities where energy transition is occurring.
What is the projected market size by the end of the forecast period?
The global limestone market is expected to grow from USD 91.99 billion in 2026 to USD 176.50 billion by 2035 with an average CAGR of 7.5% until 2035, according to the latest analysis and forecast modeling. The infrastructure supercycle in the Asia Pacific and North America, continued progress in environmental applications as emission regulations become stricter around the world, the expansion of the use of agricultural lime to address soil acidity limitations on food security in developing economies, an enhanced utilization of high-purity calcined limestone in steelmaking, including hydrogen-DRI processes, and the development of new applications in carbon capture and specialty material production will drive growth.
Which region is anticipated to dominate the market during the forecast period?
Asia Pacific was the largest limestone market in 2024, accounting for nearly 56% of the market, and the region is projected to continue with its dominant position during the forecast period as China alone produces more than half of the world's cement, the largest steel industry in the world generates demand for flux agents in the region, and the fastest construction markets are in India and Southeast Asia.
Which region is expected to grow at the fastest CAGR in this market?
The CAGR for India is projected to be the highest of all countries while the Asia Pacific is expected to witness the highest growth among all regions on account of growing infrastructure spending in India, Vietnam, and Southeast Asia; the biggest cement and steel production base in the Asia Pacific, and the rising number of environmental compliance applications driven by FGD in coal-heavy economies that are tightening SO₂ emission standards. The unprecedented construction activity resulting from India's government-backed National Infrastructure Pipeline worth USD 1.4 trillion and the Smart Cities Mission is directly affecting the demand for limestone.
What are the key driving factors influencing the growth of the limestone market?
The market will be driven by the critical importance of limestone in the construction and infrastructure industries and its extensive use in the industry and agriculture sectors. The extensive application of limestone in the construction and infrastructure industries, industry applications, agricultural applications, and growing concern about sustainability in the construction industry will drive the market. Demand for limestone in the construction industry, agricultural industry, and industrial applications will drive the market. Limestone is extensively used in construction activities, such as making cement and concrete because cities are expanding fast, and infrastructure development is ongoing. Limestone is used in the agricultural industry to improve soil conditions and pH levels, thereby boosting the productivity of the crops. The market is expanded further by its industrial use, such as in steel production and in water treatment. Other factors that have contributed to the FGD adoption are the global environmental compliance requirement, the new application of FGD in carbon capture, India's PM Gati Shakti and similar infrastructure super-programs, and the North America peak infrastructure deployment by 2026-2028 by the IIJA.
Rushikesh Dorge is a seasoned Market Research and Business Consulting Professional with over six years of experience in market intelligence, competitive analysis, forecasting, and business strategy. At Custom Market Insights, he helps organizations identify growth opportunities and make informed decisions by transforming complex market data into actionable insights.