Metaverse Market Size, Trends and Insights By Components (Software, Hardware, Services), By Platform (Mobile, Desktop), By Offerings (Avatars, Virtual Platforms, Asset Marketplace, Financial Services), By Technology (Virtual Reality (VR) and Augmented Reality (AR), Mixed Reality, Blockchain, Others), By Application (Gaming, Online Shopping, Content Creation and Social Media, Events and Conference, Digital Marketing, Testing and Inspection, Others), By Industrial Vertical (BFSI, Retail, Media and Entertainment, Education, Aerospace and Defense, Automotive, Others), and By Region - Global Industry Overview, Statistical Data, Competitive Analysis, Share, Outlook, and Forecast 2024–2033
Report Snapshot
| Study Period: | 2023-2032 |
| Fastest Growing Market: | North America |
| Largest Market: | Asia- Pacific |
Major Players
- META
- NVIDIA Corporation
- Epic Games
- Microsoft
- Snap Inc.
- Nextech AR Solutions Inc.
- The Sandbox
- Others
Reports Description
Our research report offers a 360-degree view of the Metaverse market’s drivers and restraints, coupled with the impact they have on demand during the projection period. Also, the report examines global opportunities and competitive analysis for the Metaverse market.
Although the term “metaverse” may seem like a buzzword to have only lately become popular, it actually refers to a combination of technologies that have been in development for several years. Even though the idea of the Metaverse is still relatively new, several well-known corporations are beginning to pay attention. Our Metaverse Insight Market Map identifies the numerous businesses and technologies involved in this developing sector.

Metaverse is one of the biggest trends in the marketplace all over the world. Increasing investments of the big market players for the development of the metaverse is one of the major driving factors augmenting the growth of this market. The growing adoption of new technologies and the increasing research and developments in the field of the metaverse is anticipated to create lucrative opportunities in the years to come. NFT crypto projects, advancement of the virtual world in the metaverse, the growing popularity of metaverse entertainment events, corporates moving towards this solution, and sophistication of metaverse avatars are a few of the biggest trends of the metaverse market, which have a significant impact on the growth of the market.
The users of Metaverse can virtually interact with people no matter how far off they are from one another. It gives users access to a platform with an immersive experience that improves online social interactions and offers many other benefits outside of social media. It enhances a wide range of activities including online education, gaming, the use of cryptocurrencies and non-fungible tokens (NFTs), as well as the working environment. In addition, it is anticipated that Metaverse would be able to support emerging firms and offer enormous potential for financial growth in the future. Also, the introduction of IoT in the metaverse has aided in overcoming one of its formidable difficulties, such as the transfer of data from the real world to the virtual one.
Report Scope
| Feature of the Report | Details |
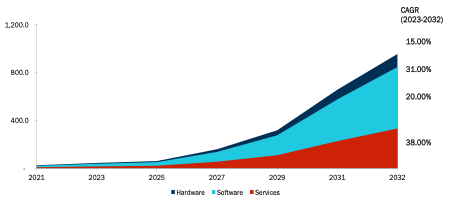
| Market Size in 2022 | USD 70.4 Billion |
| Projected Market Size in 2032 | USD 2,131.6 Billion |
| Market Size in 2023 | USD 95.3 Billion |
| CAGR Growth Rate | 41.2% CAGR (2022-2030) |
| Base Year | 2023 |
| Forecast Period | 2024-2033 |
| Key Segment | By Components (Software, Asset Creation Tools, Programming Engines, Hardware, Haptic Sensors & Devices, Smart Glasses, Omni Treadmills, Displays, Extended Reality (XR) Hardware, AR/VR Headsets, Others, Services), By Platform (Mobile, Desktop), By Offerings (Avatars, Virtual Platforms, Asset Marketplace, Financial Services), By Technology (Virtual Reality (VR) and Augmented Reality (AR), Mixed Reality, Blockchain, Others), By Application (Gaming, Online Shopping, Content Creation and Social Media, Events and Conference, Digital Marketing, Testing, and Inspection, Others), By Industrial Vertical (BFSI, Retail, Media and Entertainment, Education, Aerospace and Defense, Automotive, Others), and Region |
| Report Coverage | Revenue Estimation and Forecast, Company Profile, Competitive Landscape, Growth Factors, and Recent Trends |
| Regional Scope | North America, Europe, Asia Pacific, Middle East & Africa, and South & Central America |
| Buying Options | Request tailored purchasing options to fulfill your requirements for research. |
METAVERSE MARKET DRIVERS
Growing Investment in the Metaverse
Facebook caught everyone’s attention when it rebranded as Meta. This change ushered awareness of the metaverse among the public on a level never seen before. Many companies from various industries are working on metaverse-based projects currently. Some of these are based on gaming. Other firms are working on solutions that are on an enterprise level. Companies like Microsoft and NVIDIA produce software and hardware which helps power the metaverse.
Platforms for gaming like ROBLOX have developed into the metaverse. Other companies such as Sony, Tencent, and others are shifting their platforms to new ventures in the metaverse. This opens up points of entry into the metaverse for users using their products. Meta’s investment worth $10 billion is just the tip of the iceberg when it comes to the investment being made in the metaverse. Microsoft spent over $70 billion on metaverse-based interests.
Large technology firms, private equity (PE), venture capital (VC), established brands, and start-ups are looking to capitalize on this metaverse opportunity. VC, Corporations, and PE have invested over $120 billion already in the metaverse in these initial five months of the year2022, over double the $57 billion which was invested in the year 2021, a large part of it is fuelled by the planned acquisition by Microsoft’s of Activision for $69 billion. Industries that are leading currently in the adoption of the metaverse also plan to dedicate a substantial share of their digital investments to it.
There are also such instances of several companies spending capital to support themselves in the metaverse. Corporate enterprises’ increased interest demonstrates its increased value. The largest companies are making significant investments for a purpose. These businesses are aware of how rapidly the metaverse industry is developing.
An increase in demand in the media and entertainment sector.
The augmented reality (AR) and virtual reality (VR) adoption rates are skyrocketing in the media and entertainment industry, which is expanding at an exponential rate. The development of realistic virtual environments to enhance the overall gaming experience for its players is one of the main drivers of the rising use of these technologies. The first-person view, 6-degree freedom, and intuitive user interface (UI) of devices like MR headsets, VR headsets, Heads Up Displays (HUD), Helmet Mounted Displays (HMD), smart helmets, and smart glasses increase their adoption rate.
As a result of the emergence of these devices as well as the solutions offered, user interface designs have increased in number. One of the greatest presents that technology has given to humanity is the ability to interact with virtual experiences in real-world settings. The market’s leading competitors have made large expenditures as a result of the rapidly increasing demand for mixed reality technology. These elements are accelerating the worldwide metaverse market’s trajectory of revenue growth.
A few more significant drivers include:
- Technological advancements such as blockchain, artificial intelligence (AI), mixed reality and several others.
- The majority of consumer behaviour has turned towards the adoption of digital personas adding fuel to the market growth.
- The trend for Augmented Reality + Virtual Reality = Mixed Reality, which aids in interaction with both the real world and virtual world
- Increasing funds and investments from tech giants such as Meta and Microsoft have spent billions on different metaverse components and firms such as Roblox have gained significant funds.
METAVERSE MARKET RESTRAINTS
High Costs of Meta Component Installation and Maintenance
The hardware for the metaverse consists of XR gadgets together with sensors, trackers, semiconductor parts, and other cutting-edge tools. Large storage, high node hardware, as well as fast networking, all of which are more expensive, are necessary for having the most realistic and captivating experience possible with the metaverse. The creation of a realistic virtual environment by these gadgets used in the metaverse uses 3D and other advanced technology, which increases the capital cost.
Costlier software for the metaverse includes 3D modelling, engines, and rendering tools. Also, there are additional costs associated with installing these devices and their solutions. Also, the costs of maintaining these gadgets are increasing along with the overall expenses required to understand this technology. As a result, the expansion of the worldwide metaverse market is being constrained by high installation and maintenance expenses.
Threat from cyber-attacks
In the global economy, cyber-based attacks on the metaverse are a real concern. Cyber-attacks are a major worry for the efficient operation of the metaverse. A cyber threat is a perilous act that promotes software deterioration, system disruption, and data theft while lowering system efficiency. For instance, cyberattacks include illegal commands and data breaches. System failure brought on by cyberattacks causes the metaverse to crash. As a result, cybercrime must be made easier to avoid via the metaverse. In order for a metaverse to operate properly, a secure and reliable network must be established. Consequently, the rise in cyberattacks and extremely sensitive issues are impeding the development of this sector to some extent.
SEGMENTAL ANALYSIS
By Component
The hardware segment dominated the metaverse market in 2021 and is predicted to continue to do so in the coming future.
Devices for the metaverse enable users to explore the astounding world of the metaverse, which is a complicated field. After all, the physical reality of every day coexists with a vast virtual world. The metaverse gear one chooses will determine how individuals interact with that virtual environment. AR systems will overlay the metaverse onto the user’s immediate surroundings. In contrast, VR headsets can completely submerge the user in the metaverse.
By End Use
Media & Entertainment held a substantial share in the End Use segment in the year 2021 and is expected to dominate by 2032.

Media & entertainment segment held the largest revenue share in the year 2021. In the metaverse market Media & entertainment contribute an important role and offer 3D avatars, mix-media, real-time video streaming and the AR VR technique to reinvigorate good experiences and make a modified digital product.
Media & Entertainment sector is substantially growing as key companies are creating their presence in the virtual world. In addition, the increasing need for a realistic and engaging customer experience is driving the market during the forecast period.
Furthermore, the gaming companies and eSports are significantly increasing the media & entertainment segment due to the metaverse creating more opportunities for users and those players who are streaming their games. In addition, gaming is a crucial tool in the development and encouragement of the metaverse and it creates revenue during the forecast period.
COMPETITIVE LANDSCAPE
The global metaverse market is highly fragmented in nature with numerous numbers of companies operating on a domestic and worldwide level. Companies are continuously engaged in launching new and more inventive technologies and solutions, which in turn is aiding the growth of this market. Prominent players in the market are focused on developing and launching new products, making strategic alliances to broaden their product portfolios as well as footprints in the global market.
Increasing adoption of the metaverse in various end-use segments is expected to create revenue generating opportunities for the market players, which in turn is expected to support the exponential growth of this market. Companies profiled in this report are META, NVIDIA Corporation, Epic Games, Microsoft, Snap Inc., Nextech AR Solutions Inc., The Sandbox, Decentraland, Roblox Corporation, and Qualcomm Technologies, Inc.
REGIONAL ANALYSIS

North America accounted for the largest share of the revenue in the year 2021 attributed to the users and customers in the region that are practising the new and complex technology with respect to the metaverse. The U.S. is the leading country with respect to the metaverse, followed by Canada. Further, the rising number of corporations focusing on the formulation of metaverse platforms for it to become profitable is another determinant likely to support the growth in the revenue of the market in North America. Additionally, the rising use of smartphones, growing smart device adoption, and rising demand for AR/VR in numerous applications are also the major factors facilitating the growth of Metaverse in the region.
Asia- Pacific region is growing at an outstanding pace in the analysis period owing to the rapid economic growth and trending digitalization in emerging nations such as India, China, Korea and others. Asia Pacific region has embraced the adoption of Metaverse very rapidly due to the technological advancements, talented young pool and growing commercial value for social networking, gaming and entertainment.
Prominent Players:
- META
- NVIDIA Corporation
- Epic Games
- Microsoft
- Snap Inc.
- Nextech AR Solutions Inc.
- The Sandbox
- Decentraland
- Roblox Corporation
- Qualcomm Technologies, Inc.
- Huawei Technologies Co. Ltd
- Tencent Holdings
- Unity Technologies
- Antier Solutions
- Others
The global Metaverse market is segmented as follows:
By Components
- Software
- Asset Creation Tools
- Programming Engines
- Hardware
- Haptic Sensors & Devices
- Smart Glasses
- Omni Treadmills
- Displays
- Extended Reality (XR) Hardware
- AR/VR Headsets
- Others
- Services
By Platform
- Mobile
- Desktop
By Offerings
- Avatars
- Virtual Platforms
- Asset Marketplace
- Financial Services
By Technology
- Virtual Reality (VR) and Augmented Reality (AR)
- Mixed Reality
- Blockchain
- Others
By Application
- Gaming
- Online Shopping
- Content Creation and Social Media
- Events and Conference
- Digital Marketing
- Testing and Inspection
- Others
By Industrial Vertical
- BFSI
- Retail
- Media and Entertainment
- Education
- Aerospace and Defense
- Automotive
- Others
By Region
North America
- U.S.
- Canada
- Mexico
- Rest of North America
Europe
- Germany
- France
- U.K.
- Italy
- Spain
- Rest of Europe
Asia Pacific
- China
- Japan
- India
- New Zealand
- Australia
- South Korea
- Rest of Asia Pacific
The Middle East & Africa
- Saudi Arabia
- UAE
- Egypt
- Kuwait
- South Africa
- Rest of the Middle East & Africa
Latin America
- Brazil
- Argentina
- Rest of Latin America
Table of Contents
- Chapter 1. Preface
- 1.1 Report Description and Scope
- 1.2 Research scope
- 1.3 Research methodology
- 1.3.1 Market Research Type
- 1.3.2 Market research methodology
- Chapter 2. Executive Summary
- 2.1 Global Metaverse Market, (2024 – 2033) (USD Billion)
- 2.2 Global Metaverse Market : snapshot
- Chapter 3. Global Metaverse Market – Industry Analysis
- 3.1 Metaverse Market: Market Dynamics
- 3.2 Market Drivers
- 3.2.1 Increasing investments of the big market players for the development of metaverse is one of the major driving factors augmenting the growth of this market
- 3.2.2 Growing adoption of new technologies and the increasing research and developments in the field of metaverse are anticipated to create lucrative opportunities in the years to come
- 3.2.3 NFT crypto projects, advancement of virtual world in the metaverse, growing popularity of metaverse entertainment events, corporates moving towards this solution and sophistication of metaverse avatars are a few of the biggest trends of the metaverse market which have a significant impact on the growth of the market.
- 3.3 Market Restraints
- 3.4 Market Opportunities
- 3.5 Market Challenges
- 3.6 Porters Five Forces Analysis
- 3.7 Market Attractiveness Analysis
- 3.7.1 Market attractiveness analysis By Components
- 3.7.2 Market attractiveness analysis By Platform
- 3.7.3 Market attractiveness analysis By Offerings
- 3.7.4 Market attractiveness analysis By Technology
- 3.7.5 Market attractiveness analysis By Application
- 3.7.6 Market attractiveness analysis By Industrial Vertical
- Chapter 4. Global Metaverse Market- Competitive Landscape
- 4.1 Company market share analysis
- 4.1.1 Global Metaverse Market: company market share, 2022
- 4.2 Strategic development
- 4.2.1 Acquisitions & mergers
- 4.2.2 New Product launches
- 4.2.3 Agreements, partnerships, cullaborations, and joint ventures
- 4.2.4 Research and development and Regional expansion
- 4.3 Price trend analysis
- 4.1 Company market share analysis
- Chapter 5. Global Metaverse Market – Components Analysis
- 5.1 Global Metaverse Market overview: By Components
- 5.1.1 Global Metaverse Market share, By Components, 2022 and – 2033
- 5.2 Software
- 5.2.1 Global Metaverse Market by Software, 2024 – 2033 (USD Billion)
- 5.3 Asset Creation Tools
- 5.3.1 Global Metaverse Market by Asset Creation Tools, 2024 – 2033 (USD Billion)
- 5.4 Programming Engines
- 5.4.1 Global Metaverse Market by Programming Engines, 2024 – 2033 (USD Billion)
- 5.5 Hardware
- 5.5.1 Global Metaverse Market by Hardware, 2024 – 2033 (USD Billion)
- 5.6 Haptic Sensors & Devices
- 5.6.1 Global Metaverse Market by Haptic Sensors & Devices, 2024 – 2033 (USD Billion)
- 5.7 Smart Glasses
- 5.7.1 Global Metaverse Market by Smart Glasses, 2024 – 2033 (USD Billion)
- 5.8 Omni Treadmills
- 5.8.1 Global Metaverse Market by Omni Treadmills, 2024 – 2033 (USD Billion)
- 5.9 Displays
- 5.9.1 Global Metaverse Market by Displays, 2024 – 2033 (USD Billion)
- 5.10 Extended Reality (XR) Hardware
- 5.10.1 Global Metaverse Market by Extended Reality (XR) Hardware, 2024 – 2033 (USD Billion)
- 5.11 AR/VR Headsets
- 5.11.1 Global Metaverse Market by AR/VR Headsets, 2024 – 2033 (USD Billion)
- 5.12 Others
- 5.12.1 Global Metaverse Market by Others, 2024 – 2033 (USD Billion)
- 5.13 Services
- 5.13.1 Global Metaverse Market by Services, 2024 – 2033 (USD Billion)
- 5.1 Global Metaverse Market overview: By Components
- Chapter 6. Global Metaverse Market – Platform Analysis
- 6.1 Global Metaverse Market overview: By Platform
- 6.1.1 Global Metaverse Market share, By Platform, 2022 and – 2033
- 6.2 Mobile
- 6.2.1 Global Metaverse Market by Mobile, 2024 – 2033 (USD Billion)
- 6.3 Desktop
- 6.3.1 Global Metaverse Market by Desktop, 2024 – 2033 (USD Billion)
- 6.1 Global Metaverse Market overview: By Platform
- Chapter 7. Global Metaverse Market – Offerings Analysis
- 7.1 Global Metaverse Market overview: By Offerings
- 7.1.1 Global Metaverse Market share, By Offerings, 2022 and – 2033
- 7.2 Avatars
- 7.2.1 Global Metaverse Market by Avatars, 2024 – 2033 (USD Billion)
- 7.3 Virtual Platforms
- 7.3.1 Global Metaverse Market by Virtual Platforms, 2024 – 2033 (USD Billion)
- 7.4 Asset Marketplace
- 7.4.1 Global Metaverse Market by Asset Marketplace, 2024 – 2033 (USD Billion)
- 7.5 Financial Services
- 7.5.1 Global Metaverse Market by Financial Services, 2024 – 2033 (USD Billion)
- 7.1 Global Metaverse Market overview: By Offerings
- Chapter 8. Global Metaverse Market – Technology Analysis
- 8.1 Global Metaverse Market overview: By Technology
- 8.1.1 Global Metaverse Market share, By Technology, 2022 and – 2033
- 8.2 Virtual Reality (VR) and Augmented Reality (AR)
- 8.2.1 Global Metaverse Market by Virtual Reality (VR) and Augmented Reality (AR), 2024 – 2033 (USD Billion)
- 8.3 Mixed Reality
- 8.3.1 Global Metaverse Market by Mixed Reality , 2024 – 2033 (USD Billion)
- 8.4 Blockchain
- 8.4.1 Global Metaverse Market by Blockchain, 2024 – 2033 (USD Billion)
- 8.5 Others
- 8.5.1 Global Metaverse Market by Others, 2024 – 2033 (USD Billion)
- 8.1 Global Metaverse Market overview: By Technology
- Chapter 9. Global Metaverse Market – Application Analysis
- 9.1 Global Metaverse Market overview: By Application
- 9.1.1 Global Metaverse Market share, By Application, 2022 and – 2033
- 9.2 Gaming
- 9.2.1 Global Metaverse Market by Gaming, 2024 – 2033 (USD Billion)
- 9.3 Online Shopping
- 9.3.1 Global Metaverse Market by Online Shopping, 2024 – 2033 (USD Billion)
- 9.4 Content Creation and Social Media
- 9.4.1 Global Metaverse Market by Content Creation and Social Media, 2024 – 2033 (USD Billion)
- 9.5 Events and Conference
- 9.5.1 Global Metaverse Market by Events and Conference, 2024 – 2033 (USD Billion)
- 9.6 Digital Marketing
- 9.6.1 Global Metaverse Market by Digital Marketing, 2024 – 2033 (USD Billion)
- 9.7 Testing and Inspection
- 9.7.1 Global Metaverse Market by Testing and Inspection, 2024 – 2033 (USD Billion)
- 9.8 Others
- 9.8.1 Global Metaverse Market by Others, 2024 – 2033 (USD Billion)
- 9.1 Global Metaverse Market overview: By Application
- Chapter 10. Global Metaverse Market – Industrial Vertical Analysis
- 10.1 Global Metaverse Market overview: By Industrial Vertical
- 10.1.1 Global Metaverse Market share, By Industrial Vertical, 2022 and – 2033
- 10.2 BFSI
- 10.2.1 Global Metaverse Market by BFSI, 2024 – 2033 (USD Billion)
- 10.3 Retail
- 10.3.1 Global Metaverse Market by Retail, 2024 – 2033 (USD Billion)
- 10.4 Media and Entertainment
- 10.4.1 Global Metaverse Market by Media and Entertainment, 2024 – 2033 (USD Billion)
- 10.5 Education
- 10.5.1 Global Metaverse Market by Education, 2024 – 2033 (USD Billion)
- 10.6 Aerospace and Defense
- 10.6.1 Global Metaverse Market by Aerospace and Defense, 2024 – 2033 (USD Billion)
- 10.7 Automotive
- 10.7.1 Global Metaverse Market by Automotive, 2024 – 2033 (USD Billion)
- 10.8 Others
- 10.8.1 Global Metaverse Market by Others, 2024 – 2033 (USD Billion)
- 10.1 Global Metaverse Market overview: By Industrial Vertical
- Chapter 11. Market – Regional Analysis
- 11.1 Global Market Regional Overview
- 11.2 Global Market Share, by Region, 2022 & – 2033 (USD Billion)
- 11.3. North America
- 11.3.1 North America Market, 2024 – 2033 (USD Billion)
- 11.3.1.1 North America Market, by Country, 2024 – 2033 (USD Billion)
- 11.3.1 North America Market, 2024 – 2033 (USD Billion)
- 11.4 North America Market, by Components, 2024 – 2033
- 11.4.1 North America Market, by Components, 2024 – 2033 (USD Billion)
- 11.5 North America Market, by Platform, 2024 – 2033
- 11.5.1 North America Market, by Platform, 2024 – 2033 (USD Billion)
- 11.6 North America Market, by Offerings, 2024 – 2033
- 11.6.1 North America Market, by Offerings, 2024 – 2033 (USD Billion)
- 11.7 North America Market, by Technology, 2024 – 2033
- 11.7.1 North America Market, by Technology, 2024 – 2033 (USD Billion)
- 11.8 North America Market, by Application, 2024 – 2033
- 11.8.1 North America Market, by Application, 2024 – 2033 (USD Billion)
- 11.9 North America Market, by Industrial Vertical, 2024 – 2033
- 11.9.1 North America Market, by Industrial Vertical, 2024 – 2033 (USD Billion)
- 11.10. Europe
- 11.10.1 Europe Market, 2024 – 2033 (USD Billion)
- 11.10.1.1 Europe Market, by Country, 2024 – 2033 (USD Billion)
- 11.10.1 Europe Market, 2024 – 2033 (USD Billion)
- 11.11 Europe Market, by Components, 2024 – 2033
- 11.11.1 Europe Market, by Components, 2024 – 2033 (USD Billion)
- 11.12 Europe Market, by Platform, 2024 – 2033
- 11.12.1 Europe Market, by Platform, 2024 – 2033 (USD Billion)
- 11.13 Europe Market, by Offerings, 2024 – 2033
- 11.13.1 Europe Market, by Offerings, 2024 – 2033 (USD Billion)
- 11.14 Europe Market, by Technology, 2024 – 2033
- 11.14.1 Europe Market, by Technology, 2024 – 2033 (USD Billion)
- 11.15 Europe Market, by Application, 2024 – 2033
- 11.15.1 Europe Market, by Application, 2024 – 2033 (USD Billion)
- 11.16 Europe Market, by Industrial Vertical, 2024 – 2033
- 11.16.1 Europe Market, by Industrial Vertical, 2024 – 2033 (USD Billion)
- 11.17. Asia Pacific
- 11.17.1 Asia Pacific Market, 2024 – 2033 (USD Billion)
- 11.17.1.1 Asia Pacific Market, by Country, 2024 – 2033 (USD Billion)
- 11.17.1 Asia Pacific Market, 2024 – 2033 (USD Billion)
- 11.18 Asia Pacific Market, by Components, 2024 – 2033
- 11.18.1 Asia Pacific Market, by Components, 2024 – 2033 (USD Billion)
- 11.19 Asia Pacific Market, by Platform, 2024 – 2033
- 11.19.1 Asia Pacific Market, by Platform, 2024 – 2033 (USD Billion)
- 11.20 Asia Pacific Market, by Offerings, 2024 – 2033
- 11.20.1 Asia Pacific Market, by Offerings, 2024 – 2033 (USD Billion)
- 11.21 Asia Pacific Market, by Technology, 2024 – 2033
- 11.21.1 Asia Pacific Market, by Technology, 2024 – 2033 (USD Billion)
- 11.22 Asia Pacific Market, by Application, 2024 – 2033
- 11.22.1 Asia Pacific Market, by Application, 2024 – 2033 (USD Billion)
- 11.23 Asia Pacific Market, by Industrial Vertical, 2024 – 2033
- 11.23.1 Asia Pacific Market, by Industrial Vertical, 2024 – 2033 (USD Billion)
- 11.24. Latin America
- 11.24.1 Latin America Market, 2024 – 2033 (USD Billion)
- 11.24.1.1 Latin America Market, by Country, 2024 – 2033 (USD Billion)
- 11.24.1 Latin America Market, 2024 – 2033 (USD Billion)
- 11.25 Latin America Market, by Components, 2024 – 2033
- 11.25.1 Latin America Market, by Components, 2024 – 2033 (USD Billion)
- 11.26 Latin America Market, by Platform, 2024 – 2033
- 11.26.1 Latin America Market, by Platform, 2024 – 2033 (USD Billion)
- 11.27 Latin America Market, by Offerings, 2024 – 2033
- 11.27.1 Latin America Market, by Offerings, 2024 – 2033 (USD Billion)
- 11.28 Latin America Market, by Technology, 2024 – 2033
- 11.28.1 Latin America Market, by Technology, 2024 – 2033 (USD Billion)
- 11.29 Latin America Market, by Application, 2024 – 2033
- 11.29.1 Latin America Market, by Application, 2024 – 2033 (USD Billion)
- 11.30 Latin America Market, by Industrial Vertical, 2024 – 2033
- 11.30.1 Latin America Market, by Industrial Vertical, 2024 – 2033 (USD Billion)
- 11.31. The Middle-East and Africa
- 11.31.1 The Middle-East and Africa Market, 2024 – 2033 (USD Billion)
- 11.31.1.1 The Middle-East and Africa Market, by Country, 2024 – 2033 (USD Billion)
- 11.31.1 The Middle-East and Africa Market, 2024 – 2033 (USD Billion)
- 11.32 The Middle-East and Africa Market, by Components, 2024 – 2033
- 11.32.1 The Middle-East and Africa Market, by Components, 2024 – 2033 (USD Billion)
- 11.33 The Middle-East and Africa Market, by Platform, 2024 – 2033
- 11.33.1 The Middle-East and Africa Market, by Platform, 2024 – 2033 (USD Billion)
- 11.34 The Middle-East and Africa Market, by Offerings, 2024 – 2033
- 11.34.1 The Middle-East and Africa Market, by Offerings, 2024 – 2033 (USD Billion)
- 11.35 The Middle-East and Africa Market, by Technology, 2024 – 2033
- 11.35.1 The Middle-East and Africa Market, by Technology, 2024 – 2033 (USD Billion)
- 11.36 The Middle-East and Africa Market, by Application, 2024 – 2033
- 11.36.1 The Middle-East and Africa Market, by Application, 2024 – 2033 (USD Billion)
- 11.37 The Middle-East and Africa Market, by Industrial Vertical, 2024 – 2033
- 11.37.1 The Middle-East and Africa Market, by Industrial Vertical, 2024 – 2033 (USD Billion)
- Chapter 12. Company Profiles
- 12.1 META
- 12.1.1 Overview
- 12.1.2 Financials
- 12.1.3 Product Portfolio
- 12.1.4 Business Strategy
- 12.1.5 Recent Developments
- 12.2 NVIDIA Corporation
- 12.2.1 Overview
- 12.2.2 Financials
- 12.2.3 Product Portfolio
- 12.2.4 Business Strategy
- 12.2.5 Recent Developments
- 12.3 Epic Games
- 12.3.1 Overview
- 12.3.2 Financials
- 12.3.3 Product Portfolio
- 12.3.4 Business Strategy
- 12.3.5 Recent Developments
- 12.4 Microsoft
- 12.4.1 Overview
- 12.4.2 Financials
- 12.4.3 Product Portfolio
- 12.4.4 Business Strategy
- 12.4.5 Recent Developments
- 12.5 Snap Inc.
- 12.5.1 Overview
- 12.5.2 Financials
- 12.5.3 Product Portfolio
- 12.5.4 Business Strategy
- 12.5.5 Recent Developments
- 12.6 Nextech AR Solutions Inc.
- 12.6.1 Overview
- 12.6.2 Financials
- 12.6.3 Product Portfolio
- 12.6.4 Business Strategy
- 12.6.5 Recent Developments
- 12.7 The Sandbox
- 12.7.1 Overview
- 12.7.2 Financials
- 12.7.3 Product Portfolio
- 12.7.4 Business Strategy
- 12.7.5 Recent Developments
- 12.8 Decentraland
- 12.8.1 Overview
- 12.8.2 Financials
- 12.8.3 Product Portfolio
- 12.8.4 Business Strategy
- 12.8.5 Recent Developments
- 12.9 Roblox Corporation
- 12.9.1 Overview
- 12.9.2 Financials
- 12.9.3 Product Portfolio
- 12.9.4 Business Strategy
- 12.9.5 Recent Developments
- 12.10 Qualcomm Technologies
- 12.10.1 Overview
- 12.10.2 Financials
- 12.10.3 Product Portfolio
- 12.10.4 Business Strategy
- 12.10.5 Recent Developments
- 12.1 META
List Of Figures
Figures No 1 to 58
List Of Tables
Tables No 1 to 152
Report Methodology
In order to get the most precise estimates and forecasts possible, Custom Market Insights applies a detailed and adaptive research methodology centered on reducing deviations. For segregating and assessing quantitative aspects of the market, the company uses a combination of top-down and bottom-up approaches. Furthermore, data triangulation, which examines the market from three different aspects, is a recurring theme in all of our research reports. The following are critical components of the methodology used in all of our studies:
Preliminary Data Mining
On a broad scale, raw market information is retrieved and compiled. Data is constantly screened to make sure that only substantiated and verified sources are taken into account. Furthermore, data is mined from a plethora of reports in our archive and also a number of reputed & reliable paid databases. To gain a detailed understanding of the business, it is necessary to know the entire product life cycle and to facilitate this, we gather data from different suppliers, distributors, and buyers.
Surveys, technological conferences, and trade magazines are used to identify technical issues and trends. Technical data is also gathered from the standpoint of intellectual property, with a focus on freedom of movement and white space. The dynamics of the industry in terms of drivers, restraints, and valuation trends are also gathered. As a result, the content created contains a diverse range of original data, which is then cross-validated and verified with published sources.
Statistical Model
Simulation models are used to generate our business estimates and forecasts. For each study, a one-of-a-kind model is created. Data gathered for market dynamics, the digital landscape, development services, and valuation patterns are fed into the prototype and analyzed concurrently. These factors are compared, and their effect over the projected timeline is quantified using correlation, regression, and statistical modeling. Market forecasting is accomplished through the use of a combination of economic techniques, technical analysis, industry experience, and domain knowledge.
Short-term forecasting is typically done with econometric models, while long-term forecasting is done with technological market models. These are based on a synthesis of the technological environment, legal frameworks, economic outlook, and business regulations. Bottom-up market evaluation is favored, with crucial regional markets reviewed as distinct entities and data integration to acquire worldwide estimates. This is essential for gaining a thorough knowledge of the industry and ensuring that errors are kept to a minimum.
Some of the variables taken into account for forecasting are as follows:
• Industry drivers and constraints, as well as their current and projected impact
• The raw material case, as well as supply-versus-price trends
• Current volume and projected volume growth through 2030
We allocate weights to these variables and use weighted average analysis to determine the estimated market growth rate.
Primary Validation
This is the final step in our report’s estimating and forecasting process. Extensive primary interviews are carried out, both in-person and over the phone, to validate our findings and the assumptions that led to them.
Leading companies from across the supply chain, including suppliers, technology companies, subject matter experts, and buyers, use techniques like interviewing to ensure a comprehensive and non-biased overview of the business. These interviews are conducted all over the world, with the help of local staff and translators, to overcome language barriers.
Primary interviews not only aid with data validation, but also offer additional important insight into the industry, existing business scenario, and future projections, thereby improving the quality of our reports.
All of our estimates and forecasts are validated through extensive research work with key industry participants (KIPs), which typically include:
• Market leaders
• Suppliers of raw materials
• Suppliers of raw materials
• Buyers.
The following are the primary research objectives:
• To ensure the accuracy and acceptability of our data.
• Gaining an understanding of the current market and future projections.
Data Collection Matrix
| Perspective | Primary research | Secondary research |
| Supply-side |
|
|
| Demand-side |
|
|
Market Analysis Matrix
| Qualitative analysis | Quantitative analysis |
|
|
Prominent Players
- META
- NVIDIA Corporation
- Epic Games
- Microsoft
- Snap Inc.
- Nextech AR Solutions Inc.
- The Sandbox
- Decentraland
- Roblox Corporation
- Qualcomm Technologies, Inc.
- Huawei Technologies Co. Ltd
- Tencent Holdings
- Unity Technologies
- Antier Solutions
- Others
FAQs
“North America” region will lead the global Metaverse market during the forecast period 2021 to 2032.
The key factors driving the market are increasing investments of the big market players for the development of metaverse is one of the major driving factors augmenting the growth of this market. Growing adoption of new technologies and the increasing research and developments in the field of metaverse are anticipated to create lucrative opportunities in the years to come. NFT crypto projects, advancement of virtual world in the metaverse, growing popularity of metaverse entertainment events, corporates moving towards this solution, and sophistication of metaverse avatars are a few of the biggest trends of the metaverse market, which have a significant impact on the growth of the market.
The key players operating in the Metaverse market are META, NVIDIA Corporation, Epic Games, Microsoft, Snap Inc., Nextech AR Solutions Inc., The Sandbox, Decentraland, Roblox Corporation, and Qualcomm Technologies, Inc.
The global Metaverse market is expanding growth with a remarkable CAGR of approximately 41.2% during the forecast period (2023 to 2032).
The global Metaverse market size was valued at USD 52.3 Billion in 2021 and it is projected to reach around USD 2,131.6 Billion by 2032.