Passenger Information Display System Market Size, Trends and Insights By Display Type (LCD Display System, LED Display System, Others), By Transportation Mode (Roadways, Airways, Railways), By Component (Hardware, Software, Services), and By Region - Global Industry Overview, Statistical Data, Competitive Analysis, Share, Outlook, and Forecast 2026 – 2035
Report Snapshot
CAGR: 6.2%
| Study Period: | 2026-2035 |
| Fastest Growing Market: | Europe |
| Largest Market: | North America |
Major Players
- ALSTOM
- HITACHI LTD.
- INDRA SISTEMAS, S.A.
- MITSUBISHI ELECTRIC CORPORATION
- Others
Reports Description
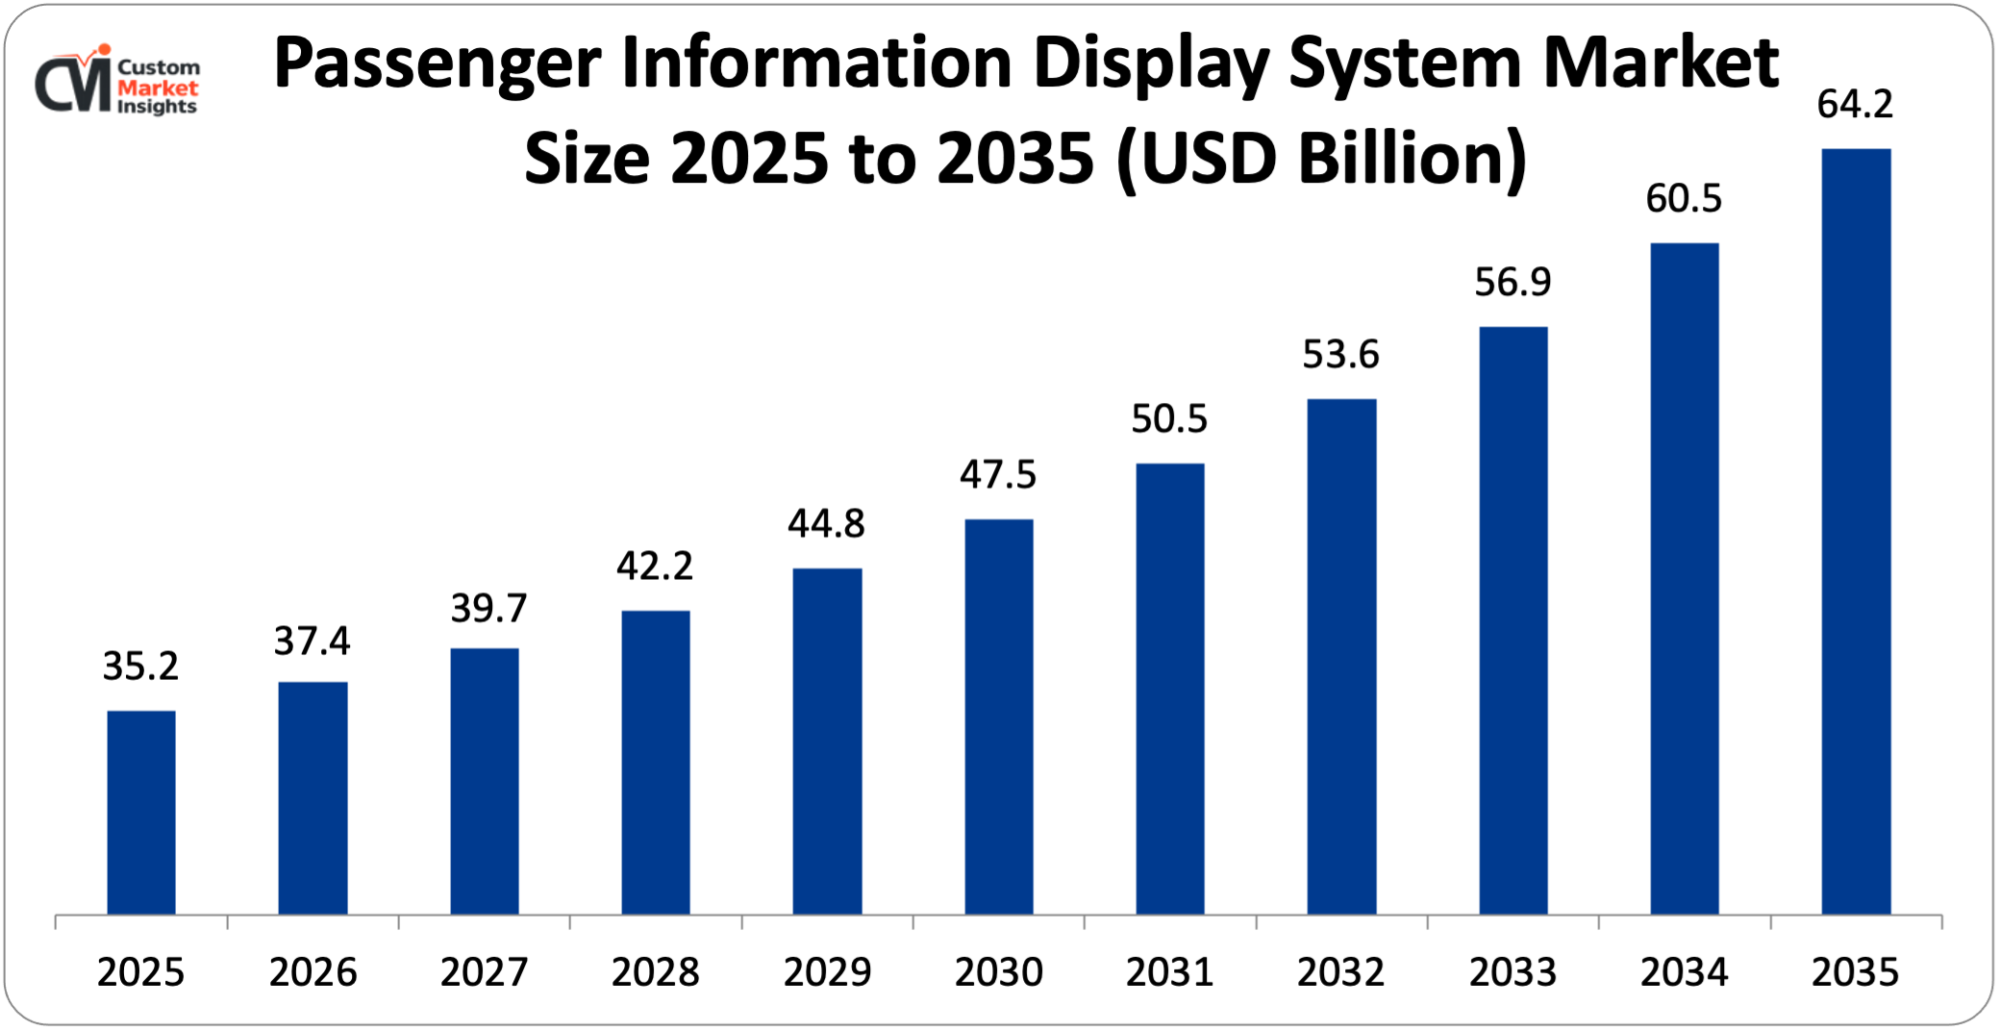
The market size of global passenger information display systems will be estimated at USD 35.2 billion in 2025 and is expected to grow to between USD 37.4 billion in 2026 and about USD 64.2 billion by 2035, with a current CAGR (compound annual growth rate) of 6.2% during the period of 2026 to 2035. A Passenger Information Display System (PIDS) is an electronic system used to disseminate real-time transportation information to the passengers in the station areas of mass transit systems like railways, metros, airports, and bus stations.
It comprises messages and data displayed on digital and LCD or LED screens, the overall software, and integrated controls connected to a transportation control system (TCS). It provides real-time information like the punctual time of arriving or departing, platform, route, and other information, cancellations or emergencies, etc., thus alleviating confusion and offering comfort to the passengers.
Market Highlight
- In 2025, North America will dominate the global market with an estimated market share of 40%. The rising innovative product launch and increasing collaboration among market players drive the regional market growth.
- The Asia Pacific is growing at the highest CAGR over the analysis period. The increasing government initiatives drive the market growth.
- By display type, the LCD Display System is expected to dominate the market with a revenue share of over 42% in 2025.
- By transportation mode, the airways segment captures the largest market share of over 40% in 2025.
Significant Growth Factors
The passenger information display system market trends present significant growth opportunities due to several factors:
- Increasing demand for real-time passenger information: The growing need for real-time passenger information is among the prime factors that are significantly contributing to the growth of the passenger information display system market. The modern-day travelers require real-time and accurate information for their arrivals and departures, delays, substitutions, alterations, route information, and various other tips. The passenger information display systems utilize digital screens as a means of providing real-time information but are linked with global positioning systems, communication networks, and transport management systems. This presents the travelers with better travel planning, reduction of the passenger’s doubt, and overall transit efficiency.
- Rapid urbanization and expansion of public transport: Growing urbanization and the increased development of public transportation are among the leading reasons for the growth of the passenger information display system market. With growing urbanization, the cities are developing to accommodate the increasing population by increasing and upgrading their transportation network infrastructure for metro, bus, railway, and airport systems that are already witnessing a surge in passenger traffic. Such developments are necessitating high communications signals for handling large numbers of travelers and information updates. The passenger information display systems are becoming an essential part of transportation authorities to provide them a means for transmitting real-time schedules, route information, and alerts, thereby increasing the traveler flow and increasing transportation efficiency. For instance, today, the urban share of the world‘s population stands at 55 percent but is expected to reach 68 percent by 2050. New projections indicate that combined urbanization—the slow shift in residence of the human population from rural to urban areas—and population growth might result in the addition of a further 2.5 billion people to urban areas by 2050 with almost 90 percent of this total taking place in Asia and Africa, according to a new United Nations report.
What are the Major Advances Changing the Passenger Information Display System Market Today?
- Integration of AI, IoT, and cloud technologies: The PIDS Market has been revolutionized significantly by the integration and evolution of Artificial Intelligence (AI), the Internet of Things (IoT), and Cloud Technologies, which refer to advanced computing systems that enhance data processing and connectivity. Like ‘Display system’ and ‘Information processing platform,’ these technologies derive and transmit up-to-the-minute data from live sources such as PIDS, networks, vehicles, and traffic. IoT sensors and GPS equipment identify the service/delay status of vehicles. AIT algorithm data is analyzed to detect delays and provide just-in-time information. Cloud-based network infrastructure is used to establish a consolidated network for data sharing in multi-station and multimodal terminals. As a result, travelers receive higher quality, click-on-demand, and dynamic travel data, leading to an improved experience. For instance, in June 2025, ACTIA presented at the SIFER 2025 intriguing ground tools to support the increasing requirements for operational performance and safety in the rail sector. Indeed, the solutions dedicated to ground-based operators are real-time image processing, automatic recognition of objects & humans, passenger counting, on-board and station dynamic content management, and so on. Due to their modularity, these tools are suitable for complex operational environments and provide reliable decision aid data that enhance service quality and improve the travel experience.
- Energy-efficient and smart display technologies: Energy-efficient and intelligent display technologies, which reduce power consumption while providing advanced features, are a strong innovation in the PIDS market. With the evolution of the display technology, most of the new PIDS are gradually replacing conventional display boards with low-power technology, such as LED, E-ink, and solar-powered digital displays, which are cost-effective solutions for reducing energy and operating costs. Besides, the energy-efficient digital display with the ability to operate in outdoor conditions and retain the displayed information even in the event of a power outage is also in demand among the transportation authorities.
Category Wise Insights
By Display Type
Why LCD Display System Hold a Prominent Position in the Market?
The LCD Display System is expected to dominate the market with a revenue share of over 42% in 2025. This segment’s high visibility, reliability, and relatively low operating costs in transportation environments contribute to its growth. The LCD displays are now found in different places, including railway stations, airports, metro stations, and bus terminals, with the contents displaying in alphanumerics, graphics, and time-sensitive travel-related information such as arrival and departure, composition of vehicles, and location of the arriving tram or an enveloped transportation system (ETS) schedule sign. Moreover, the applications of LCD displays in the transportation industry are much easier than other solutions in displaying real-time multilingual content, connecting with centralized control systems, and other intelligent transportation system (ITS) applications. Growing number of transportation networks, an increasing number of inter-urban and intra-urban transportation networks, and a growing need for digital passenger information displays are creating a positive environment for LCD display systems that will continue to be tracked to the high revenue growth of this segment.
The LED Display System segment is growing at the highest CAGR over the analysis period. LED displays offer high brightness, long lifetime, and low power consumption, allowing them to achieve maximum visibility outdoors, even in direct sunshine. They are highly visible to station platforms at railway stations, bus depots, and airports. They have a much longer lifetime and need less maintenance than other types of displays. Updates with up-to-date information and the actual situation are available immediately, and they can interact with centralized transportation management systems. With the demand for high-reliability and high-performance passenger messaging tools from transportation boards, revenue from LED display systems is seen to be steadily growing.
By Transportation Mode
Why Airways Dominates the Passenger Information Display System Market?
The airways segment captures the largest market share of over 40% in 2025. The segment’s growth can be attributed to the growing expansion of airports, with the number of flights and global air passenger traffic on the increase. Airports extensively use passenger information display systems to instantly inform travelers on flight arrivals and departures, gate changes, boarding, and security issues. This also significantly improves the passenger navigation at large airport terminals and helps improve satisfaction. The trend of airport upgrading, modernization of airport infrastructure, and the urge for improved digital signage, coupled with growing usage of automation and information systems, is also encouraging the demand for passenger information display systems in the aviation segment to build up revenues steadily.
The railways segment captures a significant market share of over 30% in 2025. This is a result of the continuous increase in the size and modernization of global rail networks. There is a growing need for effective communication facilities in railway stations to communicate important train information to the passengers in real time, such as the number of trains scheduled, arriving, and departing; platform numbers; delays; and other relevant data, which enables smooth operation of large passenger traffic at the stations. The passenger information display systems aid not only in handling large passenger volumes but also in reducing confusion and enhancing efficiency in the overall travel process. The rising government investments in electrification of smart rail infrastructure, metro projects, high-speed rail projects, and other related projects are further paving the way for development of this segment in terms of revenue.
Report Scope
| Feature of the Report | Details |
| Market Size in 2026 | USD 37.4 billion |
| Projected Market Size in 2035 | USD 64.2 billion |
| Market Size in 2025 | USD 35.2 billion |
| CAGR Growth Rate | 6.2% CAGR |
| Base Year | 2025 |
| Forecast Period | 2026-2035 |
| Key Segment | By Display Type, Transportation Mode, Component and Region |
| Report Coverage | Revenue Estimation and Forecast, Company Profile, Competitive Landscape, Growth Factors and Recent Trends |
| Regional Scope | North America, Europe, Asia Pacific, Middle East & Africa, and South & Central America |
| Buying Options | Request tailored purchasing options to fulfil your requirements for research. |
Regional Analysis
How Big is North America Passenger Information Display System Market Size?
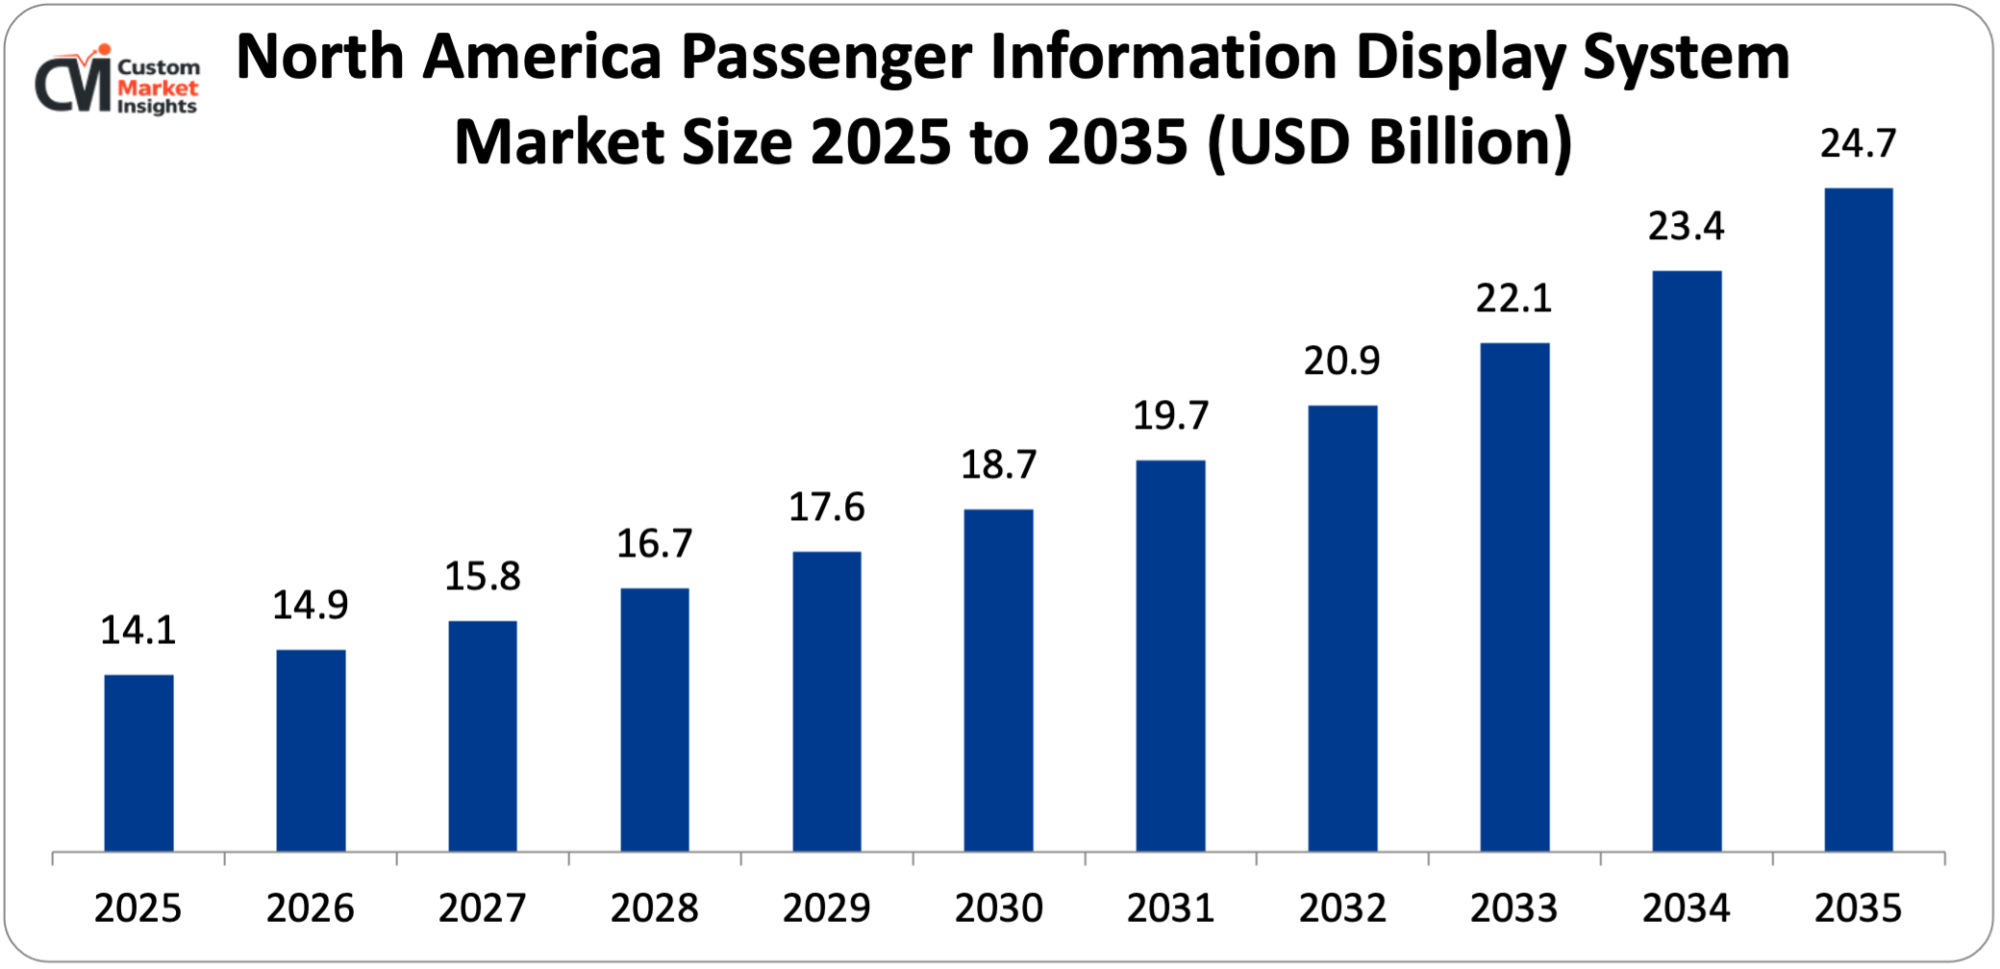
Its market size, in terms of the North American passenger information display system, is projected to be USD 14.1 billion in 2025 with a growth of about USD 24.7 billion in 2035 with a CAGR of 5.8% between 2026 and 2035.
Why did North America Dominate the Passenger Information Display System Market in 2025?
In 2025, North America will dominate the global market with an estimated market share of 40%. Regional growth in the market is attributed to increased urbanization, which has led to more urban migrations and a higher demand for a reliable public transport system that can provide real-time information and manage data effectively. In addition, government programs like Bipartisan infrastructure have driven the market substantially in the region.
US Passenger Information Display System Market Trends
In the North American region, the US leads the industry expansion over the projected period. The market growth in the country is being driven by the technological development in the market that has brought in such features as revolutionized GPS tracking, mobile applications, digital signage, and others for managing passenger access to relevant information in real time. In addition, the focus on safety and security issues is also adding fuel to the market owing to the rising need for emergency alerts and data security.
Why is Europe Experiencing a Significant Growth in the Passenger Information Display System Market?
Europe holds a significant market share in 2025. These factors have accelerated the growth of the market in this region and are the reasons for the integration of smart transportation networks in the PIDS, and the diminishing of the overall market with the introduction of mobility-as-a-service platforms that eased the traffic congestion. Globalization and other financial factors have also positively contributed to the transportation systems in this region.
UK Passenger Information Display System Market Trends
The UK held the dominant position in the market in 2025. Due to a consumer preference for the PIDS market to be tech-savvy, this will have resulted in the diversification of a number of channels, such as mobile applications, on-site displays, and websites, to reach real-time information and avail these services and offers. Moreover, government policies like the government policy “Department for Transport (DTI) Equality Act 2010” have encouraged the growth of the country Market.
Why is the Asia Pacific growing at a rapid rate in the Passenger Information Display System Market?
The Asia Pacific is expected to grow at the highest CAGR over the projected period. This is due to the economic development in the rapidly growing economies, which has increased the demand for PIDS solutions. Further, technological developments like the integration of IoT and AI changed the market by communicating passengers’ information and made possible the demand for context-aware services and personalization to encourage passengers to use the products and services. Further, the electric vehicle revolution is contributing to the growth of the region’s onboard passenger information system market.
China Passenger Information Display System Market Trends
China led the Asia Pacific market. The development of the market in the country is also driven by a growing focus on public safety within the public transport system, the need for more accurate and timely information about journeys, and the demand for systems that provide cost-effective transit schedule updates. Additionally, the desire to reduce carbon emissions has significantly influenced the Chinese PIDS market in recent years.
Why is the Middle East & Africa Region is growing rapidly in the Passenger Information Display System?
The MEA region is growing at a steady rate over the projected period. This growth is due to huge investments in transportation infrastructure and smart mobility initiatives and solutions. Nations are heavily investing in the expansion of new metro systems, railways, and airports to support their burgeoning population and rising tourism industry. PAS and DISS are being installed at metros and large mass transit systems and helping provide real-time information to travelers for better management of passenger flow.
UAE Passenger Information Display System Market Trends
The UAE is growing at the highest CAGR during the forecast period. The growth is owing to the government initiatives focused on smart cities and digital transportation solutions.
Top Players in the Passenger Information Display System Market and Their Offerings
- ALSTOM
- HITACHI LTD.
- INDRA SISTEMAS S.A.
- MITSUBISHI ELECTRIC CORPORATION
- CUBIC CORPORATION
- SINGAPORE TECHNOLOGIES ELECTRONICS LIMITED (ST ENGINEERING)
- TELESTE CORPORATION
- SIEMENS AG
- THALES GROUP
- TOSHIBA CORPORATION
- Lot Group
- Passio Technologies
- Dysten
- Cisco Systems
- Wabtec Corporation
- Others
Key Developments
Passenger information display system market has experienced considerable changes in the last two years as the market players are trying to diversify their technological aspects and develop product portfolios.,..,,,,,,,,,,,,,,,,,,,,,,,,,,,, using strategic approaches.
- In January 2025, CES 2025, the world’s largest technology show currently underway in Las Vegas, continues to be a platform for the latest innovations. Hyundai Mobis has unveiled its ‘holographic windshield display’ technology, which transforms the vehicle’s front windshield into a transparent display. Embedded with this holographic windshield display, Kia’s EV9 is the display vehicle equipped with the new technology for live demonstration to CES 2025 visitors. (https://www.autocarpro.in/news-international/hyundai-mobis-and-zeiss-unveil-holographic-windshield-display-at-ces-2025-124298)
These strategic measures have enabled the companies to reinforce their competitive positions, increase the product line, boost their technological competencies, and also seize growth opportunities in the fast-growing passenger information display system market.
The Passenger Information Display System Market is segmented as follows:
By Display Type
- LCD Display System
- LED Display System
- Others
By Transportation Mode
- Roadways
- Airways
- Railways
By Component
- Hardware
- Software
- Services
Regional Coverage:
North America
- U.S.
- Canada
- Mexico
- Rest of North America
Europe
- Germany
- France
- U.K.
- Russia
- Italy
- Spain
- Netherlands
- Rest of Europe
Asia Pacific
- China
- Japan
- India
- New Zealand
- Australia
- South Korea
- Taiwan
- Rest of Asia Pacific
The Middle East & Africa
- Saudi Arabia
- UAE
- Egypt
- Kuwait
- South Africa
- Rest of the Middle East & Africa
Latin America
- Brazil
- Argentina
- Rest of Latin America
Table of Contents
- Chapter 1. Report Introduction
- 1.1. Report Description
- 1.1.1. Purpose of the Report
- 1.1.2. USP & Key Offerings
- 1.2. Key Benefits For Stakeholders
- 1.3. Target Audience
- 1.4. Report Scope
- 1.1. Report Description
- Chapter 2. Market Overview
- 2.1. Report Scope (Segments And Key Players)
- 2.1.1. Passenger Information Display System by Segments
- 2.1.2. Passenger Information Display System by Region
- 2.2. Executive Summary
- 2.2.1. Market Size & Forecast
- 2.2.2. Passenger Information Display System Market Attractiveness Analysis, By Display Type
- 2.2.3. Passenger Information Display System Market Attractiveness Analysis, By Transportation Mode
- 2.2.4. Passenger Information Display System Market Attractiveness Analysis, By Component
- 2.1. Report Scope (Segments And Key Players)
- Chapter 3. Market Dynamics (DRO)
- 3.1. Market Drivers
- 3.1.1. Increasing demand for real-time passenger information
- 3.1.2. Rapid urbanization and expansion of public transport
- 3.2. Market Restraints
- 3.3. Market Opportunities
- 3.5. Pestle Analysis
- 3.6. Porter’s Forces Analysis
- 3.7. Technology Roadmap
- 3.8. Value Chain Analysis
- 3.9. Government Policy Impact Analysis
- 3.10. Pricing Analysis
- 3.1. Market Drivers
- Chapter 4. Passenger Information Display System Market – By Display Type
- 4.1. Display Type Market Overview, By Display Type Segment
- 4.1.1. Passenger Information Display System Market Revenue Share, By Display Type, 2025 & 2035
- 4.1.2. LCD Display System
- 4.1.3. Passenger Information Display System Share Forecast, By Region (USD Billion)
- 4.1.4. Comparative Revenue Analysis, By Country, 2025 & 2035
- 4.1.5. Key Market Trends, Growth Factors, & Opportunities
- 4.1.6. LED Display System
- 4.1.7. Passenger Information Display System Share Forecast, By Region (USD Billion)
- 4.1.8. Comparative Revenue Analysis, By Country, 2025 & 2035
- 4.1.9. Key Market Trends, Growth Factors, & Opportunities
- 4.1.10. Others
- 4.1.11. Passenger Information Display System Share Forecast, By Region (USD Billion)
- 4.1.12. Comparative Revenue Analysis, By Country, 2025 & 2035
- 4.1.13. Key Market Trends, Growth Factors, & Opportunities
- 4.1. Display Type Market Overview, By Display Type Segment
- Chapter 5. Passenger Information Display System Market – By Transportation Mode
- 5.1. Transportation Mode Market Overview, By Transportation Mode Segment
- 5.1.1. Passenger Information Display System Market Revenue Share, By Transportation Mode, 2025 & 2035
- 5.1.2. Roadways
- 5.1.3. Passenger Information Display System Share Forecast, By Region (USD Billion)
- 5.1.4. Comparative Revenue Analysis, By Country, 2025 & 2035
- 5.1.5. Key Market Trends, Growth Factors, & Opportunities
- 5.1.6. Airways
- 5.1.7. Passenger Information Display System Share Forecast, By Region (USD Billion)
- 5.1.8. Comparative Revenue Analysis, By Country, 2025 & 2035
- 5.1.9. Key Market Trends, Growth Factors, & Opportunities
- 5.1.10. Railways
- 5.1.11. Passenger Information Display System Share Forecast, By Region (USD Billion)
- 5.1.12. Comparative Revenue Analysis, By Country, 2025 & 2035
- 5.1.13. Key Market Trends, Growth Factors, & Opportunities
- 5.1. Transportation Mode Market Overview, By Transportation Mode Segment
- Chapter 6. Passenger Information Display System Market – By Component
- 6.1. Component Market Overview, By Component Segment
- 6.1.1. Passenger Information Display System Market Revenue Share, By Component, 2025 & 2035
- 6.1.2. Hardware
- 6.1.3. Passenger Information Display System Share Forecast, By Region (USD Billion)
- 6.1.4. Comparative Revenue Analysis, By Country, 2025 & 2035
- 6.1.5. Key Market Trends, Growth Factors, & Opportunities
- 6.1.6. Software
- 6.1.7. Passenger Information Display System Share Forecast, By Region (USD Billion)
- 6.1.8. Comparative Revenue Analysis, By Country, 2025 & 2035
- 6.1.9. Key Market Trends, Growth Factors, & Opportunities
- 6.1.10. Services
- 6.1.11. Passenger Information Display System Share Forecast, By Region (USD Billion)
- 6.1.12. Comparative Revenue Analysis, By Country, 2025 & 2035
- 6.1.13. Key Market Trends, Growth Factors, & Opportunities
- 6.1. Component Market Overview, By Component Segment
- Chapter 7. Passenger Information Display System Market – Regional Analysis
- 7.1. Passenger Information Display System Market Overview, By Region Segment
- 7.1.1. Global Passenger Information Display System Market Revenue Share, By Region, 2025 & 2035
- 7.1.2. Global Passenger Information Display System Market Revenue, By Region, 2026 – 2035 (USD Billion)
- 7.1.3. Global Passenger Information Display System Market Revenue, By Display Type, 2026 – 2035
- 7.1.4. Global Passenger Information Display System Market Revenue, By Transportation Mode, 2026 – 2035
- 7.1.5. Global Passenger Information Display System Market Revenue, By Component, 2026 – 2035
- 7.2. North America
- 7.2.1. North America Passenger Information Display System Market Revenue, By Country, 2026 – 2035 (USD Billion)
- 7.2.2. North America Passenger Information Display System Market Revenue, By Display Type, 2026 – 2035
- 7.2.3. North America Passenger Information Display System Market Revenue, By Transportation Mode, 2026 – 2035
- 7.2.4. North America Passenger Information Display System Market Revenue, By Component, 2026 – 2035
- 7.2.5. U.S. Passenger Information Display System Market Revenue, 2026 – 2035 (USD Billion)
- 7.2.6. Canada Passenger Information Display System Market Revenue, 2026 – 2035 (USD Billion)
- 7.2.7. Mexico Passenger Information Display System Market Revenue, 2026 – 2035 (USD Billion)
- 7.2.8. Rest of North America Passenger Information Display System Market Revenue, 2026 – 2035 (USD Billion)
- 7.3. Europe
- 7.3.1. Europe Passenger Information Display System Market Revenue, By Country, 2026 – 2035 (USD Billion)
- 7.3.2. Europe Passenger Information Display System Market Revenue, By Display Type, 2026 – 2035
- 7.3.3. Europe Passenger Information Display System Market Revenue, By Transportation Mode, 2026 – 2035
- 7.3.4. Europe Passenger Information Display System Market Revenue, By Component, 2026 – 2035
- 7.3.5. Germany Passenger Information Display System Market Revenue, 2026 – 2035 (USD Billion)
- 7.3.6. France Passenger Information Display System Market Revenue, 2026 – 2035 (USD Billion)
- 7.3.7. U.K. Passenger Information Display System Market Revenue, 2026 – 2035 (USD Billion)
- 7.3.8. Russia Passenger Information Display System Market Revenue, 2026 – 2035 (USD Billion)
- 7.3.9. Italy Passenger Information Display System Market Revenue, 2026 – 2035 (USD Billion)
- 7.3.10. Spain Passenger Information Display System Market Revenue, 2026 – 2035 (USD Billion)
- 7.3.11. Netherlands Passenger Information Display System Market Revenue, 2026 – 2035 (USD Billion)
- 7.3.12. Rest of Europe Passenger Information Display System Market Revenue, 2026 – 2035 (USD Billion)
- 7.4. Asia Pacific
- 7.4.1. Asia Pacific Passenger Information Display System Market Revenue, By Country, 2026 – 2035 (USD Billion)
- 7.4.2. Asia Pacific Passenger Information Display System Market Revenue, By Display Type, 2026 – 2035
- 7.4.3. Asia Pacific Passenger Information Display System Market Revenue, By Transportation Mode, 2026 – 2035
- 7.4.4. Asia Pacific Passenger Information Display System Market Revenue, By Component, 2026 – 2035
- 7.4.5. China Passenger Information Display System Market Revenue, 2026 – 2035 (USD Billion)
- 7.4.6. Japan Passenger Information Display System Market Revenue, 2026 – 2035 (USD Billion)
- 7.4.7. India Passenger Information Display System Market Revenue, 2026 – 2035 (USD Billion)
- 7.4.8. New Zealand Passenger Information Display System Market Revenue, 2026 – 2035 (USD Billion)
- 7.4.9. Australia Passenger Information Display System Market Revenue, 2026 – 2035 (USD Billion)
- 7.4.10. South Korea Passenger Information Display System Market Revenue, 2026 – 2035 (USD Billion)
- 7.4.11. Taiwan Passenger Information Display System Market Revenue, 2026 – 2035 (USD Billion)
- 7.4.12. Rest of Asia Pacific Passenger Information Display System Market Revenue, 2026 – 2035 (USD Billion)
- 7.5. The Middle-East and Africa
- 7.5.1. The Middle-East and Africa Passenger Information Display System Market Revenue, By Country, 2026 – 2035 (USD Billion)
- 7.5.2. The Middle-East and Africa Passenger Information Display System Market Revenue, By Display Type, 2026 – 2035
- 7.5.3. The Middle-East and Africa Passenger Information Display System Market Revenue, By Transportation Mode, 2026 – 2035
- 7.5.4. The Middle-East and Africa Passenger Information Display System Market Revenue, By Component, 2026 – 2035
- 7.5.5. Saudi Arabia Passenger Information Display System Market Revenue, 2026 – 2035 (USD Billion)
- 7.5.6. UAE Passenger Information Display System Market Revenue, 2026 – 2035 (USD Billion)
- 7.5.7. Egypt Passenger Information Display System Market Revenue, 2026 – 2035 (USD Billion)
- 7.5.8. Kuwait Passenger Information Display System Market Revenue, 2026 – 2035 (USD Billion)
- 7.5.9. South Africa Passenger Information Display System Market Revenue, 2026 – 2035 (USD Billion)
- 7.5.10. Rest of the Middle East & Africa Passenger Information Display System Market Revenue, 2026 – 2035 (USD Billion)
- 7.6. Latin America
- 7.6.1. Latin America Passenger Information Display System Market Revenue, By Country, 2026 – 2035 (USD Billion)
- 7.6.2. Latin America Passenger Information Display System Market Revenue, By Display Type, 2026 – 2035
- 7.6.3. Latin America Passenger Information Display System Market Revenue, By Transportation Mode, 2026 – 2035
- 7.6.4. Latin America Passenger Information Display System Market Revenue, By Component, 2026 – 2035
- 7.6.5. Brazil Passenger Information Display System Market Revenue, 2026 – 2035 (USD Billion)
- 7.6.6. Argentina Passenger Information Display System Market Revenue, 2026 – 2035 (USD Billion)
- 7.6.7. Rest of Latin America Passenger Information Display System Market Revenue, 2026 – 2035 (USD Billion)
- 7.1. Passenger Information Display System Market Overview, By Region Segment
- Chapter 8. Competitive Landscape
- 8.1. Company Market Share Analysis – 2025
- 8.1.1. Global Passenger Information Display System Market: Company Market Share, 2025
- 8.2. Global Passenger Information Display System Market Company Market Share, 2024
- 8.1. Company Market Share Analysis – 2025
- Chapter 9. Company Profiles
- 9.1. ALSTOM
- 9.1.1. Company Overview
- 9.1.2. Key Executives
- 9.1.3. Product Portfolio
- 9.1.4. Financial Overview
- 9.1.5. Operating Business Segments
- 9.1.6. Business Performance
- 9.1.7. Recent Developments
- 9.2. HITACHI LTD.
- 9.3. INDRA SISTEMAS S.A.
- 9.4. MITSUBISHI ELECTRIC CORPORATION
- 9.5. CUBIC CORPORATION
- 9.6. SINGAPORE TECHNOLOGIES ELECTRONICS LIMITED (ST ENGINEERING)
- 9.7. TELESTE CORPORATION
- 9.8. SIEMENS AG
- 9.9. THALES GROUP
- 9.10. TOSHIBA CORPORATION
- 9.11. Lot Group
- 9.12. Passio Technologies
- 9.13. Dysten
- 9.14. Cisco Systems
- 9.15. Wabtec Corporation
- 9.16. Others.
- 9.1. ALSTOM
- Chapter 10. Research Methodology
- 10.1. Research Methodology
- 10.2. Secondary Research
- 10.3. Primary Research
- 10.3.1. Analyst Tools and Models
- 10.4. Research Limitations
- 10.5. Assumptions
- 10.6. Insights From Primary Respondents
- 10.7. Why Custom Market Insights
- Chapter 11. Standard Report Commercials & Add-Ons
- 11.1. Customization Options
- 11.2. Subscription Module For Market Research Reports
- 11.3. Client Testimonials
List Of Figures
Figures No 1 to 25
List Of Tables
Tables No 1 to 46
Prominent Player
- ALSTOM
- HITACHI LTD.
- INDRA SISTEMAS S.A.
- MITSUBISHI ELECTRIC CORPORATION
- CUBIC CORPORATION
- SINGAPORE TECHNOLOGIES ELECTRONICS LIMITED (ST ENGINEERING)
- TELESTE CORPORATION
- SIEMENS AG
- THALES GROUP
- TOSHIBA CORPORATION
- Lot Group
- Passio Technologies
- Dysten
- Cisco Systems
- Wabtec Corporation
- Others
FAQs
The key players in the market are ALSTOM, HITACHI LTD., INDRA SISTEMAS S.A., MITSUBISHI ELECTRIC CORPORATION, CUBIC CORPORATION, SINGAPORE TECHNOLOGIES ELECTRONICS LIMITED (ST ENGINEERING), TELESTE CORPORATION, SIEMENS AG, THALES GROUP, TOSHIBA CORPORATION, Lot Group, Passio Technologies, Dysten, Cisco Systems, Wabtec Corporation, Others.
Government regulations have a key influence on the growth of the passenger information display system market by implementing the modernization and digitalization of transportation infrastructure. Government regulations require real-time passenger information systems by improving transportation efficiency, passenger safety, and accessibility. Regulatory policies around the development of smart cities, public transport operation standards, and accessibility for disabled people are also spurring the installation of new advanced display devices. Besides, government funding and infrastructure development of railways, airports, and urban transit systems are boosting the passenger information display system market.
Pricing will be one of the most critical factors affecting the growth of the passenger information display system market. The cost of digital displays, software integration, and a network system may reduce the appeal of PIDS to smaller transportation operators and developing geographies where the funding availability is limited. As display technology prices, LED and LCD costs, become less expensive and scalable, urban transportation authorities will be able to expand PIDS systems to buses, stations, airports, and bus terminals. Competitive prices and operational savings will make Passenger Information Display Systems a financially sound long-term investment.
According to the present analysis and forecast modeling, the market of Passenger Information Display Systems will witness a significant growth of about USD 64.2 billion in the year 2035 with the growing innovative product launch, increasing investment in advanced technology, and growing urbanization with a CAGR of 6.2% between the years 2026 and 2035.
It is projected that North America will hold the largest market share in the Passenger Information Display System market in the forecast period, with a share of about 40% of the global market share, which is attributed to the presence of major players and increasing technological advancements.
The Asia Pacific is expected to grow at the highest CAGR during the forecast period. The growth in the region is owing to the rising government initiatives and increasing urbanization.
Market growth of Passenger Information Display Systems is mainly driven by growing demand for real-time information for passengers and increasing growth in urbanization and public transport means like railways, metros, airports, and buses.