Refurbished and Used Mobile Phones Market Size, Trends and Insights By Type (Refurbished Phones, Used Phones), By Price Point (Low-priced Refurbished and Used Mobile Phones (Less than $200), Mid-Priced Refurbished and Used Mobile Phones ($200-$500), Premium Refurbished and Used Mobile Phones (More than $500)), and By Region - Global Industry Overview, Statistical Data, Competitive Analysis, Share, Outlook, and Forecast 2026 – 2035
Report Snapshot
CAGR: 22.6%
| Study Period: | 2026-2035 |
| Fastest Growing Market: | North America |
| Largest Market: | Asia Pacific |
Major Players
- Cisco Systems Inc.
- Palo Alto Networks Inc.
- CrowdStrike Holdings Inc.
- Fortinet Inc.
- Others
Reports Description
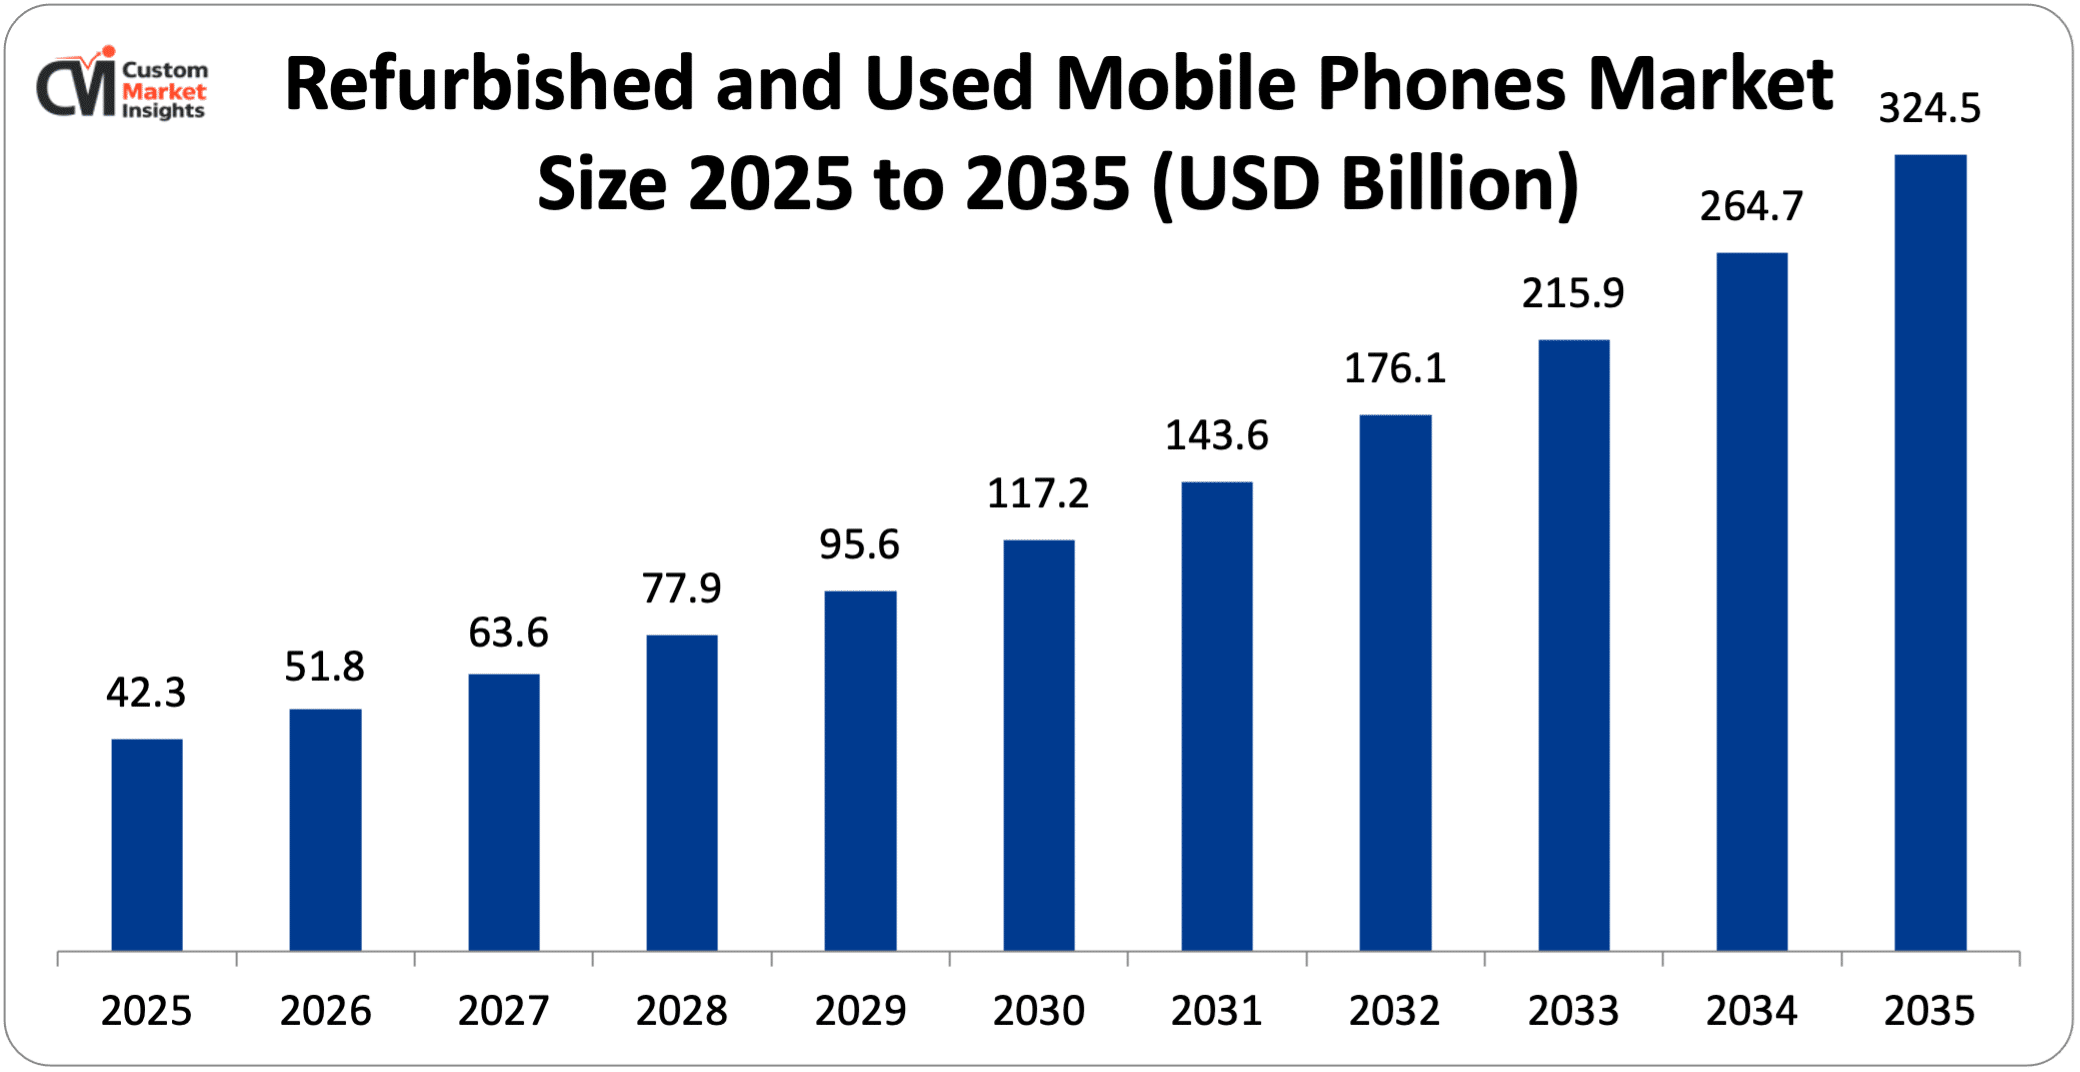
The market size of global refurbished and used mobile phones will be estimated at USD 42.3 billion in 2025 and is expected to grow to between USD 51.8 billion in 2026 and about USD 324.5 billion by 2035, with a current CAGR (compound annual growth rate) of 22.6% during the period of 2026 to 2035. The used and refurbished mobile phone industry is a sub-sector of the mobile device industry in which mobile handsets are resold on the market after previous use for a limited or full time, inspection, and reconditioning, and the reasons for such resale are consumer-based.
They are mobile phones being resold in the condition in which they were owned by previous owner(s) without repairs and not certified, whereas the refurbished mobile phone has undergone inspection, testing, component replacement, and data wipe; is equipped with a grade; and often boasts a warranty along with it being resold when performed by the original manufacturer or a professional refurbisher. The most prevalent reasons for the used and refurbished mobile phone industry are consumer demand for cheaper alternatives to buying new mobile phones and also consumer support of the reuse culture by extending the life of products and reducing electronic waste.
Market Highlight
- In 2025, the Asia Pacific will dominate the global market with an estimated market share of 39%. The increasing demand for smartphones.
- North America is growing at the highest rate over the analysis period. The increasing internet penetration drives the regional growth.
- By type, the refurbished phones segment dominated the industry in 2025 with over 62%.
- By price point, the mid-priced refurbished and used mobile phones ($200-$500) segment captures the largest market share in 2025 of over 45%.
Significant Growth Factors
The refurbished and used mobile phones market trends present significant growth opportunities due to several factors:
- Rising Demand for Affordable Smartphones: Increased demand for low-cost mobile devices is a key contributor to market growth in the refurbished and used mobile market. Ever-increasing prices of mobile phones (especially flagship devices) are making a large chunk of potential consumers shift towards refurbished handsets, which provide the same features and brand image at a much lower price. This trend is observed more among students, first-time users, and middle-income groups, who seek high-end smartphones for less money. The number of enhanced technologies, including high-priced camera lenses and quicker-paced processors, is accessible to all segments of society by choosing refurbished items, which previously were available only to specific sections of society. In addition, in emerging markets where mobile prices are still on the rise and the market for smart devices is in its growth stage, less expensive used devices help in growth acceleration.
- High Demand for Premium and Recent Models: The demand for premium and current smartphone models is another important factor for growth within the refurbished and used mobile phones market. Consumers are now increasingly wishing to own higher-end smart devices that have premium features such as better-quality camera resolutions or greater processing speeds or higher-quality displays while at the same time not being willing to actually fund a purchase of said device due to the excessive cost. Refurbished devices, which are typically 1–3 years old, offer users an almost-new product that features the latest technological advances from the manufacturer at a low relative cost, thus making the products more attractive to younger users who are more likely to be technologically savvy consumers. Along with this, the recent and almost-glowing reviews that current flagship devices receive ensure that there is a constant stream of relatively new second-hand devices available on the secondary market, thus keeping demand high.
What are the Major Advances Changing the Refurbished and Used Mobile Phones Market Today?
- AI-powered Diagnostics and Automated Refurbishment: AI-enabled diagnostics and automation in the refurbishment process are the most important innovations in the used or refurbished mobile phone product markets. They can accurately pinpoint the hardware & software problem, test battery capacity, and grade accordingly and perform other critical product assessment tasks within a few seconds thanks to the machine learning solutions versus hours to days with manual work. Automation cuts down on the amount of manual work in the testing, repairing, and wiping processes drastically, saving cost and time to turn around a multitude of handsets while maintaining quality standards.
- Sustainability and Circular Economy Innovations: Innovations in sustainability and circular economy are enabling growth in the refurbished and used mobile phone market. Surging global concerns about electronic waste and exhaustion of resources are prompting governments and consumers alike to opt for reuse and recycling alternatives to disposal. Refurbished mobile phones have a lower lifespan than the total equipment lifespan; however, such additional usage time has a direct correlation to lower extraction of virgin resources and avoided carbon emissions. This results in a reduction in total environmental impact from the production of new smartphone equipment. This trend can be seen in the adoption of multiple new circular business models by organizations such as take-back and resale platforms and refurbishment and repair services to increase repurposing and lifespan. Growing awareness and focus on sustainability have enhanced reputation and profitability for organizations as well as demand from consumers, bolstering the refurbished smartphones market size.
Category Wise Insights
By Type
Why Refurbished Phones Hold a Prominent Position in the Market
The refurbished phones segment dominated the industry in 2025 of over 62%. Refurbished (restored) mobile phones have been used (by end users) but professionally restored in the manufacturer’s or supplier’s hands to the highest standards and repackaged by the manufacturer or an approved refurbisher. The refurbishment process involves diagnosed repair, testing, component replacement, high-quality cosmetic repairs, loading of the latest software, and general acceptance testing before the phones are resold to the consumer. The strength in this segment is owned by quality assurance, saving cost against new and improved productivity & assurance; other benefits to the customer are some forms of warranty that reduce the risk of purchase of the used in the eyes of the customer. Institutional and corporate users purchase certified phones that fit in with their corporate device management, security, and standards set up. New premium trade-ins resulting from faster adoption rates in the developed countries play a volume role in this segment for refurbishers, and the choice of models under this segment continues to increase. The OEMs’ outsourcing over time has upped quality standards in this segment.
The used phones segment is growing at the highest CAGR during the forecast period. In terms of growth, it is the most affordable option for targeted groups ranging from consumers demanding basic to mid-range smartphone applications, in comparison to reconditioned devices, which are sold with many repairs done to them. Used phones are mostly disposed of in the condition they were received in with little or no reparations carried out and are hence a lot cheaper and hence more available, especially in cost-sensitive and expanding markets such as India, Africa, and Southeast Asia. Growth will potentially be driven by penetration rates of smart phones and increasing usage of digital connectivity applications.
By Price Point
Why Mid-Priced Refurbished and Used Mobile Phones ($200-$500) Capture the Highest Market Share in the Refurbished and Used Mobile Phones Market?
The mid-priced refurbished and used mobile phones ($200-$500) segment captures the largest market share in 2025 of over 45%. The mid-price segment remains the most strategically important area in the used/refurbished mobile phone industry because of the drastic savings involved, coupled with an ever-increasing high-specification, brand-new device portfolio. Included within this segment are the newest generation high-end devices from all of the major device manufacturers’ generous specification smartphones, offering customers within the rapidly expanding Smartphone community an affordable and dependable reference point into the world of high-end mobile device operation.
The mid-price segment is effective in emerging/developing markets where high-income consumers upgrade and knock-on runoffs from retail sales are readily available for re-entry into the secondary market and in mature territories where consumers are vying for flagship specifications at a more achievable resale price than in traditional high-end retail channels. This has been supported by the delivery of near-new devices into the secondary market on an ongoing basis following device upgrades by high-income consumers, as well as increased investment into quality assurance programs by retailers and e-commerce providers so as to build subsequent consumer loyalty to used/refurbished devices.
The premium refurbished and used mobile phones (more than $500) segment is growing at a rapid rate over the projected period. Every day, more people buy high-end phones instead of mid- and low-end ones, and they prefer to buy refurbished high-end smartphones. As the recent prices of flagship devices increase, people buy refurbished high-end devices that have the same characteristics (high-performance architecture, camera systems, and screens), but they’re cheaper. And they prefer it because they want a higher-performance device than those of the midrange.
Report Scope
| Feature of the Report | Details |
| Market Size in 2026 | USD 51.8 billion |
| Projected Market Size in 2035 | USD 324.5 billion |
| Market Size in 2025 | USD 42.3 billion |
| CAGR Growth Rate | 22.6% CAGR |
| Base Year | 2025 |
| Forecast Period | 2026-2035 |
| Key Segment | By Type, Price Point and Region |
| Report Coverage | Revenue Estimation and Forecast, Company Profile, Competitive Landscape, Growth Factors and Recent Trends |
| Regional Scope | North America, Europe, Asia Pacific, Middle East & Africa, and South & Central America |
| Buying Options | Request tailored purchasing options to fulfil your requirements for research. |
Regional Analysis
How Big is the Asia Pacific Refurbished and Used Mobile Phones Market Size?
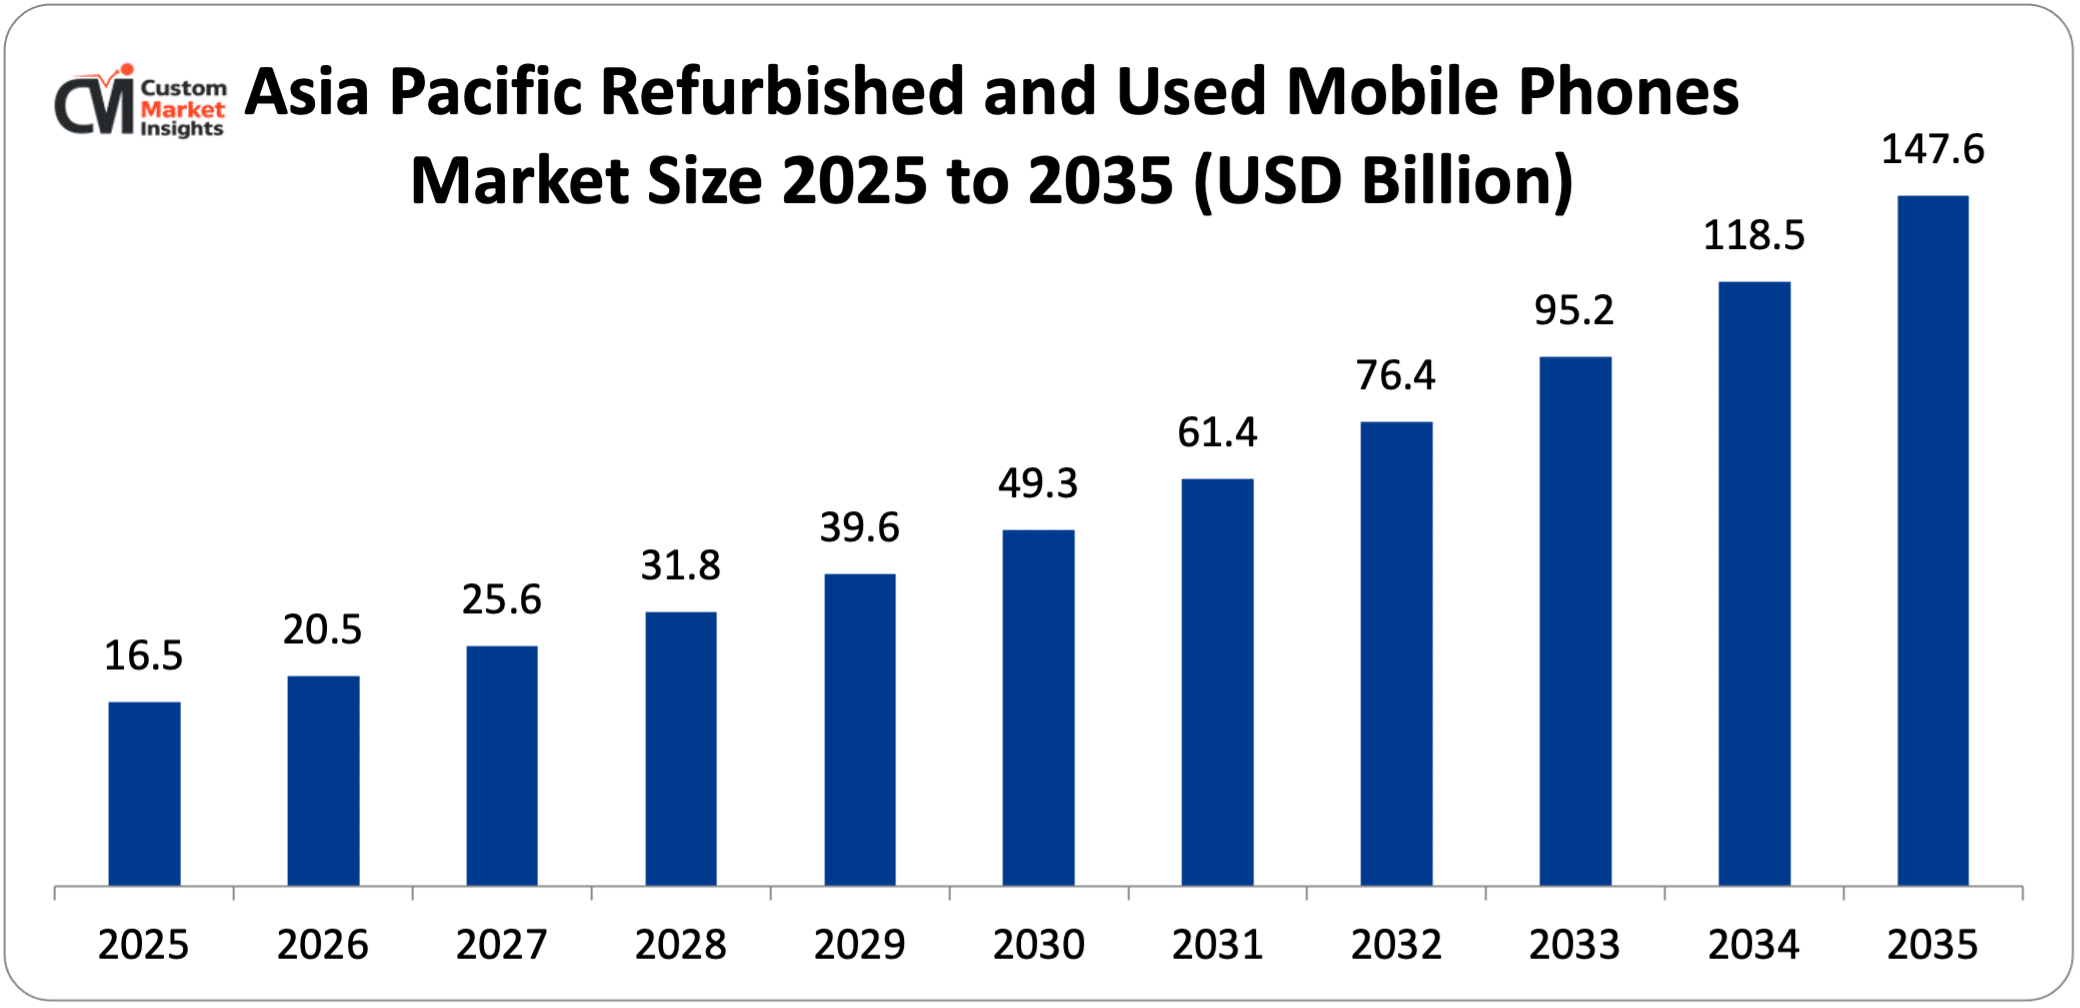
Its market size, in terms of the Asia Pacific refurbished and used mobile phones, is projected to be USD 16.5 billion in 2025 with a growth of about USD 147.6 billion in 2035 with a CAGR of 24.5% between 2026 and 2035.
Why did the Asia Pacific Dominate the Refurbished and Used Mobile Phones Market in 2025?
In 2025, the Asia Pacific will dominate the global market with an estimated market share of 39%. This will be complemented by high availability of pre-owned mobile devices with high penetration, a large population base, and high price elasticities. Regions such as India, China, and the rest of Southeast Asia will aid the growth, as an emerging middle class will demand affordable alternatives rather than high-end, expensive new devices. Increasing levels of digitalization, Internet usage, and mobile usage for work, research, and leisure will provide tailwinds to demand. A mature and widespread informal secondary resale network, organized online retail promoting warranty-supported affordable second-hand devices, will aid in building customer trust. Trade-in, transition to higher end, and onward migration to newer versions will ensure entry of newer models into the secondary markets.
India Refurbished and Used Mobile Phones Market Trends
In the Asia Pacific region, India leads the industry expansion over the projected period. This momentum is being driven by high price elasticity of demand, a large young populace, and quickly expanding digital adoption. Across markets in India, higher pricing of a new device has created a shift in demand to affordable end technology devices such as popular pre-owned and refurbished devices, especially among students, first-time users, and the middle-income consumer base. The Government initiatives towards digital inclusion and ever-increasing internet penetration and affordable data plans are also quickening the smartphone penetration in the markets.
Why is Europe Experiencing a Significant Growth in the Refurbished and Used Mobile Phone Market?
Europe holds a significant market share in 2025. Growth is driven by a maturing regulatory environment, an ingrained sustainability culture, and a well-developed secondary device ecosystem. Significantly, Strong regulatory momentum behind circular economy concepts has created an enabling environment for the sector. For example, European governments are mandating longer product lifetimes, minimum repairability standards, and spare part availability for consumer electronics, allowing the refurbishment industry to develop in a supportive environment. The result has been a lower production cost and increased lifespan for refurbished electronics and, in turn, greater consumer confidence in the performance and durability of pre-owned devices. Environmental concerns are driving European consumers to actively seek out refurbished smartphone devices as a tangible cost-effective measure to reduce e-waste.
Germany Refurbished and Used Mobile Phones Market Trends
Germany held the dominant position in the market in 2025. This is driven by mature refurbishment networks, developed e-commerce channels, and an increasing institutional procurement of certified pre-owned devices. The development of manufacturer-certified programs across the continent has bolstered the quality circle and brought in new types of consumers, such as environmentally conscious buyers and those seeking cost-effective alternatives to new devices.
Why is North America Growing at a Highest rate in the Refurbished and Used Mobile Phones Market?
North America is expected to grow at the highest rate over the projected period. North America is the top market in the world for used and refurbished phones, thanks to high spending on quality certified products, a strong trade-in system run by major US carriers, and a growing number of refurbished devices from companies focusing on sustainability and ESG programs. Canada and the USA offer a mature, dual-train supply chain of premium used inventory driven by frequent flagship refresh cycles among affluent end users who routinely trade in premium phones for the latest device. Wide selection of carrier and OEM-certified acquisition channels offers consumers and key account buyers identical quality, support, and warranties to new devices. Increasingly, corporate ESG mandates are inspiring enterprise procurement of refurbished devices to decouple Scope 3 emissions from end-user device management within hardware budgets.
US Refurbished and Used Mobile Phones Market Trends
The US holds the prominent market share in the industry. This growth is underpinned by an extensive and varied arsenal of carrier-supported trade-in schemes, OEM-approved retail channels, and third-party re-selling sites.
Why is the Middle East & Africa Region is growing rapidly in the Refurbished and Used Mobile Phones?
The MEA region is growing at a steady rate over the projected period. Smartphones, economic diversification, and the rising demand for inexpensive devices are also fueling the growth. In the United Arab Emirates, Nigeria, South Africa, and Saudi Arabia, for instance, there is a rising number of tech-savvy young consumers demanding low-cost alternatives to high-end, brand-new devices. Large customer base of price-sensitive consumers in countries in Africa is playing a vital role in spurring up demand for these used devices, complemented by rising availability of certified refurbished phones in more developed Middle Eastern markets, enhancing pricing reliability.
UAE Refurbished and Used Mobile Phones Market Trends
The UAE is growing at the highest CAGR during the forecast period. The increasing investment in advanced technology drives the market growth.
Top Players in the Refurbished and Used Mobile Phones Market and Their Offerings
- Cisco Systems Inc.
- Palo Alto Networks Inc.
- CrowdStrike Holdings Inc.
- Check Point Software Technologies
- Fortinet Inc.
- Microsoft Corporation
- McAfee Corp.
- Trend Micro Incorporated
- Qualys Inc.
- Apple Inc.
- Samsung Electronics Co. Ltd.
- Amazon.com Inc.
- Huawei Technologies Co. Ltd.
- Microsoft Corporation
- LG Electronics Inc.
- Lenovo Group Limited
- Xiaomi Corporation
- Sony Corporation
- Oppo Electronics Corp.
- Vivo Communication Technology Co. Ltd.
- ZTE Corporation
- Motorola Solutions Inc.
- Google LLC
- TCL Technology
- OnePlus Technology Co. Ltd.
- BLU Products Inc.
- InFocus Corporation
- Nokia Corporation
- AsusTek Computer Inc.
- Others
Key Developments
Refurbished and used mobile phone market has experienced considerable changes in the last two years as the market players are trying to diversify their technological aspects and develop product portfolios using strategic approaches.
- In January 2025, Samsung Electronics launched the New Galaxy AI Subscription Club, which offers up to a 50% refund on used smartphones. Subscribers can return their Galaxy S25 series devices after 12 months for a 50% refund or after 24 months for a 40% refund, making premium devices more affordable.
These strategic measures have enabled the companies to reinforce their competitive positions, increase the product line, boost their technological competencies, and also seize growth opportunities in the fast-growing refurbished and used mobile phones market.
The Refurbished and Used Mobile Phones Market is segmented as follows:
By Type
- Refurbished Phones
- Used Phones
By Price Point
- Low-priced Refurbished and Used Mobile Phones (Less than $200)
- Mid-Priced Refurbished and Used Mobile Phones ($200-$500)
- Premium Refurbished and Used Mobile Phones (More than $500)
Regional Coverage:
North America
- U.S.
- Canada
- Mexico
- Rest of North America
Europe
- Germany
- France
- U.K.
- Russia
- Italy
- Spain
- Netherlands
- Rest of Europe
Asia Pacific
- China
- Japan
- India
- New Zealand
- Australia
- South Korea
- Taiwan
- Rest of Asia Pacific
The Middle East & Africa
- Saudi Arabia
- UAE
- Egypt
- Kuwait
- South Africa
- Rest of the Middle East & Africa
Latin America
- Brazil
- Argentina
- Rest of Latin America
Table of Contents
- Chapter 1. Report Introduction
- 1.1. Report Description
- 1.1.1. Purpose of the Report
- 1.1.2. USP & Key Offerings
- 1.2. Key Benefits For Stakeholders
- 1.3. Target Audience
- 1.4. Report Scope
- 1.1. Report Description
- Chapter 2. Market Overview
- 2.1. Report Scope (Segments And Key Players)
- 2.1.1. Refurbished and Used Mobile Phones by Segments
- 2.1.2. Refurbished and Used Mobile Phones by Region
- 2.2. Executive Summary
- 2.2.1. Market Size & Forecast
- 2.2.2. Refurbished and Used Mobile Phones Market Attractiveness Analysis, By Type
- 2.2.3. Refurbished and Used Mobile Phones Market Attractiveness Analysis, By Price Point
- 2.1. Report Scope (Segments And Key Players)
- Chapter 3. Market Dynamics (DRO)
- 3.1. Market Drivers
- 3.1.1. Rising Demand for Affordable Smartphones
- 3.1.2. High Demand for Premium And Recent Models
- 3.2. Market Restraints
- 3.3. Market Opportunities
- 3.5. Pestle Analysis
- 3.6. Porter Forces Analysis
- 3.7. Technology Roadmap
- 3.8. Value Chain Analysis
- 3.9. Government Policy Impact Analysis
- 3.10. Pricing Analysis
- 3.1. Market Drivers
- Chapter 4. Refurbished and Used Mobile Phones Market – By Type
- 4.1. Type Market Overview, By Type Segment
- 4.1.1. Refurbished and Used Mobile Phones Market Revenue Share, By Type, 2025 & 2035
- 4.1.2. Refurbished Phones
- 4.1.3. Refurbished and Used Mobile Phones Share Forecast, By Region (USD Billion)
- 4.1.4. Comparative Revenue Analysis, By Country, 2025 & 2035
- 4.1.5. Key Market Trends, Growth Factors, & Opportunities
- 4.1.6. Used Phones
- 4.1.7. Refurbished and Used Mobile Phones Share Forecast, By Region (USD Billion)
- 4.1.8. Comparative Revenue Analysis, By Country, 2025 & 2035
- 4.1.9. Key Market Trends, Growth Factors, & Opportunities
- 4.1. Type Market Overview, By Type Segment
- Chapter 5. Refurbished and Used Mobile Phones Market – By Price Point
- 5.1. Price Point Market Overview, By Price Point Segment
- 5.1.1. Refurbished and Used Mobile Phones Market Revenue Share, By Price Point, 2025 & 2035
- 5.1.2. Low-priced Refurbished and Used Mobile Phones (Less than $200)
- 5.1.3. Refurbished and Used Mobile Phones Share Forecast, By Region (USD Billion)
- 5.1.4. Comparative Revenue Analysis, By Country, 2025 & 2035
- 5.1.5. Key Market Trends, Growth Factors, & Opportunities
- 5.1.6. Mid-Priced Refurbished and Used Mobile Phones ($200-$500)
- 5.1.7. Refurbished and Used Mobile Phones Share Forecast, By Region (USD Billion)
- 5.1.8. Comparative Revenue Analysis, By Country, 2025 & 2035
- 5.1.9. Key Market Trends, Growth Factors, & Opportunities
- 5.1.10. Premium Refurbished and Used Mobile Phones (More than $500)
- 5.1.11. Refurbished and Used Mobile Phones Share Forecast, By Region (USD Billion)
- 5.1.12. Comparative Revenue Analysis, By Country, 2025 & 2035
- 5.1.13. Key Market Trends, Growth Factors, & Opportunities
- 5.1. Price Point Market Overview, By Price Point Segment
- Chapter 6. Refurbished and Used Mobile Phones Market – Regional Analysis
- 6.1. Refurbished and Used Mobile Phones Market Overview, By Region Segment
- 6.1.1. Global Refurbished and Used Mobile Phones Market Revenue Share, By Region, 2025 & 2035
- 6.1.2. Global Refurbished and Used Mobile Phones Market Revenue, By Region, 2026 – 2035 (USD Billion)
- 6.1.3. Global Refurbished and Used Mobile Phones Market Revenue, By Type, 2026 – 2035
- 6.1.4. Global Refurbished and Used Mobile Phones Market Revenue, By Price Point, 2026 – 2035
- 6.2. North America
- 6.2.1. North America Refurbished and Used Mobile Phones Market Revenue, By Country, 2026 – 2035 (USD Billion)
- 6.2.2. North America Refurbished and Used Mobile Phones Market Revenue, By Type, 2026 – 2035
- 6.2.3. North America Refurbished and Used Mobile Phones Market Revenue, By Price Point, 2026 – 2035
- 6.2.4. U.S. Refurbished and Used Mobile Phones Market Revenue, 2026 – 2035 (USD Billion)
- 6.2.5. Canada Refurbished and Used Mobile Phones Market Revenue, 2026 – 2035 (USD Billion)
- 6.2.6. Mexico Refurbished and Used Mobile Phones Market Revenue, 2026 – 2035 (USD Billion)
- 6.2.7. Rest of North America Refurbished and Used Mobile Phones Market Revenue, 2026 – 2035 (USD Billion)
- 6.3. Europe
- 6.3.1. Europe Refurbished and Used Mobile Phones Market Revenue, By Country, 2026 – 2035 (USD Billion)
- 6.3.2. Europe Refurbished and Used Mobile Phones Market Revenue, By Type, 2026 – 2035
- 6.3.3. Europe Refurbished and Used Mobile Phones Market Revenue, By Price Point, 2026 – 2035
- 6.3.4. Germany Refurbished and Used Mobile Phones Market Revenue, 2026 – 2035 (USD Billion)
- 6.3.5. France Refurbished and Used Mobile Phones Market Revenue, 2026 – 2035 (USD Billion)
- 6.3.6. U.K. Refurbished and Used Mobile Phones Market Revenue, 2026 – 2035 (USD Billion)
- 6.3.7. Russia Refurbished and Used Mobile Phones Market Revenue, 2026 – 2035 (USD Billion)
- 6.3.8. Italy Refurbished and Used Mobile Phones Market Revenue, 2026 – 2035 (USD Billion)
- 6.3.9. Spain Refurbished and Used Mobile Phones Market Revenue, 2026 – 2035 (USD Billion)
- 6.3.10. Netherlands Refurbished and Used Mobile Phones Market Revenue, 2026 – 2035 (USD Billion)
- 6.3.11. Rest of Europe Refurbished and Used Mobile Phones Market Revenue, 2026 – 2035 (USD Billion)
- 6.4. Asia Pacific
- 6.4.1. Asia Pacific Refurbished and Used Mobile Phones Market Revenue, By Country, 2026 – 2035 (USD Billion)
- 6.4.2. Asia Pacific Refurbished and Used Mobile Phones Market Revenue, By Type, 2026 – 2035
- 6.4.3. Asia Pacific Refurbished and Used Mobile Phones Market Revenue, By Price Point, 2026 – 2035
- 6.4.4. China Refurbished and Used Mobile Phones Market Revenue, 2026 – 2035 (USD Billion)
- 6.4.5. Japan Refurbished and Used Mobile Phones Market Revenue, 2026 – 2035 (USD Billion)
- 6.4.6. India Refurbished and Used Mobile Phones Market Revenue, 2026 – 2035 (USD Billion)
- 6.4.7. New Zealand Refurbished and Used Mobile Phones Market Revenue, 2026 – 2035 (USD Billion)
- 6.4.8. Australia Refurbished and Used Mobile Phones Market Revenue, 2026 – 2035 (USD Billion)
- 6.4.9. South Korea Refurbished and Used Mobile Phones Market Revenue, 2026 – 2035 (USD Billion)
- 6.4.10. Taiwan Refurbished and Used Mobile Phones Market Revenue, 2026 – 2035 (USD Billion)
- 6.4.11. Rest of Asia Pacific Refurbished and Used Mobile Phones Market Revenue, 2026 – 2035 (USD Billion)
- 6.5. The Middle-East and Africa
- 6.5.1. The Middle-East and Africa Refurbished and Used Mobile Phones Market Revenue, By Country, 2026 – 2035 (USD Billion)
- 6.5.2. The Middle-East and Africa Refurbished and Used Mobile Phones Market Revenue, By Type, 2026 – 2035
- 6.5.3. The Middle-East and Africa Refurbished and Used Mobile Phones Market Revenue, By Price Point, 2026 – 2035
- 6.5.4. Saudi Arabia Refurbished and Used Mobile Phones Market Revenue, 2026 – 2035 (USD Billion)
- 6.5.5. UAE Refurbished and Used Mobile Phones Market Revenue, 2026 – 2035 (USD Billion)
- 6.5.6. Egypt Refurbished and Used Mobile Phones Market Revenue, 2026 – 2035 (USD Billion)
- 6.5.7. Kuwait Refurbished and Used Mobile Phones Market Revenue, 2026 – 2035 (USD Billion)
- 6.5.8. South Africa Refurbished and Used Mobile Phones Market Revenue, 2026 – 2035 (USD Billion)
- 6.5.9. Rest of the Middle East & Africa Refurbished and Used Mobile Phones Market Revenue, 2026 – 2035 (USD Billion)
- 6.6. Latin America
- 6.6.1. Latin America Refurbished and Used Mobile Phones Market Revenue, By Country, 2026 – 2035 (USD Billion)
- 6.6.2. Latin America Refurbished and Used Mobile Phones Market Revenue, By Type, 2026 – 2035
- 6.6.3. Latin America Refurbished and Used Mobile Phones Market Revenue, By Price Point, 2026 – 2035
- 6.6.4. Brazil Refurbished and Used Mobile Phones Market Revenue, 2026 – 2035 (USD Billion)
- 6.6.5. Argentina Refurbished and Used Mobile Phones Market Revenue, 2026 – 2035 (USD Billion)
- 6.6.6. Rest of Latin America Refurbished and Used Mobile Phones Market Revenue, 2026 – 2035 (USD Billion)
- 6.1. Refurbished and Used Mobile Phones Market Overview, By Region Segment
- Chapter 7. Competitive Landscape
- 7.1. Company Market Share Analysis – 2025
- 7.1.1. Global Refurbished and Used Mobile Phones Market: Company Market Share, 2025
- 7.2. Global Refurbished and Used Mobile Phones Market Company Market Share, 2024
- 7.1. Company Market Share Analysis – 2025
- Chapter 8. Company Profiles
- 8.1. Cisco Systems Inc.
- 8.1.1. Company Overview
- 8.1.2. Key Executives
- 8.1.3. Product Portfolio
- 8.1.4. Financial Overview
- 8.1.5. Operating Business Segments
- 8.1.6. Business Performance
- 8.1.7. Recent Developments
- 8.2. Palo Alto Networks Inc.
- 8.3. CrowdStrike Holdings Inc.
- 8.4. Check Point Software Technologies
- 8.5. Fortinet Inc.
- 8.6. Microsoft Corporation
- 8.7. McAfee Corp.
- 8.8. Trend Micro Incorporated
- 8.9. Qualys Inc.
- 8.10. Apple Inc.
- 8.11. Samsung Electronics Co. Ltd.
- 8.12. Amazon com Inc.
- 8.13. Huawei Technologies Co. Ltd.
- 8.14. Microsoft Corporation
- 8.15. LG Electronics Inc.
- 8.16. Lenovo Group Limited
- 8.17. Xiaomi Corporation
- 8.18. Sony Corporation
- 8.19. Oppo Electronics Corp.
- 8.20. Vivo Communication Technology Co. Ltd.
- 8.21. ZTE Corporation
- 8.22. Motorola Solutions Inc.
- 8.23. Google LLC
- 8.24. TCL Technology
- 8.25. OnePlus Technology Co. Ltd.
- 8.26. BLU Products Inc.
- 8.27. InFocus Corporation
- 8.28. Nokia Corporation
- 8.29. AsusTek Computer Inc.
- 8.30. Others.
- 8.1. Cisco Systems Inc.
- Chapter 9. Research Methodology
- 9.1. Research Methodology
- 9.2. Secondary Research
- 9.3. Primary Research
- 9.3.1. Analyst Tools and Models
- 9.4. Research Limitations
- 9.5. Assumptions
- 9.6. Insights From Primary Respondents
- 9.7. Why Healthcare Foresights
- Chapter 10. Standard Report Commercials & Add-Ons
- 10.1. Customization Options
- 10.2. Subscription Module For Market Research Reports
- 10.3. Client Testimonials
- Chapter 11. List Of Figures
- 11.1. Figures No 1 to 19
- Chapter 12. List Of Tables
- 12.1. Tables No 1 to 41
Prominent Player
- Cisco Systems Inc.
- Palo Alto Networks Inc.
- CrowdStrike Holdings Inc.
- Check Point Software Technologies
- Fortinet Inc.
- Microsoft Corporation
- McAfee Corp.
- Trend Micro Incorporated
- Qualys Inc.
- Apple Inc.
- Samsung Electronics Co. Ltd.
- Amazon com Inc.
- Huawei Technologies Co. Ltd.
- Microsoft Corporation
- LG Electronics Inc.
- Lenovo Group Limited
- Xiaomi Corporation
- Sony Corporation
- Oppo Electronics Corp.
- Vivo Communication Technology Co. Ltd.
- ZTE Corporation
- Motorola Solutions Inc.
- Google LLC
- TCL Technology
- OnePlus Technology Co. Ltd.
- BLU Products Inc.
- InFocus Corporation
- Nokia Corporation
- AsusTek Computer Inc.
- Others
FAQs
The key players in the market are Cisco Systems Inc., Palo Alto Networks Inc., CrowdStrike Holdings Inc., Check Point Software Technologies, Fortinet Inc., Microsoft Corporation, McAfee Corp., Trend Micro Incorporated, Qualys Inc., Apple Inc., Samsung Electronics Co. Ltd., Amazon com Inc., Huawei Technologies Co. Ltd., Microsoft Corporation, LG Electronics Inc., Lenovo Group Limited, Xiaomi Corporation, Sony Corporation, Oppo Electronics Corp., Vivo Communication Technology Co. Ltd., ZTE Corporation, Motorola Solutions Inc., Google LLC, TCL Technology, OnePlus Technology Co. Ltd., BLU Products Inc., InFocus Corporation, Nokia Corporation, AsusTek Computer Inc., Others.
Government regulations play a crucial role in shaping the development of the refurbished and used mobile phones market by promoting sustainability, standardization, and consumer protection. Policies related to e-waste management and recycling encourage the reuse and refurbishment of electronic devices, helping reduce environmental impact and supporting circular economy practices. Regulations such as extended producer responsibility (EPR) require manufacturers to take accountability for the lifecycle of their products, which boosts the collection and refurbishment of used phones.
Price point plays a critical role in driving market growth and adoption in the refurbished and used mobile phones market. Lower price points make smartphones accessible to a broader consumer base, particularly in price-sensitive and emerging markets, where affordability is a key purchasing factor. Refurbished and used devices offer significant cost savings—often 30–70% lower than new models—allowing consumers to access better features, premium brands, and higher specifications within limited budgets. This affordability not only attracts first-time smartphone users but also encourages upgrades among existing users who might otherwise delay purchases due to high costs.
According to the present analysis and forecast modeling, the market of refurbished and used mobile phones will witness a significant growth of about USD 324.5 billion in the year 2035 with the growing innovative product launch, increasing collaboration, rising government initiatives, and growing e-commerce industry with a CAGR of 22.6% between the years 2026 and 2035.
It is projected that the Asia Pacific will hold the largest market share in the refurbished and used mobile phones market in the forecast period, with a share of about 39% of the global market share, which is attributed to the region presence of major players and increasing demand for premium phones.
North America is expected to grow at a highest rate during the forecast period. The growth in the region is owing to the increasing investment in 5G.
The growth of the refurbished and used mobile phones market is driven by several key factors: rising demand for affordable smartphones, increasing consumer price sensitivity, growing environmental awareness, expansion of trade-in and buyback programs, and the rapid growth of e-commerce platforms.