Solar Photovoltaic Market Size, Trends and Insights By Technology (Mono-Si, Multi-Si, Thin Film, Others), By Installation (Ground Mounted, Roof Mounted, Others), By Grid Type (On-grid, Off-grid), By Application (Residential, Utilities, Non-residential), and By Region - Global Industry Overview, Statistical Data, Competitive Analysis, Share, Outlook, and Forecast 2026 – 2035
Report Snapshot
CAGR: 8.5%
| Study Period: | 2026-2035 |
| Fastest Growing Market: | North America |
| Largest Market: | Asia-Pacific |
Major Players
- BrightSource Energy Inc.
- First Solar
- SunPower Corporation
- eSolar Inc.
- Others
Reports Description
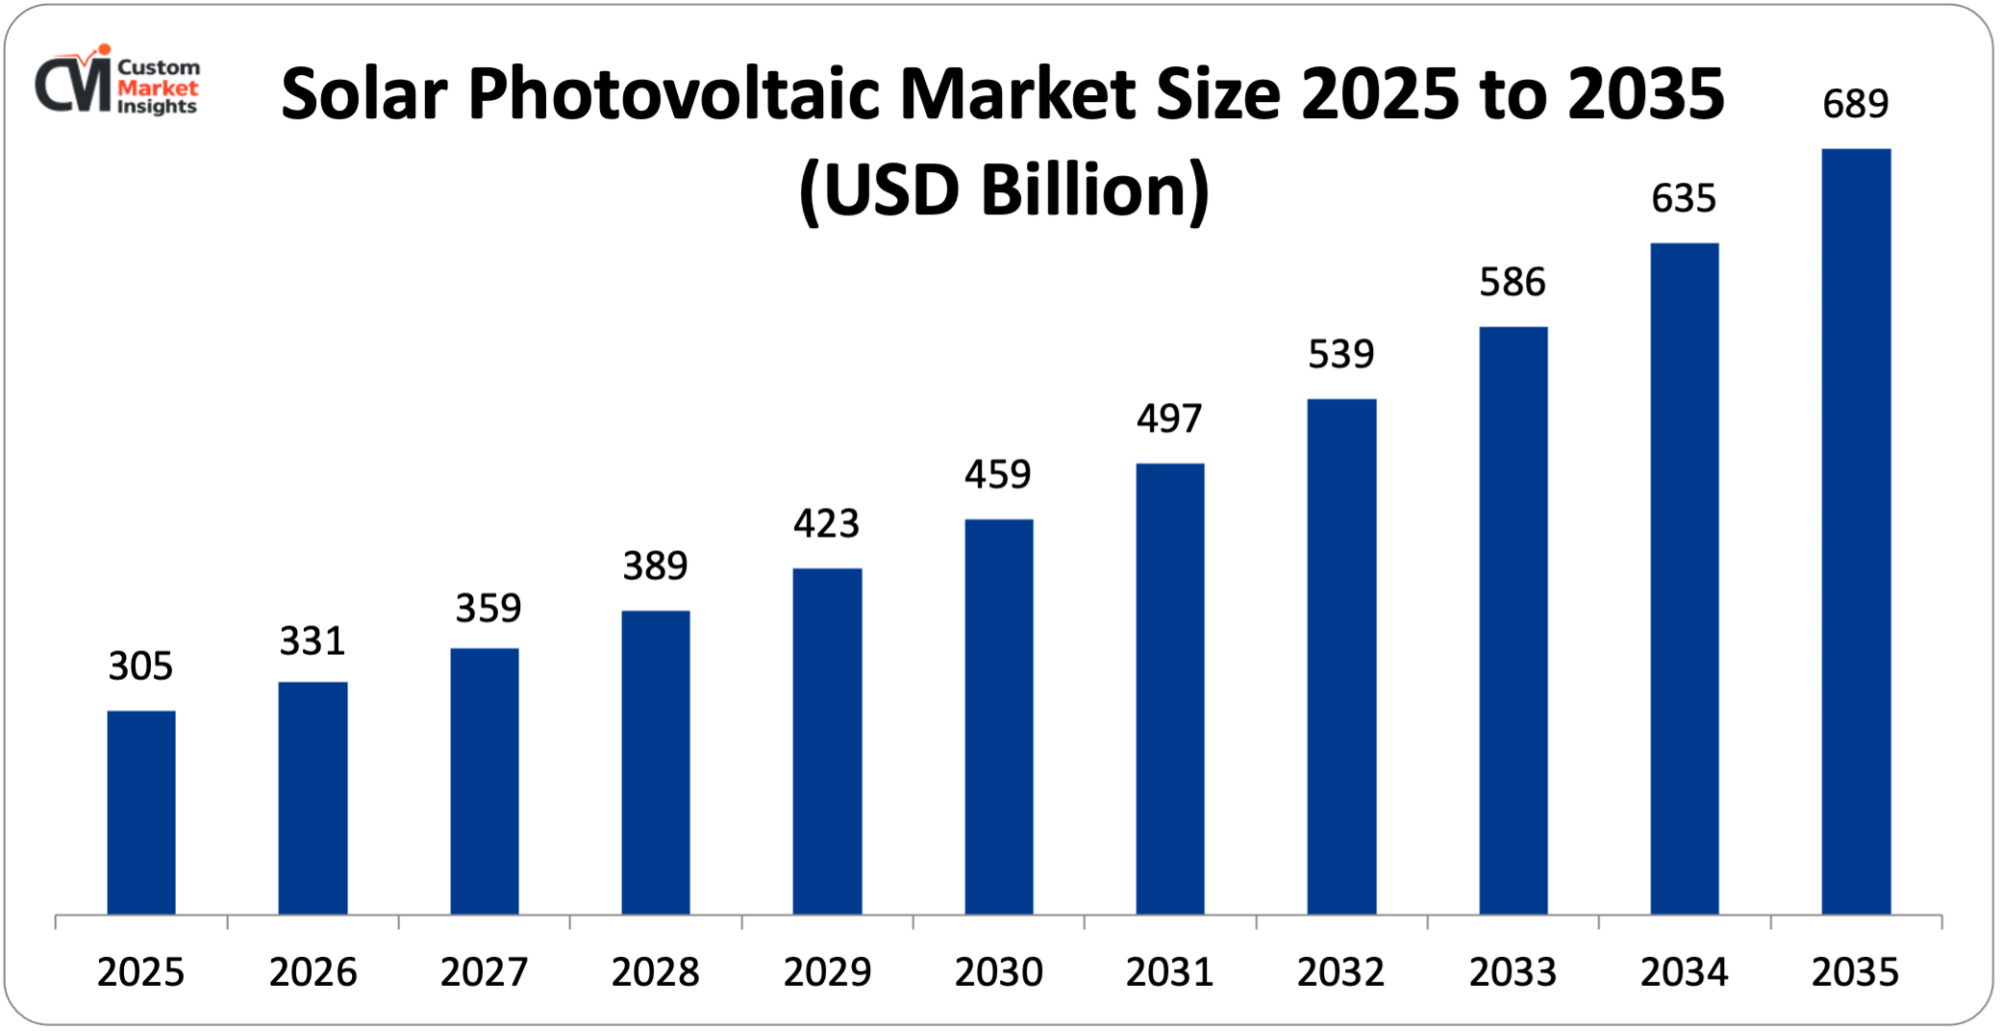
The market size of global solar photovoltaic will be estimated at USD 305 billion in 2025 and is expected to grow to between USD 331 billion in 2026 and about USD 689 billion by 2035, with a current CAGR (compound annual growth rate) of 8.5% during the period of 2026 to 2035. Solar Photovoltaic PV is a means by which the energy of sunlight can be converted directly into electricity by the use of a semiconductor material that exploits the Photovoltaic Effect.
A Solar PV system involves the solar panels, consisting of photovoltaic cells (usually silicon), absorbing sunlight and generating electricity in the form of direct current (DC). An inverter is used to convert this into alternating current (AC) so it can be fed into a series of buildings or the national grid. PV systems could be installed as a Solar PV roof system, a solar farm (ground-mounted), or integrated into a building.
Market Highlight
- In 2025, North America will dominate the global market with an estimated market share of 48%. The rising innovative product launch and increasing collaboration among market players drive the regional market growth.
- The Asia Pacific is growing at the highest CAGR over the analysis period. The increasing government initiatives drive the market growth.
- By technology, the Multi-Si is expected to dominate the market with a revenue share of over 50% in 2025.
- By grid type, the on-grid segment captures the largest market share of over 95% in 2025.
Significant Growth Factors
The solar photovoltaic market trends present significant growth opportunities due to several factors:
- Rising Demand For Renewable and Clean Energy: The Solar PV market possesses huge growth potential owing to the phenomenal rise in demand for renewable and clean sources of energy generation. As the world is becoming more and more conscious of the hazards posed by climate change, carbon emission, and other ecological issues, it becomes necessary for each country, every industry, and every individual to opt for cleaner sources of energy generation such as solar power. Also, as solar PV is a renewable energy source and is practically emission-free in its power generation, it is providing a long-term sustainability option. It is this ever-present requirement for clean energy transition that leads to the growth of the Solar PV markets.
- Increasing Investments And Energy Security Concerns: The increase in investments and the growing concern about energy security are significantly boosting the solar PV market. Most of the governments and private investors around the world are making massive investments in solar power to boost their electricity capacity for consumption and to minimize reliance on imported fossil fuels. As a reliable and independent source of energy, solar PV enables a country to improve their energy security and secure their electricity supply. Because of the increasing global demand and high fluctuations in prices of fossil fuels, investments in renewable energy are growing rapidly for solar photovoltaic systems. For instance, according to the International Energy Agency, the estimated global energy investment for 2025 is expected to exceed USD 3.3 trillion, with approximately USD 2.2 trillion (about two-thirds) allocated for clean energy, which is twice the amount spent on fossil fuels (USD 1.1 trillion).
What are the Major Advances Changing the Solar Photovoltaic Market Today?
- High-Efficiency Solar Cell Technologies: High-Efficiency Solar Cell Technologies are one of the most active developments transforming the Solar PV market. The constant innovation of solar cells—including PERC, TOPCon (Tunnel Oxide Passivated Contact)—with higher conversion efficiencies has been enabling PV modules to generate more electricity from the same Sun exposure, increasing power per area and decreasing overall cost (W/cm² and W/sq. Ft). This makes high-efficiency solar cells converge into more financially viable PV systems for residential, commercial, and even greenfield utility-scale use. For instance, in September 2025, Canadian Solar Inc. Unveiled its new advanced Low Carbon (LC) Modules, integrating the most recent wafer technology advancements with advanced heterojunction (HJT) cell technology. These Low Carbon modules have an industry-low carbon footprint of only 285 kg CO₂eq/kW (compared to an industry-low value of 370 for bifacial LC) (one of the lowest carbon footprints for all silicon-based solar modules in the world).
- Integration With Energy Storage Systems: Another issue trend that is impacting the Solar PV industry is the overall ongoing integration with the Electricity Storage System (ESS). Solar plants are hybridised with the Electricity Storage System (ESS) i.e. Lithium-Ion Battery, which are used to store the excess solar power in the battery cells for the period of time during the hours of high sunlight intensity. The stored power can be reconverted into the grid during the period of low sunlight hours to provide the availability of electricity from solar technology for more hours of the day. This improves the grid stability and provides easier integration of solar technology to power grids. For instance, in September 2025, During RE+ 2025, Sungrow’s newest innovations were on show to feature its continued dominance in photovoltaic (PV) inverters and energy storage systems worldwide. There were three new product offerings being introduced to the US market: the 2nd generation modular inverter designed for utility-scale PV projects, the new PowerTitan 3.0 AC Block BESS designed for utility-scale energy storage, and the PowerStack 255CS BESS focused on C&I energy storage. All of the solutions aim to help provide ongoing local energy reliability and sustainability through a firm commitment to supporting the US power grid and electric consumers with dependable, pioneering, and compliant systems.
Category Wise Insights
By Technology
Why Multi-Si Hold a Prominent Position in the Market?
The Multi-Si is expected to dominate the market with a revenue share of over 50% in 2025. The increase is attributed to its relatively low cost and constant high adoption rate by utility-scale panels. Multi-Si, also called Polycrystalline Silicon, have been the workhorse of PV modules for most of the time due to its advantage of a good compromise between performance and lower manufacturing cost compared to the latest cell technologies. Many solar manufacturers and large-scale utility developers still have multiple-silicon market penetration for the emerging markets with effective cost and scalability factors. The advances in manufacturing methodology and module efficiency further boost the performance of multi-silicon panels, which in turn brought more installations and higher revenue growth for the segment.
The Mono-Si segment is growing at the highest CAGR over the analysis period. Segment growth is driven by higher efficiency and growing application in new solar installations. Mono-Si is Monocrystalline Silicon, which provides higher energy conversion efficiency and better performance in less space when compared to other classes of solar cells. This makes Monocrystalline Silicon suitable for horizontal rooftops, commercial building rooftops, and utility-scale photovoltaics. Furthermore, with new manufacturing techniques and the manufacturers’ efforts to reduce costs, the monocrystalline panels have become more affordable, resulting in an increase in revenue growth in this segment in the Solar Photovoltaic market.
By Grid Type
Why On-grid Dominates the Solar Photovoltaic Market?
The on-grid segment captures the largest market share of over 95% in 2025. This growth is attributed to a huge increase in utility-scale projects across the globe, particularly in regions where renewable energy policies and incentives have been implemented to promote solar energy adoption. On-grid solar photovoltaic system is grid-connected to the utility grid with generated electricity through solar photovoltaics. The on-grid system varies from miniature to immense utility-scale solar photovoltaic generating stations.
The off-grid segment is growing at the highest CAGR over the projected period. Off-grid systems are not supplied to the utility grids. The off-grid sector is one of the fastest-growing segments because it is extensively used in rural areas and regions without grid connectivity.
Report Scope
| Feature of the Report | Details |
| Market Size in 2026 | USD 331 billion |
| Projected Market Size in 2035 | USD 689 billion |
| Market Size in 2025 | USD 305 billion |
| CAGR Growth Rate | 8.5% CAGR |
| Base Year | 2025 |
| Forecast Period | 2026-2035 |
| Key Segment | By Technology, Installation, Grid Type, Application and Region |
| Report Coverage | Revenue Estimation and Forecast, Company Profile, Competitive Landscape, Growth Factors and Recent Trends |
| Regional Scope | North America, Europe, Asia Pacific, Middle East & Africa, and South & Central America |
| Buying Options | Request tailored purchasing options to fulfil your requirements for research. |
Regional Analysis
How Big is North America Solar Photovoltaic Market Size?
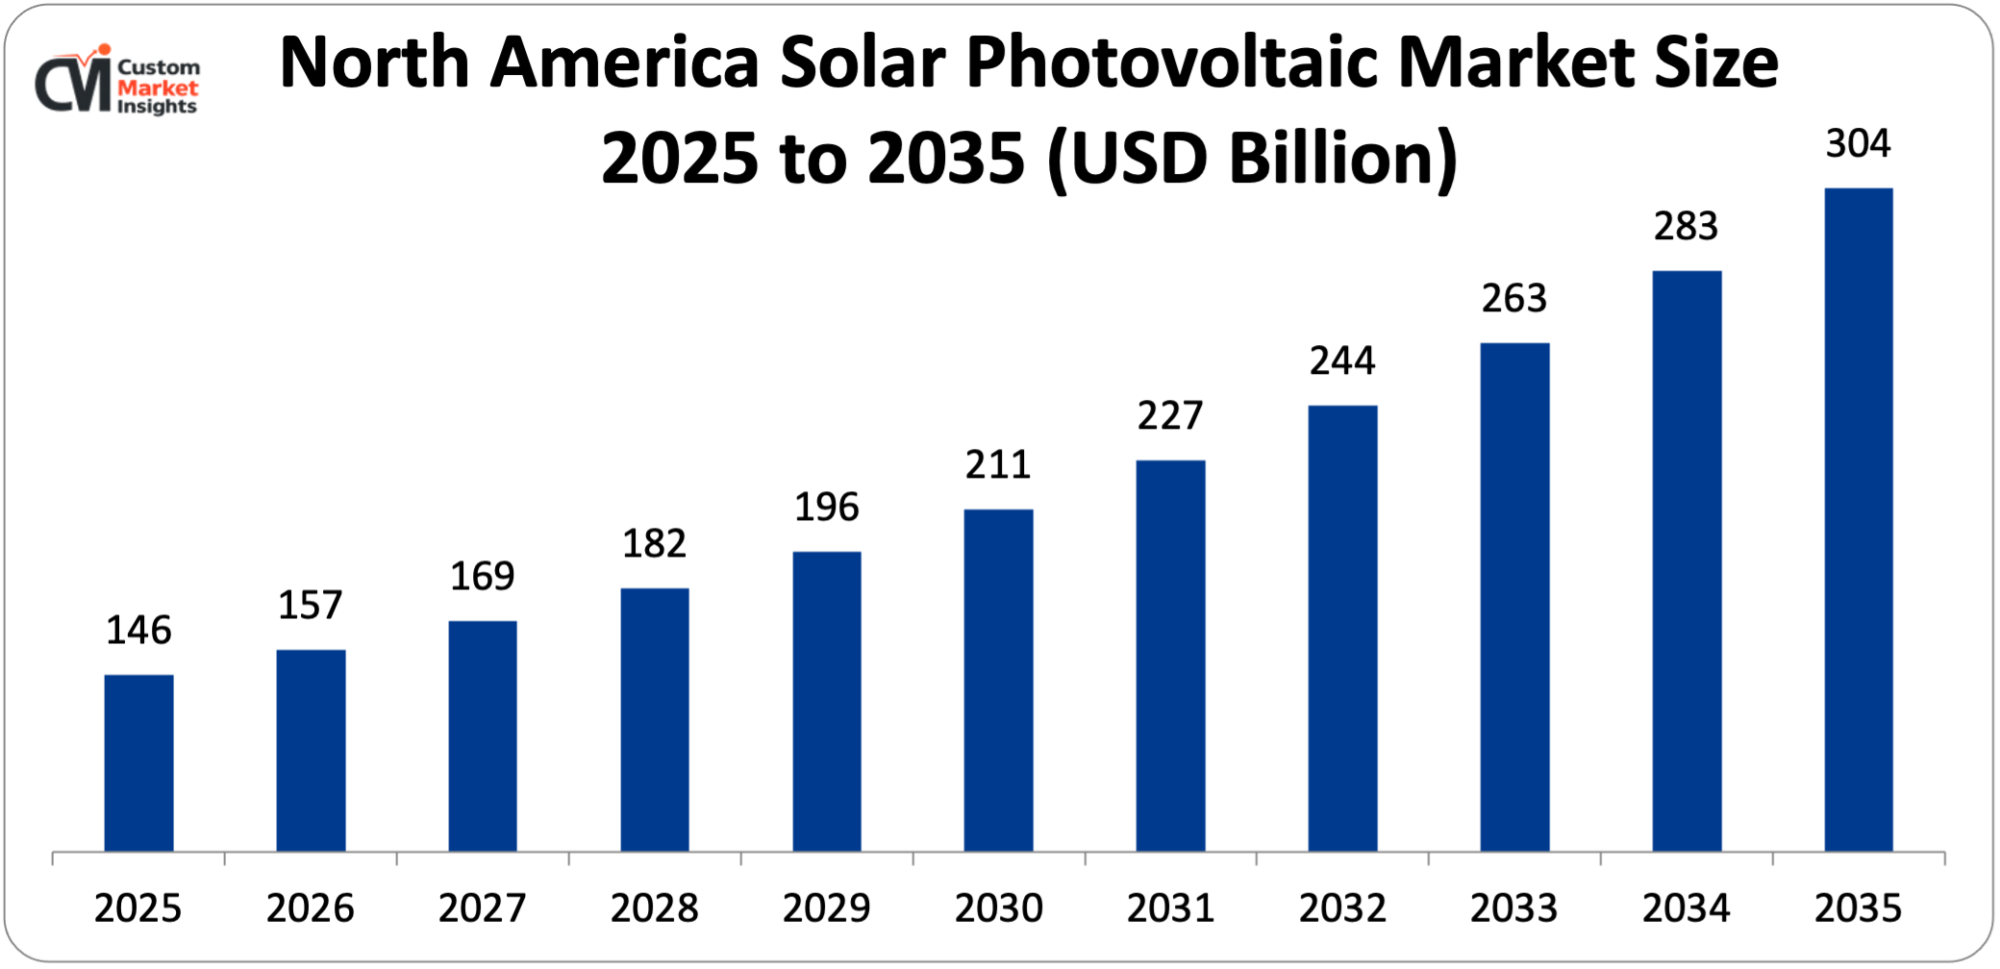
Its market size, in terms of North America solar photovoltaic, is projected to be USD 146 billion in 2025 with a growth of about USD 304 billion in 2035 with a CAGR of 7.6% between 2026 and 2035.
Why did North America Dominate the Solar Photovoltaic Market in 2025?
In 2025, North America will dominate the global market with an estimated market share of 48%. The growth of the regional market is driven largely by growing investment in renewable energy projects and regulations supported by government policies that promote clean power generation, and federal and state opportunities, tax credits, and renewable energy mandates are motivating utility companies, institutions, and homeowners to switch to solar power. As most prominently illustrated in the long-term tax incentives under the Inflation Reduction Act for solar installation, growing electricity demand, GPG lowering solar module prices, and heightened energy security concerns are also contributing to the growth of solar PV systems in North America.
US Solar Photovoltaic Market Trends
In the North American region, the US leads the industry expansion over the projected period. The rising partnership is expected to drive the country’s market growth. In March 2025, Origami Solar, a pioneer in steel solar module framing, announced an agreement with Sirius PV USA to supply steel frames for the company’s domestically produced solar modules. This is yet another momentous step in the construction of an onshore solar supply chain for the company, providing customers with faster lead times and incentives for greater domestic content. Sirius PV has had their commercial and utility steel-framed modules recertified at Intertek and are immediately available for purchase. The upgrade to steel framing increases the strength, reliability, and performance of the company‘s modules and furthers their goal of providing customers with greater domestic content from U.S.-produced components.
Why is Europe Experiencing a Significant Growth in the Solar Photovoltaic Market?
Europe holds a significant market share in 2025. Continued growth of solar PV markets across Europe is expanding along with ever more bold climate commitments. The energy industry is responsible for more than 75% of all European Union greenhouse gases, drawing the call from the European Parliament for quick change to unleash its renewable energies. Achieving no less than a 55% reduction in the net emissions of greenhouse gas by 2030, and a climate-neutral EU in 2050, Europe accelerates the development of residential, commercial, and large utility photovoltaic power projects.
UK Solar Photovoltaic Market Trends
The UK held the dominant position in the market in 2025. This is due to a wider use of the technologies of renewable energy and governments’ active policies to achieve high carbon reduction levels. The UK Government works out to be a net-zero carbon emitter by 2050 and raises the capacity of renewable electricity generation; it encouraged the UK government to incentivize solar PV installations on domestic, commercial, and Utility projects. Rising electricity prices and awareness of the use of green energy sources are positive factors that will demand the use of renewable power generation by the average household and organizations, and the Solar PV market has been growing upward. The development of new solar cell technology and the decreasing prices of equipment and installation are encouraging the UK Solar PV industry.
Why is the Asia Pacific growing at a rapid rate in the Solar Photovoltaic Market?
The Asia Pacific is expected to grow at the highest CAGR over the projected period. In the year 2023, a total of 11 companies with a total capacity of 39,600 MW were financed from a total investment of USD 1.61 billion through the PLI Scheme for High-Efficiency Solar PV Modules by the Ministry of New and Renewable Energy (MNRE). The scheme will help to strengthen regional self-sufficiency in solar manufacturing as well as help to create the share of renewable energy. Besides, encouraging the low-cost production of high-efficiency modules to develop a diverse supply chain for solar products by the PLI scheme also plays a key role by leveraging the global development trends. Countries in APAC regions also take the footsteps of the global solar power installations and invest more in domestic manufacturing and solar infrastructure, especially India, China, and Japan. Cost declines and technology improvements that could further reduce the cost per watt of solar integrated across the globe will have a positive impact on the growth rate.
India Solar Photovoltaic Market Trends
India led the Asia Pacific market. The market growth in the country is owing to the rising renewable energy capacity and increasing investment by the government. Moreover, the growing focus on clean energy is an important factor for the country’s market development.
Why is the Middle East & Africa Region is growing rapidly in the Solar Photovoltaic?
The MEA region is growing at a steady rate over the projected period. This growth can be attributed to increased installation of renewable projects and initiatives to diversify sources of energy other than fossil fuels. Countries with significant solar irradiance in the region are mainly investing in mega solar projects to overcome future increases in electricity demand and enhance energy sustainability. Public sector policies, national renewable electricity targets, public-private partnerships, and power procurement programs are all fostering solar infrastructure development in the region.
UAE Solar Photovoltaic Market Trends
The UAE is growing at the highest CAGR during the forecast period. The growth is owing to the rising number of agreements in the area. For instance, in October 2025, EWEC (Emirates Water and Electricity Company), one of the world‘s leading companies in integrated planning, purchasing, supply, and system dispatch services of water and electricity in Dubai, has announced the winner of its new 1.5 GW (AC) Khazna Solar PV Independent Power Project. It was awarded to ENGIE, one of the world‘s leading companies in low-carbon energy solutions, and Masdar of Abu Dhabi, the global clean energy industry, for the utility-scale solar power plant development. Subsequently, the project‘s Power Purchase Agreement (PPA) was signed between EWEC and the two companies.
Top Players in the Solar Photovoltaic Market and Their Offerings
- Wuxi Suntech Power Co. Ltd.
- BrightSource Energy Inc.
- First Solar
- SunPower Corporation
- eSolar Inc.
- Yingli Solar
- Canadian Solar Inc.
- Jinko Solar
- Waaree Group
- AccionaEnergia S.A.
- Nextera Energy Sources LLC
- Vivaan Solar
- Trina Solar
- Tata PowerSolar Systems Ltd.
- Abengoa
- Others
Key Developments
Solar photovoltaic market has experienced considerable changes in the last two years as the market players are trying to diversify their technological aspects and develop product portfolios using strategic approaches.
- In December 2025, BRE launched the PV Fire Intelligence Network (PV-FIN)—a steering group of major organizations to look into the fire safety of solar PV (photovoltaic) systems. Several solar PV & component manufacturers, fire specialists, and solar safety solutions providers will constitute the network, which will be led by BRE. MCS Company, The Fire Industry Association, CGM Group UK, Enphase Energy, IMO Precision Controls, PVStop, SolarEdge Technologies, ArcBox (Virinidan Solar division), and Solar Energy UK will contribute to the initiative. (https://bregroup.com/news/bre-establishes-collaborative-industry-network-with-essential-aim-of-making-solar-pv-systems-safer)
These strategic measures have enabled the companies to reinforce their competitive positions, increase the product line, boost their technological competencies, and also seize growth opportunities in the fast-growing solar photovoltaic market.
The Solar Photovoltaic Market is segmented as follows:
By Technology
- Mono-Si
- Multi-Si
- Thin Film
- Others
By Installation
- Ground Mounted
- Roof Mounted
- Others
By Grid Type
- On-grid
- Off-grid
By Application
- Residential
- Utilities
- Non-residential
Regional Coverage:
North America
- U.S.
- Canada
- Mexico
- Rest of North America
Europe
- Germany
- France
- U.K.
- Russia
- Italy
- Spain
- Netherlands
- Rest of Europe
Asia Pacific
- China
- Japan
- India
- New Zealand
- Australia
- South Korea
- Taiwan
- Rest of Asia Pacific
The Middle East & Africa
- Saudi Arabia
- UAE
- Egypt
- Kuwait
- South Africa
- Rest of the Middle East & Africa
Latin America
- Brazil
- Argentina
- Rest of Latin America
Table of Contents
- Chapter 1. Report Introduction
- 1.1. Report Description
- 1.1.1. Purpose of the Report
- 1.1.2. USP & Key Offerings
- 1.2. Key Benefits For Stakeholders
- 1.3. Target Audience
- 1.4. Report Scope
- 1.1. Report Description
- Chapter 2. Market Overview
- 2.1. Report Scope (Segments And Key Players)
- 2.1.1. Solar Photovoltaic by Segments
- 2.1.2. Solar Photovoltaic by Region
- 2.2. Executive Summary
- 2.2.1. Market Size & Forecast
- 2.2.2. Solar Photovoltaic Market Attractiveness Analysis, By Technology
- 2.2.3. Solar Photovoltaic Market Attractiveness Analysis, By Installation
- 2.2.4. Solar Photovoltaic Market Attractiveness Analysis, By Grid Type
- 2.2.5. Solar Photovoltaic Market Attractiveness Analysis, By Application
- 2.1. Report Scope (Segments And Key Players)
- Chapter 3. Market Dynamics (DRO)
- 3.1. Market Drivers
- 3.1.1. Rising Demand For Renewable and Clean Energy
- 3.1.2. Increasing Investments And Energy Security Concerns
- 3.2. Market Restraints
- 3.3. Market Opportunities
- 3.5. Pestle Analysis
- 3.6. Porter’s Forces Analysis
- 3.7. Technology Roadmap
- 3.8. Value Chain Analysis
- 3.9. Government Policy Impact Analysis
- 3.10. Pricing Analysis
- 3.1. Market Drivers
- Chapter 4. Solar Photovoltaic Market – By Technology
- 4.1. Technology Market Overview, By Technology Segment
- 4.1.1. Solar Photovoltaic Market Revenue Share, By Technology, 2025 & 2035
- 4.1.2. Mono-Si
- 4.1.3. Solar Photovoltaic Share Forecast, By Region (USD Billion)
- 4.1.4. Comparative Revenue Analysis, By Country, 2025 & 2035
- 4.1.5. Key Market Trends, Growth Factors, & Opportunities
- 4.1.6. Multi-Si
- 4.1.7. Solar Photovoltaic Share Forecast, By Region (USD Billion)
- 4.1.8. Comparative Revenue Analysis, By Country, 2025 & 2035
- 4.1.9. Key Market Trends, Growth Factors, & Opportunities
- 4.1.10. Thin Film
- 4.1.11. Solar Photovoltaic Share Forecast, By Region (USD Billion)
- 4.1.12. Comparative Revenue Analysis, By Country, 2025 & 2035
- 4.1.13. Key Market Trends, Growth Factors, & Opportunities
- 4.1.14. Others
- 4.1.15. Solar Photovoltaic Share Forecast, By Region (USD Billion)
- 4.1.16. Comparative Revenue Analysis, By Country, 2025 & 2035
- 4.1.17. Key Market Trends, Growth Factors, & Opportunities
- 4.1. Technology Market Overview, By Technology Segment
- Chapter 5. Solar Photovoltaic Market – By Installation
- 5.1. Installation Market Overview, By Installation Segment
- 5.1.1. Solar Photovoltaic Market Revenue Share, By Installation, 2025 & 2035
- 5.1.2. Ground Mounted
- 5.1.3. Solar Photovoltaic Share Forecast, By Region (USD Billion)
- 5.1.4. Comparative Revenue Analysis, By Country, 2025 & 2035
- 5.1.5. Key Market Trends, Growth Factors, & Opportunities
- 5.1.6. Roof Mounted
- 5.1.7. Solar Photovoltaic Share Forecast, By Region (USD Billion)
- 5.1.8. Comparative Revenue Analysis, By Country, 2025 & 2035
- 5.1.9. Key Market Trends, Growth Factors, & Opportunities
- 5.1.10. Others
- 5.1.11. Solar Photovoltaic Share Forecast, By Region (USD Billion)
- 5.1.12. Comparative Revenue Analysis, By Country, 2025 & 2035
- 5.1.13. Key Market Trends, Growth Factors, & Opportunities
- 5.1. Installation Market Overview, By Installation Segment
- Chapter 6. Solar Photovoltaic Market – By Grid Type
- 6.1. Grid Type Market Overview, By Grid Type Segment
- 6.1.1. Solar Photovoltaic Market Revenue Share, By Grid Type, 2025 & 2035
- 6.1.2. On-grid
- 6.1.3. Solar Photovoltaic Share Forecast, By Region (USD Billion)
- 6.1.4. Comparative Revenue Analysis, By Country, 2025 & 2035
- 6.1.5. Key Market Trends, Growth Factors, & Opportunities
- 6.1.6. Off-grid
- 6.1.7. Solar Photovoltaic Share Forecast, By Region (USD Billion)
- 6.1.8. Comparative Revenue Analysis, By Country, 2025 & 2035
- 6.1.9. Key Market Trends, Growth Factors, & Opportunities
- 6.1. Grid Type Market Overview, By Grid Type Segment
- Chapter 7. Solar Photovoltaic Market – By Application
- 7.1. Application Market Overview, By Application Segment
- 7.1.1. Solar Photovoltaic Market Revenue Share, By Application, 2025 & 2035
- 7.1.2. Residential
- 7.1.3. Solar Photovoltaic Share Forecast, By Region (USD Billion)
- 7.1.4. Comparative Revenue Analysis, By Country, 2025 & 2035
- 7.1.5. Key Market Trends, Growth Factors, & Opportunities
- 7.1.6. Utilities
- 7.1.7. Solar Photovoltaic Share Forecast, By Region (USD Billion)
- 7.1.8. Comparative Revenue Analysis, By Country, 2025 & 2035
- 7.1.9. Key Market Trends, Growth Factors, & Opportunities
- 7.1.10. Non-residential
- 7.1.11. Solar Photovoltaic Share Forecast, By Region (USD Billion)
- 7.1.12. Comparative Revenue Analysis, By Country, 2025 & 2035
- 7.1.13. Key Market Trends, Growth Factors, & Opportunities
- 7.1. Application Market Overview, By Application Segment
- Chapter 8. Solar Photovoltaic Market – Regional Analysis
- 8.1. Solar Photovoltaic Market Overview, By Region Segment
- 8.1.1. Global Solar Photovoltaic Market Revenue Share, By Region, 2025 & 2035
- 8.1.2. Global Solar Photovoltaic Market Revenue, By Region, 2026 – 2035 (USD Billion)
- 8.1.3. Global Solar Photovoltaic Market Revenue, By Technology, 2026 – 2035
- 8.1.4. Global Solar Photovoltaic Market Revenue, By Installation, 2026 – 2035
- 8.1.5. Global Solar Photovoltaic Market Revenue, By Grid Type, 2026 – 2035
- 8.1.6. Global Solar Photovoltaic Market Revenue, By Application, 2026 – 2035
- 8.2. North America
- 8.2.1. North America Solar Photovoltaic Market Revenue, By Country, 2026 – 2035 (USD Billion)
- 8.2.2. North America Solar Photovoltaic Market Revenue, By Technology, 2026 – 2035
- 8.2.3. North America Solar Photovoltaic Market Revenue, By Installation, 2026 – 2035
- 8.2.4. North America Solar Photovoltaic Market Revenue, By Grid Type, 2026 – 2035
- 8.2.5. North America Solar Photovoltaic Market Revenue, By Application, 2026 – 2035
- 8.2.6. U.S. Solar Photovoltaic Market Revenue, 2026 – 2035 (USD Billion)
- 8.2.7. Canada Solar Photovoltaic Market Revenue, 2026 – 2035 (USD Billion)
- 8.2.8. Mexico Solar Photovoltaic Market Revenue, 2026 – 2035 (USD Billion)
- 8.2.9. Rest of North America Solar Photovoltaic Market Revenue, 2026 – 2035 (USD Billion)
- 8.3. Europe
- 8.3.1. Europe Solar Photovoltaic Market Revenue, By Country, 2026 – 2035 (USD Billion)
- 8.3.2. Europe Solar Photovoltaic Market Revenue, By Technology, 2026 – 2035
- 8.3.3. Europe Solar Photovoltaic Market Revenue, By Installation, 2026 – 2035
- 8.3.4. Europe Solar Photovoltaic Market Revenue, By Grid Type, 2026 – 2035
- 8.3.5. Europe Solar Photovoltaic Market Revenue, By Application, 2026 – 2035
- 8.3.6. Germany Solar Photovoltaic Market Revenue, 2026 – 2035 (USD Billion)
- 8.3.7. France Solar Photovoltaic Market Revenue, 2026 – 2035 (USD Billion)
- 8.3.8. U.K. Solar Photovoltaic Market Revenue, 2026 – 2035 (USD Billion)
- 8.3.9. Russia Solar Photovoltaic Market Revenue, 2026 – 2035 (USD Billion)
- 8.3.10. Italy Solar Photovoltaic Market Revenue, 2026 – 2035 (USD Billion)
- 8.3.11. Spain Solar Photovoltaic Market Revenue, 2026 – 2035 (USD Billion)
- 8.3.12. Netherlands Solar Photovoltaic Market Revenue, 2026 – 2035 (USD Billion)
- 8.3.13. Rest of Europe Solar Photovoltaic Market Revenue, 2026 – 2035 (USD Billion)
- 8.4. Asia Pacific
- 8.4.1. Asia Pacific Solar Photovoltaic Market Revenue, By Country, 2026 – 2035 (USD Billion)
- 8.4.2. Asia Pacific Solar Photovoltaic Market Revenue, By Technology, 2026 – 2035
- 8.4.3. Asia Pacific Solar Photovoltaic Market Revenue, By Installation, 2026 – 2035
- 8.4.4. Asia Pacific Solar Photovoltaic Market Revenue, By Grid Type, 2026 – 2035
- 8.4.5. Asia Pacific Solar Photovoltaic Market Revenue, By Application, 2026 – 2035
- 8.4.6. China Solar Photovoltaic Market Revenue, 2026 – 2035 (USD Billion)
- 8.4.7. Japan Solar Photovoltaic Market Revenue, 2026 – 2035 (USD Billion)
- 8.4.8. India Solar Photovoltaic Market Revenue, 2026 – 2035 (USD Billion)
- 8.4.9. New Zealand Solar Photovoltaic Market Revenue, 2026 – 2035 (USD Billion)
- 8.4.10. Australia Solar Photovoltaic Market Revenue, 2026 – 2035 (USD Billion)
- 8.4.11. South Korea Solar Photovoltaic Market Revenue, 2026 – 2035 (USD Billion)
- 8.4.12. Taiwan Solar Photovoltaic Market Revenue, 2026 – 2035 (USD Billion)
- 8.4.13. Rest of Asia Pacific Solar Photovoltaic Market Revenue, 2026 – 2035 (USD Billion)
- 8.5. The Middle-East and Africa
- 8.5.1. The Middle-East and Africa Solar Photovoltaic Market Revenue, By Country, 2026 – 2035 (USD Billion)
- 8.5.2. The Middle-East and Africa Solar Photovoltaic Market Revenue, By Technology, 2026 – 2035
- 8.5.3. The Middle-East and Africa Solar Photovoltaic Market Revenue, By Installation, 2026 – 2035
- 8.5.4. The Middle-East and Africa Solar Photovoltaic Market Revenue, By Grid Type, 2026 – 2035
- 8.5.5. The Middle-East and Africa Solar Photovoltaic Market Revenue, By Application, 2026 – 2035
- 8.5.6. Saudi Arabia Solar Photovoltaic Market Revenue, 2026 – 2035 (USD Billion)
- 8.5.7. UAE Solar Photovoltaic Market Revenue, 2026 – 2035 (USD Billion)
- 8.5.8. Egypt Solar Photovoltaic Market Revenue, 2026 – 2035 (USD Billion)
- 8.5.9. Kuwait Solar Photovoltaic Market Revenue, 2026 – 2035 (USD Billion)
- 8.5.10. South Africa Solar Photovoltaic Market Revenue, 2026 – 2035 (USD Billion)
- 8.5.11. Rest of the Middle East & Africa Solar Photovoltaic Market Revenue, 2026 – 2035 (USD Billion)
- 8.6. Latin America
- 8.6.1. Latin America Solar Photovoltaic Market Revenue, By Country, 2026 – 2035 (USD Billion)
- 8.6.2. Latin America Solar Photovoltaic Market Revenue, By Technology, 2026 – 2035
- 8.6.3. Latin America Solar Photovoltaic Market Revenue, By Installation, 2026 – 2035
- 8.6.4. Latin America Solar Photovoltaic Market Revenue, By Grid Type, 2026 – 2035
- 8.6.5. Latin America Solar Photovoltaic Market Revenue, By Application, 2026 – 2035
- 8.6.6. Brazil Solar Photovoltaic Market Revenue, 2026 – 2035 (USD Billion)
- 8.6.7. Argentina Solar Photovoltaic Market Revenue, 2026 – 2035 (USD Billion)
- 8.6.8. Rest of Latin America Solar Photovoltaic Market Revenue, 2026 – 2035 (USD Billion)
- 8.1. Solar Photovoltaic Market Overview, By Region Segment
- Chapter 9. Competitive Landscape
- 9.1. Company Market Share Analysis – 2025
- 9.1.1. Global Solar Photovoltaic Market: Company Market Share, 2025
- 9.2. Global Solar Photovoltaic Market Company Market Share, 2024
- 9.1. Company Market Share Analysis – 2025
- Chapter 10. Company Profiles
- 10.1. Wuxi Suntech Power Co. Ltd.
- 10.1.1. Company Overview
- 10.1.2. Key Executives
- 10.1.3. Product Portfolio
- 10.1.4. Financial Overview
- 10.1.5. Operating Business Segments
- 10.1.6. Business Performance
- 10.1.7. Recent Developments
- 10.2. BrightSource Energy Inc.
- 10.3. First Solar
- 10.4. SunPower Corporation
- 10.5. eSolar Inc.
- 10.6. Yingli Solar
- 10.7. Canadian Solar Inc.
- 10.8. Jinko Solar
- 10.9. Waaree Group
- 10.10. AccionaEnergia S.A.
- 10.11. Nextera Energy Sources LLC
- 10.12. Vivaan Solar
- 10.13. Trina Solar
- 10.14. Tata PowerSolar Systems Ltd.
- 10.15. Abengoa
- 10.16. Others.
- 10.1. Wuxi Suntech Power Co. Ltd.
- Chapter 11. Research Methodology
- 11.1. Research Methodology
- 11.2. Secondary Research
- 11.3. Primary Research
- 11.3.1. Analyst Tools and Models
- 11.4. Research Limitations
- 11.5. Assumptions
- 11.6. Insights From Primary Respondents
- 11.7. Why Custom Market Insights
- Chapter 12. Standard Report Commercials & Add-Ons
- 12.1. Customization Options
- 12.2. Subscription Module For Market Research Reports
- 12.3. Client Testimonials
List Of Figures
Figures No 1 to 30
List Of Tables
Tables No 1 to 51
Prominent Player
- Wuxi Suntech Power Co. Ltd.
- BrightSource Energy Inc.
- First Solar
- SunPower Corporation
- eSolar Inc.
- Yingli Solar
- Canadian Solar Inc.
- Jinko Solar
- Waaree Group
- AccionaEnergia S.A.
- Nextera Energy Sources LLC
- Vivaan Solar
- Trina Solar
- Tata PowerSolar Systems Ltd.
- Abengoa
- Others
FAQs
The key players in the market are Wuxi Suntech Power Co. Ltd., BrightSource Energy Inc., First Solar, SunPower Corporation, eSolar Inc., Yingli Solar, Canadian Solar Inc., Jinko Solar, Waaree Group, AccionaEnergia S.A., Nextera Energy Sources LLC, Vivaan Solar, Trina Solar, Tata PowerSolar Systems Ltd., Abengoa, Others.
Government policies have a significant impact on the Solar PV Market development by promoting the use of renewable energy sources through various incentives and programs. These comprise subsidies, government tax breaks, fiscal incentives, feed-in tariffs, renewable portfolio standards, net metering accounts, and others that make solar installations more affordable and accessible. Moreover, various regulations designed for the reduction of carbon emissions have resulted in the utilities and industrial sector moving towards greener energy sources and in turn have reinforced the growth of the whole solar PV industry.
The cost of the solar photovoltaic market has large impacts on the market growth and plays an important role in the adoption and growth of the solar energy market. The reduction in costs for the solar panels, inverters, and installation has made solar applications more inexpensive and affordable for the residential, commercial and utility scale users. With the cost of the photovoltaic systems reducing due to technology improvements and mass production, there have been more and more applications with increased adoption as the system costs become more affordable and more accessible for the end user.
According to the present analysis and forecast modeling, the market of solar photovoltaic will witness a significant growth of about USD 689 billion in the year 2035 with the growing innovative product launch, increasing battery cost, growing demand of clean energy with a CAGR of 8.5% between the years 2026 and 2035.
It is projected that North America will hold the largest market share in the solar photovoltaic market in the forecast period, with a share of about 48% of the global market share, which is attributed to the presence of major players and increasing technological advancements.
The Asia Pacific is expected to grow at a highest CAGR during the forecast period. The growth in the region is owing to the rising government initiatives and increasing emphasis on clean energy source.
The ongoing growth of the PV industry is mainly due to the global need for clean, renewable energy, along with supportive policies and the decreasing costs of PV modules, faster technological advancements in photovoltaic (PV) arrays, and more investments in solar plants, all of which are helping the market for PV technologies to grow.