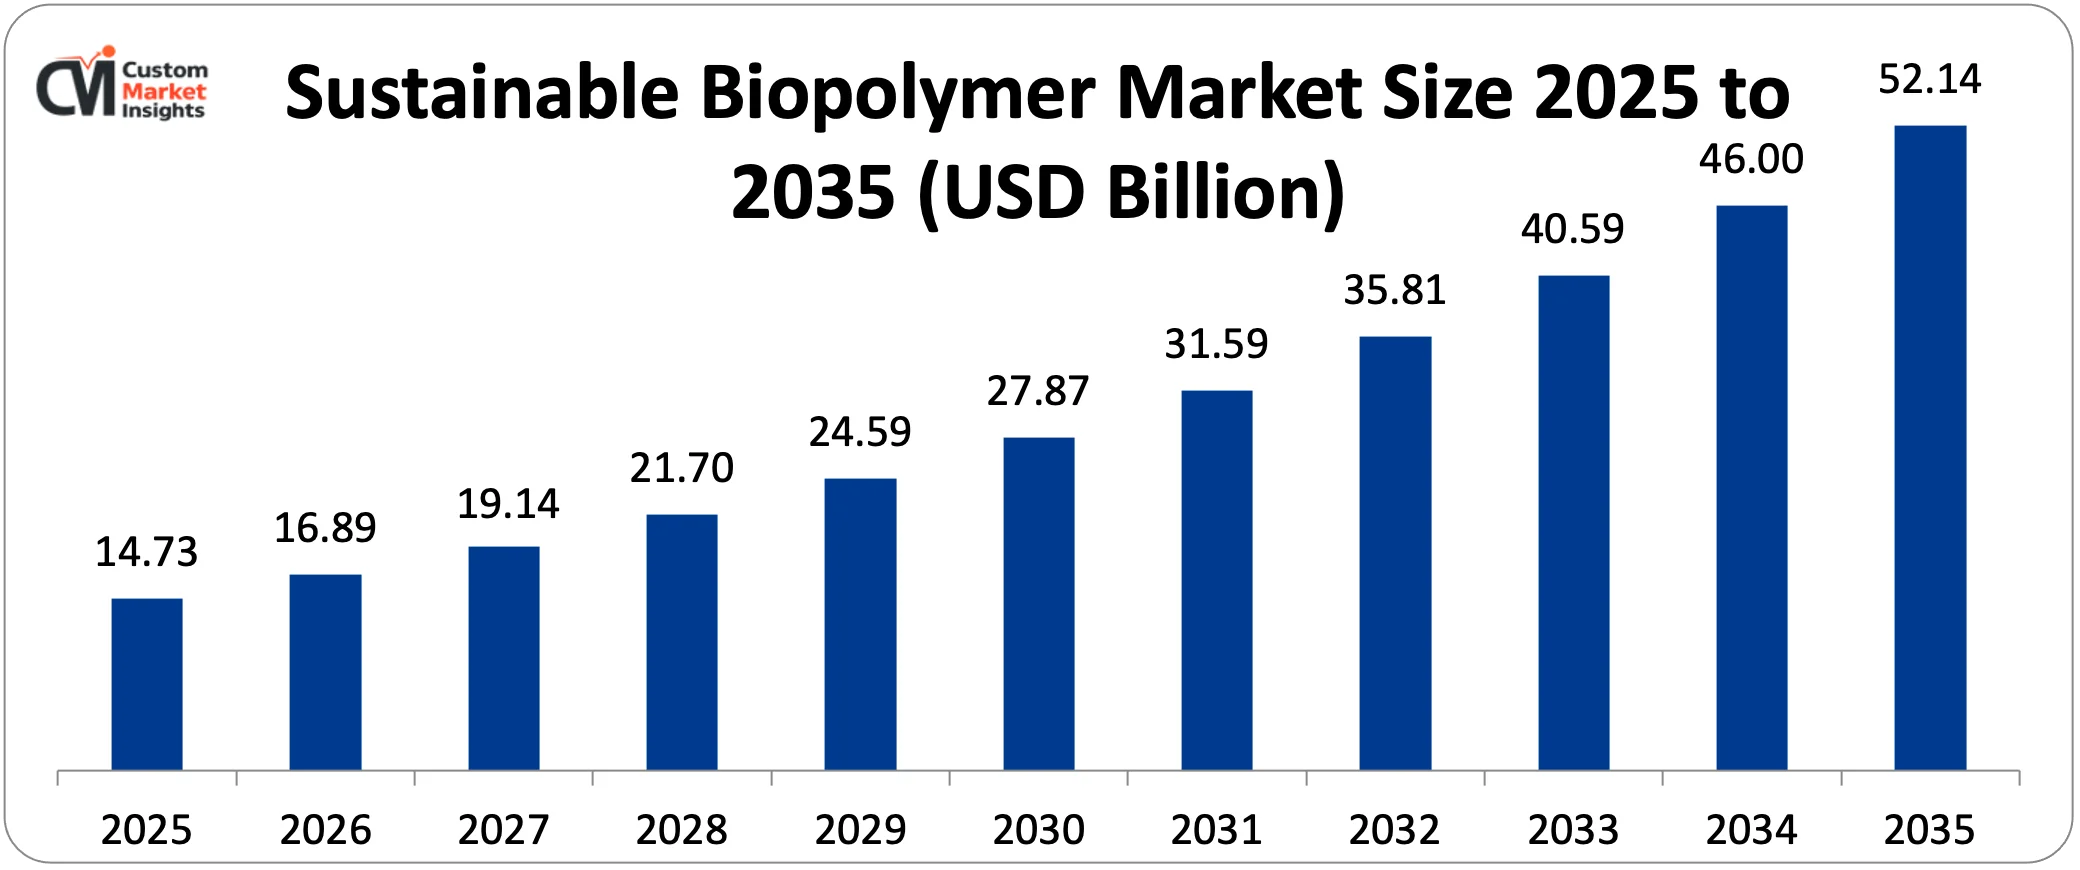
Valued at USD 16.89 Bn in 2026, the market is projected to reach USD 52.14 Bn by 2035, growing at a 13.2% CAGR. Europe holds the largest share, while Asia Pacific grows fastest. The report profiles 10 companies.
The global sustainable biopolymer market was valued at USD 16.89 Bn in 2026 and is projected to reach USD 52.14 Bn by 2035, growing at a CAGR of 13.2%. Europe is the largest regional market and Asia Pacific is growing fastest.
The global market for sustainable biopolymers is expected to grow from USD 16.89 billion in 2026 to about USD 52.14 billion by 2035, with a compound annual growth rate (CAGR) of 13.2% from 2026 to 2035.
The market is growing because of the faster global push to get rid of plastics made from fossil fuels, the growing commitment of companies in consumer-facing industries to be more environmentally friendly, the rapid progress in fermentation and biorefinery technologies that lower the cost of making biopolymers, the growing demand for products that are good for the environment, and the scaling of new feedstock platforms like agricultural waste, carbon dioxide, and methane.
Europe had the biggest share of the sustainable biopolymer market in 2025, with 34%. This was because it had the best rules in the world for biobased and biodegradable materials.
Asia Pacific is expected to grow the fastest, with a CAGR of 15.7% from 2026 to 2035. This is because biopolymer manufacturing investments are growing quickly in China, India, Thailand, and South Korea.
By type, polylactic acid (PLA) took up about 33% of the market share in 2025. This shows that it is the most commercially mature and affordable biopolymer in the world.
The polyhydroxyalkanoates (PHA) segment is growing the fastest, with a CAGR of 17.8% from 2026 to 2035. This is because it can break down in the ocean, compost at home, and has better properties.
By application, packaging had the biggest market share in 2025, at 38%. The agriculture segment is expected to grow the fastest, at a rate of 16.4% per year, from 2026 to 2035.
The food and beverage industry had the biggest share of total market revenue in 2025, making up 41% of it.
In 2024, sustainable biopolymers made up about 2.3% of all polymer production around the world, up from 1.4% in 2020. This shows that they are quickly gaining market share against a large base of conventional plastics, and they have a lot of room to grow even more through 2035.
Expanding Global Regulatory Frameworks Mandating Transition Away from Fossil-Based Plastics: The most structurally durable and commercially powerful force accelerating sustainable biopolymer adoption is the expanding body of legislation, regulatory mandates, and policy frameworks at national, regional, and municipal levels that are progressively restricting the use of conventional fossil-derived plastics across packaging, agriculture, food service, and consumer goods applications. The European Union's Packaging and Packaging Waste Regulation (PPWR) is moving through the legislative process and is expected to require all packaging to be either reusable, recyclable, or compostable by 2030. This directly creates a market for certified compostable biopolymer packaging across the EU's 27 member states, which is one of the world's largest consumer markets. The EU's Single-Use Plastics Directive, which is already in effect, has banned certain types of single-use plastics, such as plates, cutlery, straws, and stirrers. Biopolymer-based compostable alternatives are the main beneficiaries of these bans. As of 2025, more than 60 countries outside of the EU have some kind of restriction on single-use plastics. These include the UK's ban on single-use plastics, Canada's ban on certain plastic items under the Canadian Environmental Protection Act, India's expanded ban on single-use plastics that covers more formats since 2022, and bans or taxes in dozens of African, Asian, and Latin American countries. The total addressable market created by these regulatory actions is huge: the global market for single-use plastic packaging was worth about USD 195 billion in 2024. Even if sustainable biopolymer alternatives took 10% of that market, it would mean an extra USD 19.5 billion in demand on top of the current biopolymer market size. In France, Germany, Spain, the Netherlands, and more and more in Asia Pacific, Extended Producer Responsibility (EPR) programs charge companies extra for packaging based on how recyclable and compostable it is. This gives brand owners a direct financial reason to switch from regular plastic to biopolymer packaging. The United Nations Environment Programme (UNEP) is currently working on a global plastics treaty that 175 countries have signed. These countries are all committed to reaching a legally binding agreement. All these nations are determined to come up with a legally binding agreement. This becomes the second huge wave of regulation that analysts believe would compel nations and companies to adopt alternatives to plastic by 2030 and the future.
Corporate Sustainability Commitments and Science-Based Targets Driving Material Transitions Across Value Chains: Major multinational corporations are adopting corporate sustainability commitments, science-based emissions reduction targets, and ESG (Environmental, Social, and Governance) performance frameworks. Other large consumer goods companies, which have made explicit commitments to ensure all of their packaging is reusable, recyclable, or compostable, include Unilever, Nestle, Procter & Gamble, PepsiCo, and Danone with dates reaching as late as 2025 to 2030. One of the primary methods of fulfilling compostability promises by flexible and semi-rigid packaging formats is biopolymer substitution. Such brands as H&M, Patagonia, Stella McCartney, and Adidas have vowed to be more aggressive in their clothes and textiles by using more biobased and biodegradable fibers. PLA textiles, bio-polyester produced using sugarcane ethanol and cellulose lyocell fibers are all gaining popularity as substitutes for petroleum-based synthetics. BMW, Mercedes-Benz, Toyota, and Stellantis are companies in the automotive sector that consume more biobased polymers in the interior. The automotive biopolymers market is expanding at approximately 12.8 percent per annum owing to the necessity of lightening vehicles, the European end-of-life automobile laws that demand that vehicles should be recyclable and corporate sustainability reporting that demands a shift in the material specification. Boards are becoming more focused on making changes that will positively impact biopolymer demand due to investor pressure via ESG frameworks like the climate-related shareholder engagement of BlackRock, the Climate Action 100+, and sustainability-linked loan covenants of major banks. As of 2025, there are over 7,000 corporate signatories to the Science Based Targets initiative (SBTi), which makes them commit to reducing emissions following the Paris Agreement. To achieve this, they must decarbonize their supply chains, which in most cases entails substituting fossil-based plastics with biobased plastics. This introduces a vicious cycle between financial markets, corporate strategy and material procurement decisions that will have a long term preference towards sustainable biopolymers.
What are the Major Advances Changing the Sustainable Biopolymer Market Today?
Next-Generation Fermentation and Biorefinery Technologies Driving Cost Parity With Conventional Plastics: The fundamental economic barrier that has historically constrained sustainable biopolymer adoption — a substantial cost premium of 50–200% over functionally equivalent conventional plastics — is being progressively eroded by advances in fermentation process engineering, metabolic pathway optimization, feedstock flexibility, and biorefinery integration that are improving production yields, reducing raw material costs, and achieving economies of scale as biopolymer production capacity expands globally. For PLA, the most common commercial biopolymer, advances in lactic acid fermentation using engineered microbial strains with improved glucose-to-lactic acid conversion efficiency exceeding 95% on a mass basis, combined with the commissioning of new large-scale integrated PLA production facilities operating at 75,000–100,000 metric tonnes per year, are progressively driving PLA production costs toward the USD 1.00–1.20 per kilogram range — approaching the cost of general-purpose polypropylene and substantially below PLA costs of USD 2.00–2.50 per kilogram prevalent as recently as 2018. For PHA biopolymers, which have better performance profiles like marine biodegradability and home compostability, synthetic biology engineering of microorganisms like Cupriavidus necator, Halomonas spp., and engineered Escherichia coli strains has improved PHA cell content from 60–70% of dry cell weight in commercial processes a decade ago to 80–90% in leading industrial implementations. This has greatly lowered the cost of processing fermentation broth. Using low-cost feedstocks that come from waste, such as lignocellulosic agricultural residues, used cooking oil, food processing waste streams, crude glycerol from biodiesel production, and industrial carbon dioxide and methane waste gases, is lowering the cost of feedstocks even more. Historically, the cost of feedstocks has been the biggest single factor in the cost of making biopolymers. At the same time, it is lowering the carbon footprint of biopolymer products by keeping waste streams out of lower-value disposal pathways. Integrated biorefinery models, where a single facility makes biopolymers, biofuels, biochemicals, and biomass energy from the same feedstock input, are showing good overall project economics that make the capital investment needed for world-scale biopolymer production facilities worth it. Projects in Thailand (PTT's bio-complex), the United States (multiple PHA projects), and Europe (Novamont's biorefinery model) are all showing that they can be profitable.
Performance Enhancement Through Polymer Blending, Compatibilization, and Nanocomposite Technologies: A persistent technical limitation of commercially available biopolymers — including PLA's brittleness and low heat deflection temperature, starch blends' moisture sensitivity, and PHA's relatively high production cost and processing challenges — has historically restricted the addressable application scope for sustainable biopolymers relative to the broad utility of commodity petroleum-based plastics. Improvements in polymer blending, reactive compatibilization, and nanocomposite reinforcement are systematically overcoming these performance constraints, broadening the technically feasible application scope for sustainable biopolymers into rigorous engineering domains that were previously unattainable. When PLA is mixed with PBAT (polybutylene adipate terephthalate), polyurethane elastomers, or impact modifiers made from biobased epoxidized vegetable oils, it becomes more flexible and can stretch more than 200% before breaking. This makes PLA a good choice for flexible packaging, living hinge applications, and injection-molded parts that need to be strong against impact. By blending PDLA (poly D-lactic acid) with PLLA (poly L-lactic acid) in a stereocomplex way or by optimizing the nucleating agent, the heat deflection temperature of PLA goes above 120°C. This makes PLA useful for hot-fill packaging, dishwasher-safe consumer products, and car interior parts that need to work at high temperatures. Biopolymer nanocomposites that contain cellulose nanocrystals (CNC), nanoclay, or bacterial cellulose at loadings of 2–5 wt% show a 30–60% increase in tensile modulus and a 50–80% decrease in oxygen transmission rates compared to neat biopolymer matrices. This means that nanocomposite biopolymer films can meet the barrier performance requirements for packaging snacks, coffee, and meat. The combination of better intrinsic properties, blending technology, and nanocomposite enhancement is constantly increasing the amount of total global polymer consumption that can be replaced with sustainable biopolymer alternatives. This amount is expected to grow from about 12–15% today to 25–30% of total polymer applications by 2030.
Agricultural Biopolymer Mulch Films and Soil Amendment Applications Driving Volume Growth: Agriculture is also opening up as one of the largest-volume growth markets of the sustainable biopolymers, as the shift towards certified biodegradable and compostable biopolymer mulch films, which degrade in situ following crop harvest without the need for mechanical removal, replaces the conventional polyethylene mulch films, which are an accumulating source of persistent plastic pollution in the agricultural soils. Conventional PE mulch films are very good at stopping weeds, keeping soil moisture, and extending the growing season. However, they are used around the world at a rate of about 2.5 million metric tonnes per year. When film fragments are left behind after tillage, they cause serious soil microplastic contamination. In intensively farmed areas of China, Europe, and the United States, studies have found PE microplastic concentrations of more than 1,000 particles per kilogram of soil. Biodegradable mulch films made from PBAT/PLA blends, PHA, and thermoplastic starch have been approved for use in organic and conventional farming in Europe and the United States. They break down in the soil within one to two growing seasons, according to EN 17033 in Europe and ASTM D5988 in the United States. China uses about 75% of all plastic mulch film in the world. The Chinese Ministry of Agriculture and Rural Affairs is speeding up the adoption of biodegradable mulch films in key agricultural provinces by offering subsidies to farmers to make up for the higher cost of biopolymer mulch compared to regular PE. From 2026 to 2035, the agriculture biopolymer segment is expected to grow at a CAGR of 16.4%. This is one of the fastest-growing volume markets for biopolymer materials in the world, thanks to the huge opportunity to replace PE mulch. By 2030, the market for biodegradable agricultural films alone is expected to be worth USD 4.2 billion.
Category Wise Insights
By Type
Why Does Polylactic Acid Lead the Sustainable Biopolymer Market?
PLA is the biggest material segment in 2025, making up about 33% of the total market share. This dominance shows that PLA is the most commercially developed, most widely certified, and most affordable sustainable biopolymer in the world. By 2025, production facilities run by NatureWorks in the United States and Thailand, TotalEnergies Corbion in Thailand, and several Chinese companies, such as Hisun Biomaterials and COFCO, will have a combined production capacity of more than 500,000 metric tons per year.
PLA's market leadership is based on a number of interconnected competitive advantages: a well-established industrial supply chain of lactic acid producers and PLA polymerization operators providing reliable commercial-scale supply; broad certification across major compostability standards including EN 13432, ASTM D6400, and TÜV Austria OK Compost Industrial enabling use in European and North American municipal compostable organics programs; a versatile processing profile compatible with existing thermoplastics manufacturing equipment including injection molding, film blowing, thermoforming, and fiber spinning; and an improving cost position as production scales and fermentation efficiency improves, with PLA pricing expected to converge toward USD 1.10–1.30 per kilogram at mature production scale by 2030.
PLA's uses include rigid packaging like cups, trays, clamshells, and bottles, where its optical clarity, stiffness, and food contact compliance are helpful flexible packaging films and laminates, where its barrier properties meet the needs of bakery, produce, and dry food applications; disposable food service items like cutlery, plates, and straws, where compostability certification allows use in municipal organics programs nonwoven fabrics and fibers for hygiene, agricultural, and technical textile applications and 3D printing filaments, where PLA is the most widely used material in the desktop FDM printing segment worldwide.
The fastest-growing type of biopolymer is PHA-based biopolymers, which are expected to grow at a rate of 17.8% per year from 2026 to 2035. This is because PHA has a unique combination of marine biodegradability (which allows it to break down in open ocean environments, unlike PLA), home compostability, and property profiles that range from rigid crystalline PHB to flexible elastomeric mcl-PHA. This means that one family of biopolymers can be used for a wide range of applications, including rigid packaging, flexible films, fibers, and adhesives. Danimer Scientific in Kentucky, CJ BIO in South Korea and the US, Kaneka in Japan, and Shenzhen Ecomann in China are all building new PHA production facilities. These facilities will gradually increase the global supply of PHA. By 2030, PHA prices are expected to fall to within 30–50% of PLA prices, which will greatly expand the market for PHA.
By Application
Why Does Packaging Dominate the Sustainable Biopolymer Application Landscape?
Packaging is the biggest application area, making up about 38% of the total market share in 2025. According to the estimates of the Ellen MacArthur Foundation, around 141 million tons of plastic packaging are produced annually worldwide. This shows that packaging is the biggest single use of traditional plastics in the world. This means that there is a huge opportunity for sustainable biopolymers to take over this market. The packaging application has both flexible (such as films, pouches, bags, wraps, and laminates) and rigid (such as bottles, jars, trays, clamshells, and caps) formats.
Both types of formats use biopolymers, although at different rates and on varying material platforms. Flexible packaging: PLA/PBAT and PHA-based films are the most widespread types of flexible packaging, whereas the most often used types of rigid packaging are PLA injection-molded and thermoformed. Food and drink brands' promises to be more environmentally friendly are driving the most demand. Globally, approximately 70% of all plastic packaging produced is food based and leading food brands are feeling the pressure to alter their packaging both by regulators and consumers. This renders the food packaging sub- segment the largest demand driver in the packaging application.
Regulatory catalysts are particularly high in the packaging industry. As an illustration, the compostability standards of the EU PPWR, national prohibitions on some forms of plastic packaging and the packaging levies provided by EPR directly affect the industry. Such regulations are generating a powerful regulatory-imposed demand urge in the marketplace that is already impacting brand buying choices and increasing demand among biopolymer suppliers. The packaging segment is expected to grow at a CAGR of 12.8% from 2026 to 2035.
Flexible packaging will be more rapidly increasing as compared to rigid packaging since flexible packaging requires more variety of polymer grades and laminates, making the demand on new materials high. The most rapidly developing application is agriculture with a CAGR of 16.4. The primary factor behind the volume demand will be the replacement of traditional PE film by the biodegradable mulch film. Other drivers are the increasing use of biopolymer-based slow-release fertilizer coating, biodegradable seedling trays as an alternative to polystyrene products, and compostable plant ties and clips as a substitute for conventional plastic horticulture fittings.
By End Use Industry
Why Does Food & Beverage Lead the End Use Industry Segment?
The food and beverage industry will make up about 41% of all sustainable biopolymer market revenue in 2025. This is because it has the highest packaging intensity of any consumer goods sector, with almost every food and beverage product needing primary, secondary, and sometimes even tertiary packaging. It also has the strongest regulatory and consumer sustainability pressure of any end use industry.
There have been steps taken to meet food contact compliance requirements for biopolymer materials, such as FDA food contact notifications in the United States and EU food contact regulations under Regulation (EU) 10/2011. This has made it possible for major commercial biopolymers like PLA, PHA, cellulose acetate, and PBS to be used in direct food contact applications for packaging fresh produce, baked goods, dairy products, meat, candy, and drinks. The composting end-of-life pathway is especially well-suited for food packaging. This is because regular plastic food packaging is hard to recycle when it gets contaminated, but certified compostable biopolymer food packaging can be collected with food waste in municipal organics programs.
This turns a problem with contaminated waste into an opportunity for resource recovery that both municipalities and food brands want to take advantage of. Consumer goods are the second-largest end use, accounting for about 18% of market revenue. This includes packaging for personal care and cosmetics, household goods, retail bags and wraps, and long-lasting biopolymer-based parts for consumer products. The automotive end use industry makes up about 9% of the market right now, but it is growing at a rate of 12.8% per year thanks to OEMs using biobased interior polymers for things like door panels, trunk liners, floor mats, and instrument panels.
Report Scope
Feature of the Report
Details
Market Size in 2026
USD 16.89 billion
Projected Market Size in 2035
USD 52.14 billion
Market Size in 2025
USD 14.73 billion
CAGR Growth Rate
13.2% CAGR
Base Year
2025
Forecast Period
2026-2035
Key Segment
By Type, Application, End Use Industry and Region
Report Coverage
Revenue Estimation and Forecast, Company Profile, Competitive Landscape, Growth Factors and Recent Trends
Regional Scope
North America, Europe, Asia Pacific, Middle East & Africa, and South & Central America
Buying Options
Request tailored purchasing options to fulfil your requirements for research.
Regional Analysis
How Big is the Europe Market Size?
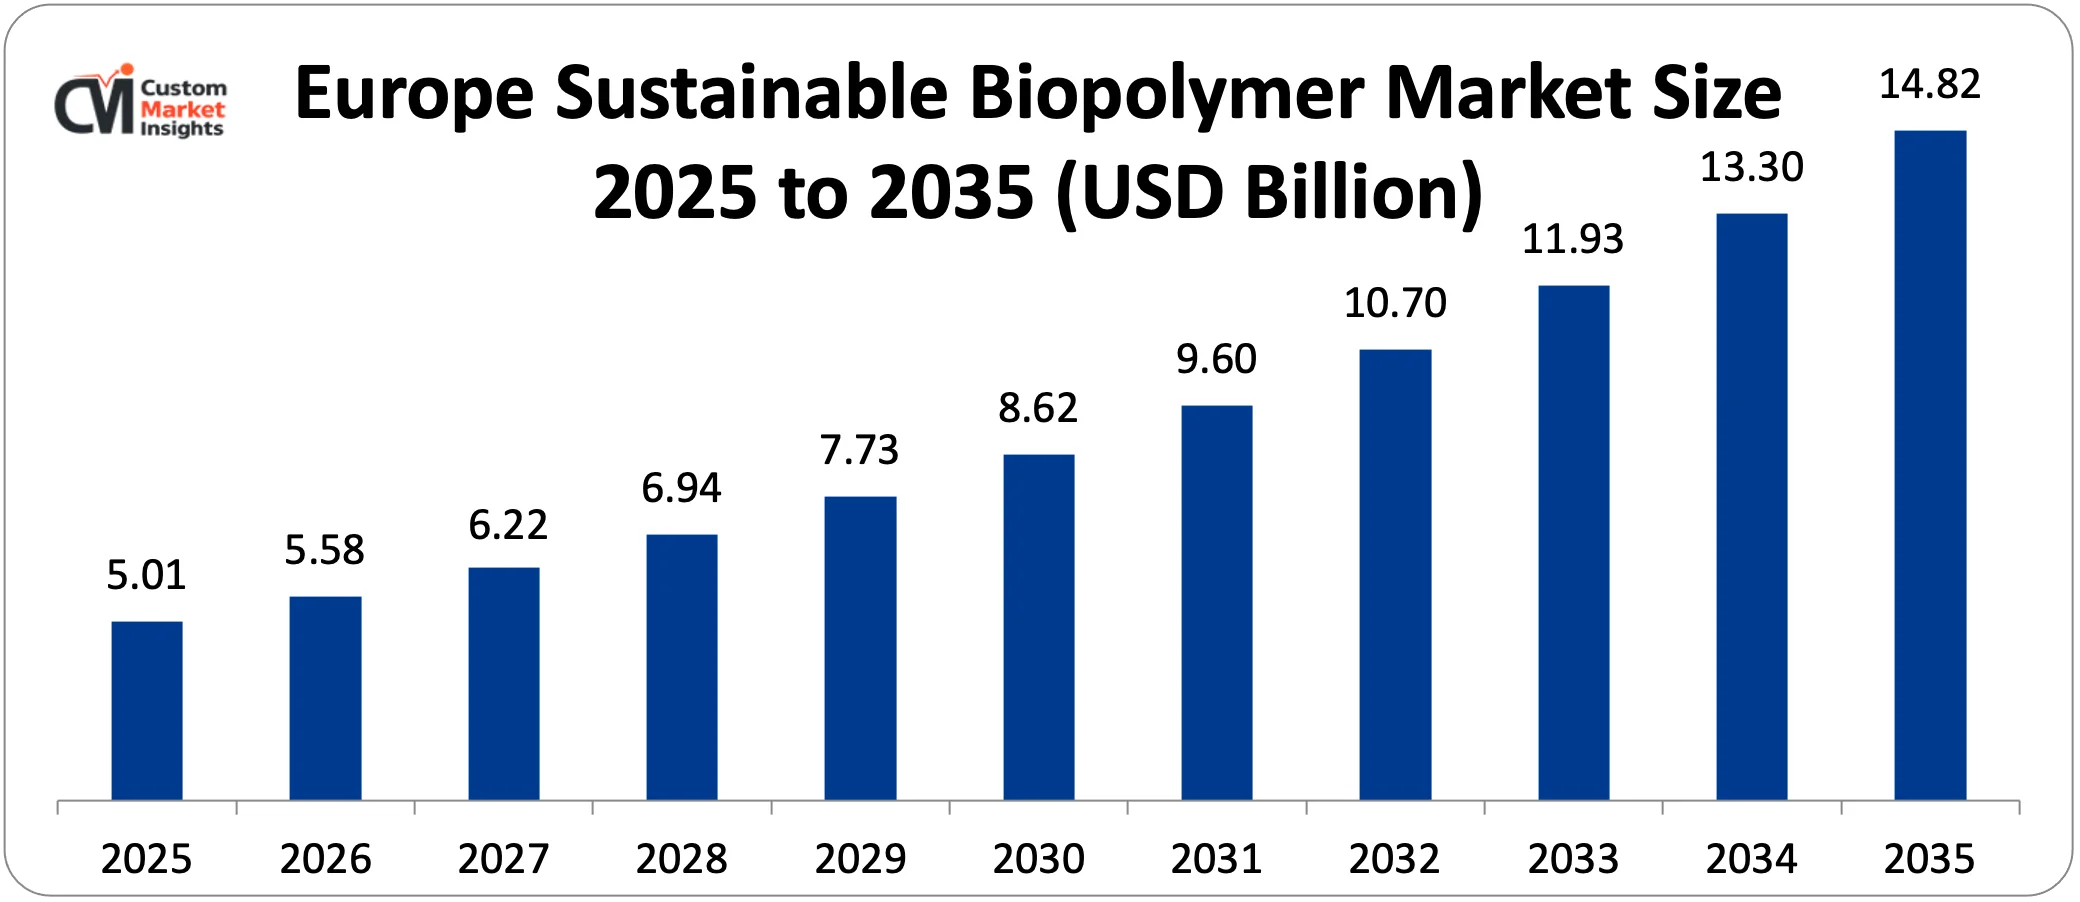
The European sustainable biopolymer market size is estimated at USD 5.01 billion in 2025 and is projected to reach approximately USD 14.82 billion by 2035, growing at a CAGR of 11.4% from 2026 to 2035.
Europe will make about 34% of the world's sustainable biopolymer market revenue in 2025. This is because it has the most comprehensive and growing set of rules for sustainable materials, a large and sophisticated consumer base that is willing to pay more for environmentally certified products, an advanced industrial composting infrastructure that can handle certified compostable biopolymer materials, and a concentration of biopolymer production, processing, and brand adoption in Germany, Italy, France, the Netherlands, and Belgium.
The EU's rules and regulations, which include the Single-Use Plastics Directive, the Packaging and Packaging Waste Regulation, the EU Green Deal's Farm to Fork strategy, the Circular Economy Action Plan, and EPR schemes at the member state level, create the most consistent and commercially predictable policy framework for the global adoption of sustainable biopolymers. This allows brand owners and packaging converters to confidently invest in long-term material transitions. Italy has the most advanced single national market for compostable biopolymers in Europe.
Since 2018, all supermarkets in Italy have had to use compostable produce bags. Organic waste has to be collected separately, which has led to the creation of composting infrastructure to process compostable packaging. Novamont, a global leader in starch-based biopolymers with its headquarters in Novara, is also in Italy. This makes Italy the highest per-capita consumer of certified compostable biopolymer packaging in the world. Germany has the largest single national market for sustainable biopolymers in Europe. This is because it has an advanced industrial composting network that processes more than 18 million tonnes of organic waste every year and a strong retail sector that leads the way in making packaging more environmentally friendly.
Why is Asia Pacific the Fastest-Growing Regional Market?
In 2025, Asia Pacific will account for about 28% of global market revenue, or about USD 4.12 billion. It will grow at the fastest regional CAGR of 15.7% from 2026 to 2035. This is because of the huge amount of polymer used in manufacturing and consumer goods, the rapidly growing number of single-use plastics laws in the region, the rising investment in domestic biopolymer manufacturing, and the growing demand for sustainable packaging alternatives in the modern retail and food service sectors.
China is both the largest single national market and the fastest-growing production base in the Asia Pacific region. Since 2020, China's domestic biopolymer production capacity has grown significantly. Domestic PLA producers like Hisun Biomaterials, COFCO, and Zhongke Guosheng, as well as domestic PBAT producers like Kingfa Science & Technology and Xinjiang Blue Ridge Tunhe Chemical, are all making products for the large domestic market created by national biodegradable plastics policy requirements.
India's sustainable biopolymer market is growing at an estimated 17.3% CAGR. This is because the government has expanded its ban on single-use plastics, the packaged food industry is growing quickly and needs biopolymer packaging, and there is more investment in domestic biopolymer production thanks to the Production Linked Incentive (PLI) scheme for specialty chemicals. Thailand is becoming a major biopolymer production center. PTT's integrated bio-complex, which makes PLA from lactic acid derived from sugarcane at a commercial scale, has made the country a major regional supplier to Southeast Asian, Japanese, and export markets.
Why is North America Experiencing Steady and Accelerating Growth?
In 2025, North America will account for about 22% of the world's market revenue. From 2026 to 2035, it is expected to grow at a CAGR of 11.6%. The region's growth is being helped by more state-level regulations, more foodservice composting programs in big cities, the growing U.S. natural and organic food sector (which is an early adopter of sustainable packaging), and more investment by domestic biopolymer producers in expanding their production capacity to meet the expected demand wave that will come from more states adopting sustainable packaging standards.
Why is the Middle East & Africa an Emerging Opportunity?
The LAMEA region will account for about 8% of global market revenue in 2025, but it is expected to grow at a CAGR of 13.9% from 2026 to 2035. This is due to the implementation of plastic bans in Gulf Cooperation Council countries, Brazil's large base of sustainable biopolymer production and consumption anchored by Braskem's biobased polyethylene made from sugarcane ethanol, South Africa's growing packaged consumer goods industry, and multinational brands operating in LAMEA markets adopting sustainable packaging standards more broadly.
Brazil is in a unique position because it is both a major producer of biopolymers (Braskem's Green PE, which is made from sugarcane ethanol on a commercial scale in Triunfo, is the largest single-facility biobased polyethylene production operation in the world) and a growing consumer of sustainable biopolymer packaging. This is due to the growth of modern retail and people's growing awareness of environmental issues.
Top Players in the Market and Their Offerings
NatureWorks LLC
Novamont S.p.A.
TotalEnergies Corbion
Danimer Scientific
BASF SE
Braskem S.A.
Mitsubishi Chemical Group Corporation
Arkema S.A.
Corbion N.V.
Toray Industries Inc.
Others
Key Developments
The market has undergone significant developments as industry participants seek to expand capabilities and enhance product portfolios.
In March 2025:NatureWorks announced that it would start making commercial-scale products at its new integrated PLA manufacturing facility in Thailand. The facility will produce 75,000 metric tonnes of Ingeo PLA resin per year from lactic acid made from Thai sugarcane. This is the largest addition to global PLA production capacity in the market's history and will greatly improve PLA supply security and cost position for customers in Asia Pacific and export markets.
In February 2025:Danimer Scientific announced that its expanded PHA fermentation and extraction facility in Bainbridge, Georgia, had been successfully put into service. This increased the facility's nameplate PHA production capacity to 65 million pounds per year. The extra capacity will be used to meet the growing demand from consumer goods brands that need certified marine biodegradable and home compostable biopolymer materials for flexible packaging, food service, and agricultural uses.
These market moves have aided companies in enhancing their market positions, expanding their capabilities, diversifying their geographical supply networks, and capitalizing on the emerging trend of fossil-based plastics to more eco-friendly biopolymer substitutes within the packaging, agriculture, motor, and consumer goods value chain.
Regional Coverage:
North America
U.S.
Canada
Mexico
Rest of North America
Europe
Germany
France
U.K.
Russia
Italy
Spain
Netherlands
Rest of Europe
Asia Pacific
China
Japan
India
New Zealand
Australia
South Korea
Taiwan
Rest of Asia Pacific
The Middle East & Africa
Saudi Arabia
UAE
Egypt
Kuwait
South Africa
Rest of the Middle East & Africa
Latin America
Brazil
Argentina
Rest of Latin America
CMI.Market Research Report2026-2035
Global Sustainable Biopolymer Market 2026 – 2035
Updated: September 2026 · Formats: PDF, Excel, PPT
Who are the key players in the Sustainable Biopolymer market?
The key players in the market are NatureWorks LLC, Novamont S.p.A., TotalEnergies Corbion, Danimer Scientific, BASF SE, Braskem S.A., Mitsubishi Chemical Group Corporation, Arkema S.A., Corbion N.V., Toray Industries Inc., Others.
What role do government regulations play?
Government regulations operate as the most powerful accelerant of sustainable biopolymer market development through multiple complementary mechanisms: outright bans on specific conventional plastic formats creating direct substitution demand for biopolymer alternatives; EPR fee structures imposing per-unit packaging levies calibrated to material sustainability performance that shift the economic calculus of packaging material selection; public procurement policies in the EU, UK, and several Asian nations requiring certified sustainable packaging in government-operated food service, healthcare, and public events; national biobased economy strategies in Thailand, Brazil, the Netherlands, and Germany providing direct capital support for biopolymer production investment; composting infrastructure investment programs creating the end-of-life pathways required to substantiate compostability claims and enable municipal organics co-collection of biopolymer packaging; and carbon pricing mechanisms in the EU Emissions Trading System and emerging national equivalents increasing the lifecycle cost of fossil-derived plastics relative to biobased alternatives with more favorable carbon profiles. The combination of these different regulatory tools, voluntary corporate commitments, and consumer preferences for sustainability creates a compounding adoption dynamic that keeps the market growing at a double-digit rate until 2035.
How does pricing impact market adoption?
The current prices of PLA are approximately USD 1.50-2.20 per kilogram, polypropylene USD 0.90-1.20 per kilogram, and LDPE USD 0.80-1.10 per kilogram. PHA is USD 3.50-6.00/kg to produce due to increased difficulty in production and more complex fermentation and isolation. This cost gap is narrowing, however, due to several factors: the increased capacity to produce biopolymers, which reduces the cost; agricultural feedstock diversification to less expensive waste streams; the levies of EPR and carbon prices, which increase the cost of traditional petroleum-based plastics; and performance improvements, which allow biopolymers to be used as high-value substitutes in high-value applications, rather than as commodity uses by 2035. They also predict that PHA prices will reach USD 2.00 to 2.50 per kilogram at commercial production scale by 2030, which is the point at which it becomes cost-competitive with engineering plastics like ABS and polycarbonate in applications that require different levels of performance.
What is the projected market size by the end of the forecast period?
Based on current analysis, the market is projected to reach approximately USD 52.14 billion by 2035. This is because of regulatory-mandated plastic substitution across major markets, corporate sustainability commitments leading to procurement specifications across global consumer goods supply chains, PHA cost reduction allowing mainstream packaging applications that were only available to PLA and conventional plastics, agricultural biodegradable film adoption at scale across China, Europe, and North America, and the geographic expansion of biopolymer production and consumption into Southeast Asia, India, and LAMEA, at a CAGR of 13.2% from 2026 to 2035.
Which region is anticipated to dominate the market?
Europe is expected to keep the biggest share of revenue in the early years of the forecast period. However, by about 2031, Asia Pacific is expected to have more revenue than Europe because its growth rates are different. By 2035, Europe will have about 29% of global revenue, and Asia Pacific will have about 33%. Europe's advanced regulations, mature composting infrastructure, and leadership in brand sustainability will keep its market position strong, with higher biopolymer prices and more advanced application penetration. In contrast, Asia Pacific's sheer volume growth, driven by increased production and demand from regulations, will lead to the largest absolute revenue increases through 2035.
Which region is expected to grow at the fastest CAGR?
The fastest growth is anticipated to be in Asia Pacific which is projected to increase at 15.7 per year between 2026 and 2035. The reason is that China, India, and Thailand are rapidly expanding their domestic biopolymer manufacturing capacity, China, India, South Korea, Japan, and Southeast Asian nations are enacting more laws against single-use plastic, China has a national mandate on biodegradable mulch films, and the packaged food, consumer goods, and e-commerce sectors are all rapidly expanding and require more sustainable packaging. The individual national market of India is expanding most rapidly at 17.3% CAGR. This is due to increased plastic bans and the Production Linked Incentive scheme, which facilitates the manufacturing of biopolymers in the country.
What are the key driving factors influencing market growth?
The Global Sustainable Biopolymer Market is predicted to experience substantial growth driven by over 60 countries implementing single-use plastics restrictions, creating direct displacement demand; corporate sustainability commitments from major consumer goods, food, and automotive companies targeting 100% sustainable packaging by 2025–2030; PLA production cost reduction toward USD 1.10–1.30 per kilogram at commercial scale improving price competitiveness against conventional plastics; China's national mandate driving biodegradable mulch film adoption across key agricultural provinces representing 75% of global plastic mulch film usage; PHA segment growth at 17.8% CAGR driven by marine biodegradability properties uniquely valuable for reducing ocean plastic pollution; advanced biopolymer performance improvements through nanocomposite and blending technologies expanding technically addressable application scope; and novel carbon-capture and waste-feedstock biopolymer production routes achieving certified carbon-negative lifecycle performance and attracting premium sustainability-motivated brand adoption.
Rushikesh Dorge is a seasoned Market Research and Business Consulting Professional with over six years of experience in market intelligence, competitive analysis, forecasting, and business strategy. At Custom Market Insights, he helps organizations identify growth opportunities and make informed decisions by transforming complex market data into actionable insights.