Energy As a Service Market Size, Trends and Insights By Service Type (Supply Services, Energy Optimization Services, Demand Services), By End Use (Commercial, Industrial), and By Region - Global Industry Overview, Statistical Data, Competitive Analysis, Share, Outlook, and Forecast 2026 – 2035
Report Snapshot
CAGR: 12.6%
| Study Period: | 2026-2035 |
| Fastest Growing Market: | Asia Pacific |
| Largest Market: | North America |
Major Players
- Engie
- Siemens
- Veolia
- EDF
- Others
Reports Description
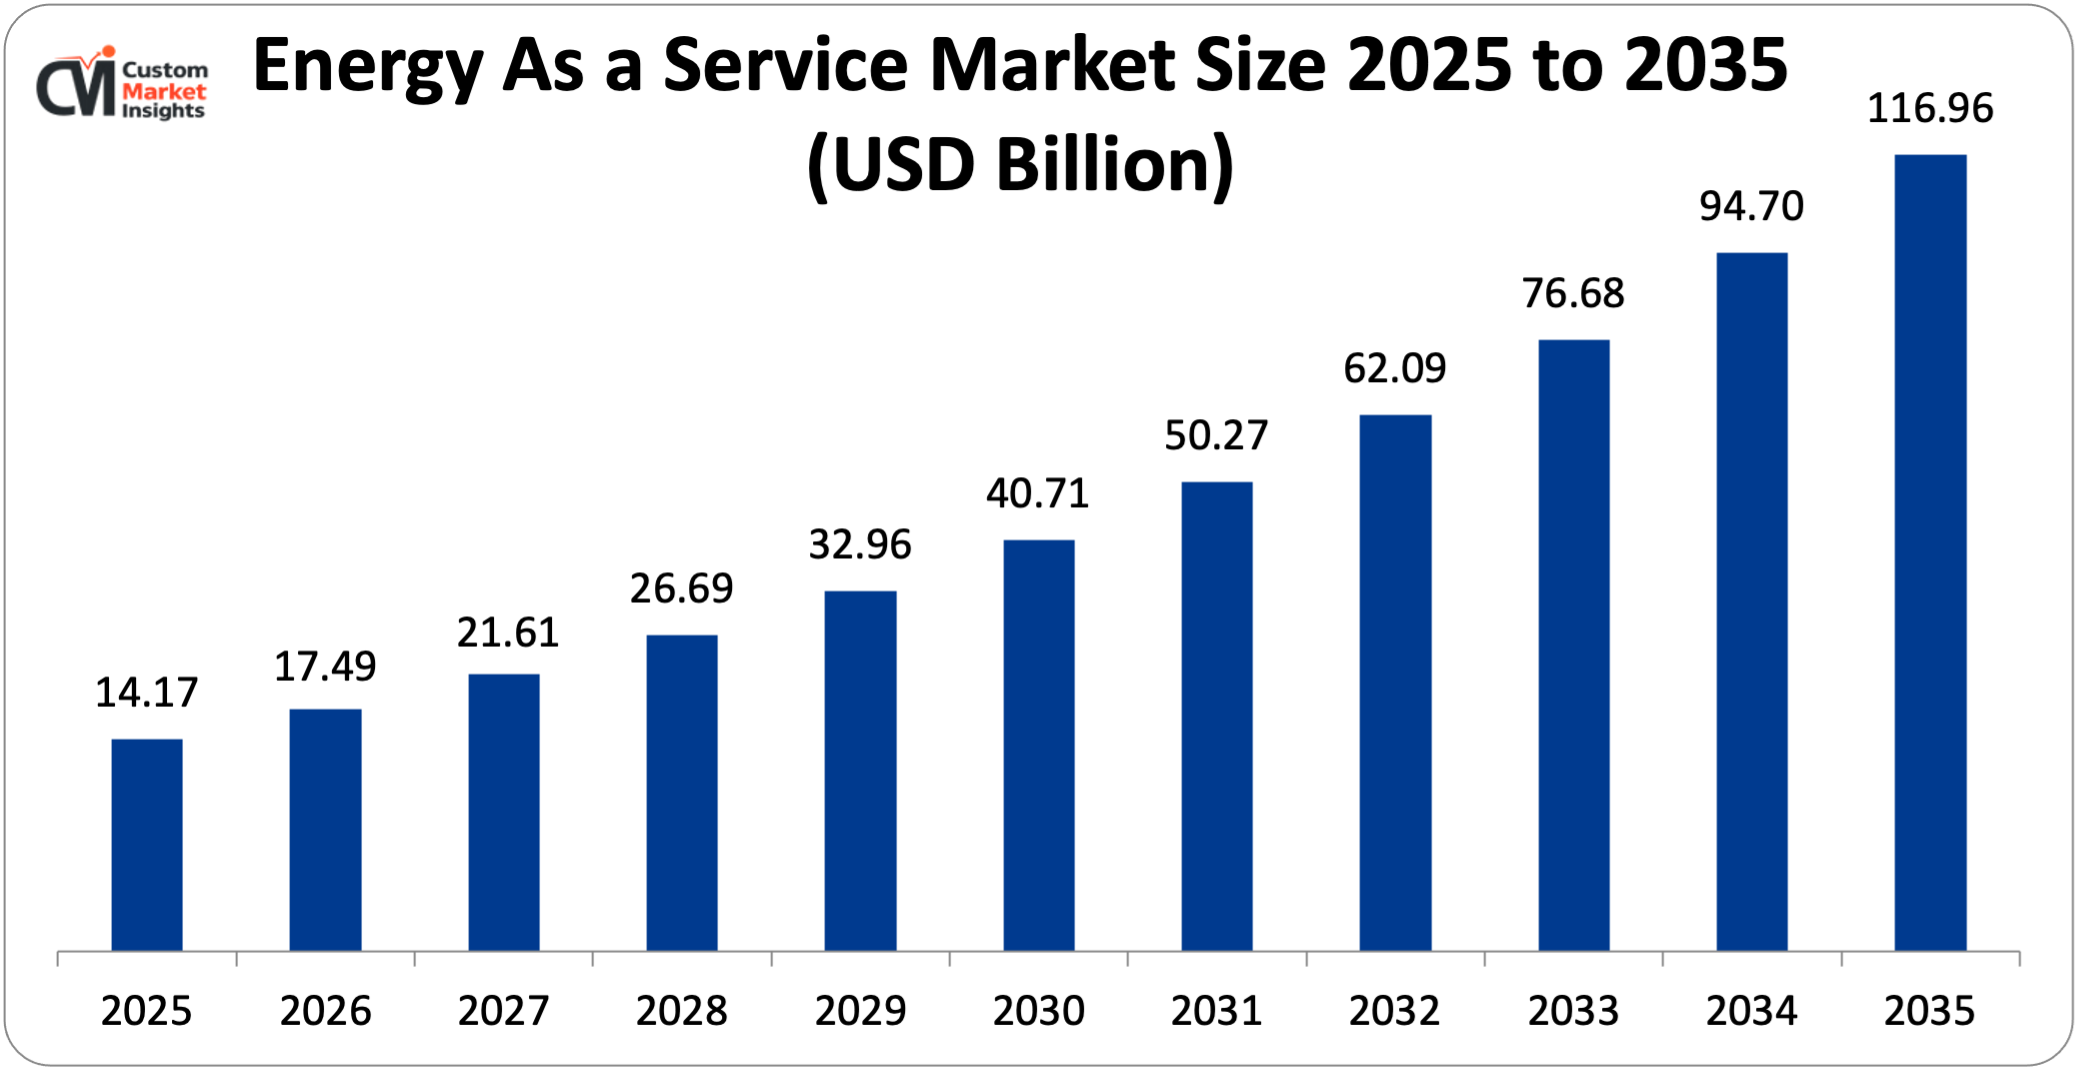
The market size of global energy as a service will be estimated at USD 77.4 billion in 2025 and is expected to grow to between USD 87.2 billion in 2026 and about USD 253.5 billion by 2035, with a current CAGR (compound annual growth rate) of 12.6% during the period of 2026 to 2035. Energy as a service (EaaS) refers to the use of novel products, technologies, financial instruments, and technological approaches as one or two elements of the energy portfolio of the customers, such as planning, system management, procurement of energy resources, and asset management, among others.
Energy as a service is a newly emerged business model that helps the industries to resolve in-between competition and crucial insights of the business and provides a solution for the growth of existing and newly developed businesses. EaaS comprises third-party manufacturers, distributors, and potentially creative business strategies deploying niche technical innovations, funding, or acquisition, including the purchasing of PHP solar power, deregulated retail electricity sector supplies, and the production of contracts for energy supplies. The market is driven by several factors, such as rising government initiatives, decreasing cost of renewable energy technologies, growing demand for energy efficiency and cost optimization, and many others.
Market Highlight
- In 2025, North America will dominate the global market with an estimated market share of 43%. The increasing focus on green energy drives the market growth.
- The Asia Pacific is growing at the highest CAGR of 16.8% over the analysis period. The growing investment by the key market players drive the regional growth.
- By service type, the demand services segment dominated the industry in 2025 of over 40%.
- By end use, the commercial segment captures the largest market share in 2025 of over 50%.
Significant Growth Factors
The energy as a service market trends present significant growth opportunities due to several factors:
- Growing Demand for Resilient Energy Infrastructure: The demand for resilient energy infrastructure is a notable area of focus and forms a key demand factor for the EaaS market, as market players and governments look to make investments in resilient and secure energy systems in response to the increasing number of power outages and outages caused by extreme weather events and erratic energy demands in the grid. Resilient energy infrastructure such as microgrids, battery storage, and renewable distributed energy systems can operate independently of the traditional energy grid and are capable of providing backup during outages, making them critical to industries and communities. Governments and other large-scale institutions are heavily investing in resilient energy infrastructure. For example, they are funding community microgrid and grid-hardening projects to bolster resilience billions are allocated to grid resilience, including funding for community “resilience hubs” and microgrid projects for disaster response. Australia has provided AUD 50 million to trial microgrid systems that increase the resilience of regional energy systems. Governments are also applying public financiers such as green banks to accelerate investments in clean and resilient energy infrastructure by providing low-cost funds for project finance, which reduces the overall risk of projects, thereby increasing private sector investments at scale. Simultaneously, private sector investments are also ramping up in resilient energy infrastructure to meet customer demand and market trends. Multiple large energy companies and solution providers are investing millions of dollars in resilient infrastructure projects that deliver assets through EaaS models. For example, in one project, multiple players, including industry players, raised US$7.5 billion to build resilient energy assets (microgrids, solar, batteries, and EV chargers) to bring in energy reliability and sustainability at scale. Further, private companies are funding resilient distributed energy infrastructure like backup power batteries and microgrids in places with unreliable grid functionality to bring in the strength of resilient infrastructure and the assurance of reliable power to avoid costly outages. In some cases, governments utilize public-private partnership (PPP) models wherein they lend the land and provide incentives or partial funding, and private energy companies design, finance, and operate resilient energy assets wherein customers utilize seamless resilient energy infrastructure and pay for performance.
- Increasing Adoption of Renewable Energy: The growing penetration of renewable energy is another primary factor fueling the growth of the EaaS market as organizations look for cleaner and more affordable energy sources that are sustainable, without having to bear the initial costs associated with acquiring such sources. As the world begins to decarbonize and many countries tighten restrictions on emissions, the adoption of renewables is happening at a rapid pace. Businesses and governments are readily adopting solar, wind, and other renewable sources of energy, but installing and maintaining this energy system requires high investment and technical expertise. Cloud-based service models, which also include the EaaS model, directly mitigate such investments as well as the operation and maintenance requirements, thus encouraging customers to contribute to energy generation through pay-per-use or performance-based models. Under this model, energy service companies (ESCOs) finance the energy generation equipment, such as wind turbines or solar panels; undertake the installation; and operate the system, and the customer consumes energy without having to pay for the system itself. The customer only pays for either the energy consumption or the resulting savings. This is enabling customers to invest in renewables in large numbers while moving towards a cleaner future and simultaneously empowering the EaaS industry. Additionally, EaaS providers enable renewables as well as other cutting-edge technology such as large-scale energy storage, load management and tracking platforms, smart metering, etc., as part of their service, thereby creating a robust energy supply, irrespective of the unpredictable nature of renewables. Public announcements and investments in renewables are another key growth enhancer for the EaaS market. Governments around the world are introducing policies for subsidies, incentives, and mandates for renewable energy adoption; public and private institutions continue to set investment records in solar infrastructure and microgrid build-out; and energy storage remains a top priority in the creation of a resilient and affordable renewable energy universe. The combination of these strategies to improve the economics of renewables continues to promote increased renewable adoption, furthering the value proposition that EaaS offers.
What are the Major Advances Changing the Energy As a Service Market Today?
- Growth of Distributed Energy Resources (DERs): The growth of Distributed Energy Resources (DERs) is arguably one of the most impactful technological and structural changes transforming the Energy-as-a-Service (EaaS) market today. DERs are small, distributed energy production assets that are located near the point of consumption, such as solar rooftop arrays, wind turbines, battery storage units, and microgrid networks of distributed generation and storage. Displacing traditional central power plants and transmission infrastructure, DERs introduce a revolutionized approach to how power is generated, delivered, and consumed. The mid-20th-century centralized electric grid paradigm is being transitioned toward new, more flexible decentralized models that leverage proliferating DERs. Increasing of consumers’ reliability, cost and sustainability requirements from the side of houses, commercial business and institutions is the main driving factor in the transition to the more and more decentralized energy system. Consumers implement DER generation sources like household renewables which will enhance resilience, reduce costs and complications of bulk power transmission and confirm persistent emission reductions. However, such distributed energy approaches require specialized technical proficiency, rapid response adaptation, and real-time control, making EaaS models an attractive option for those wishing to comprehensively deploy, operate, and optimize clusters of decentralized systems. Moreover, the enabling hardware and software developed across the range of digital technologies, such as the Internet of Things (IoT) and machine learning, further amplifies the utility and adoption of DERs. Digitally enabled DERs allow for sophisticated, feedback loop–driven energy management, demand response participation, and transaction-level market access, all of which outperform traditional energy system approaches in terms of speed, precision, and adaptability. Increasing global investment volumes from public and private sources are further fast-tracking DER proliferation.
- Blockchain and Energy Trading Platforms: Blockchain and energy trading platforms are emerging as a revolutionary development in the energy services market by providing a decentralized, transparent, and cost-effective solution for energy exchanges. Typically, the flow of energy is top-down with enormous utilities controlling the production of power, distribution and billing activities. Blockchain offers a secure and unchangeable way to record energy transactions without needing to invest in new infrastructure, making the process of trading energy simpler. For EaaS, blockchain facilitates peer-to-peer energy trading. Energy consumers like households, office buildings, and even utility-type aggregators of consumer energy like rooftop solar installations sell excess energy directly to curious end-users nearby. This allows a far more flexible and local energy marketplace where traders like these can both hedge their energy costs and capitalize on their acquired DERs. Smart contracts, automated agreements built directly into the blockchain, do the work of catering to the minutiae of each energy transaction on call, allowing end users to compose on-demand energy transactions that are billed accurately and settled in real time, saving additional overhead costs to EaaS providers. Additionally, blockchain builds transparency and security into energy transactions, helping end users track their purchased energy creation in a verifiable manner—a must-have for tracking renewable energy credits (RECs) and achieving corporate and government sustainability mandates. EaaS creators can combine energy provision, trading, and optimization services into a single cloud-based platform and encourage the development of private and public capital investments in blockchain-powered energy transacting. Materials like mobile devices, sensors, and smart metering have already overtaken the real world, making blockchain systems more assimilable and opening the doors for future decentralized energy markets for years to come.
Category Wise Insights
By Service Type
Why Demand Services Hold a Prominent Position in the Market?
The demand services segment dominated the industry in 2025 of over 40%. The expected growth was related to increasing energy prices and the need for a dependable energy supply, with particular reference to remote, off-grid locations. In addition, the weak electricity grid requires more robust energy services to suit energy consumers’ needs. Moreover, demand response management is becoming a feasible solution for efficiently operating appliances to achieve cost savings and improve grid reliability by distributing power during peak and off-peak periods; thus, it is essential for integrating demand services.
The energy optimization services are growing at a high CAGR of 12.5% during the forecast period. The surge in government initiatives for energy efficiency and renewable energy support drives the growth. These services enable the organizations to deploy energy-saving measures that are cost-effective and do not involve initial capital investment. In addition, it is the emphasis on sustainable development and cost containment that are the pivotal factors leading to the growth of this segment. As the companies understand that sustainable development and astute energy management can grow their profit margins, the energy-as-a-service industry market is expected to grow expeditiously.
By End Use
Why Commercial End Use Capture the Highest Market Share in the Energy As a Service Market?
The commercial segment captures the largest market share in 2025 of over 50%. This growth is due mainly to a rising priority on sustainability and cost-effectiveness. Companies look for a holistic energy approach. It will be able to balance their operational expenses and avoid investment and the inconveniences of an expansive Energy infrastructure. Moreover, with the deployment of intelligent systems, including the Internet of things or sophisticated analytics, the application of EaaS is promoted. Lastly, government regulations and programs support organizations converting to renewable energy sources by providing financial incentives, technical assistance, and guidelines that facilitate the transition to sustainable energy practices.
The industrial segment is growing at the highest rate over the projected period. The need for secure, cost-effective energy sources against rising operational costs drives this growth. More companies are introducing energy management systems to better control and manage consumption and limit waste. The drive towards electrification of processes, from transport to manufacturing, and the highly motivated regulatory environment via incentives, which combat greenhouse gas emissions, are further motivating companies to switch to EaaS.
Report Scope
| Feature of the Report | Details |
| Market Size in 2026 | USD 87.2 billion |
| Projected Market Size in 2035 | USD 253.5 billion |
| Market Size in 2025 | USD 77.4 billion |
| CAGR Growth Rate | 12.6% CAGR |
| Base Year | 2025 |
| Forecast Period | 2026-2035 |
| Key Segment | By Service Type, End Use and Region |
| Report Coverage | Revenue Estimation and Forecast, Company Profile, Competitive Landscape, Growth Factors and Recent Trends |
| Regional Scope | North America, Europe, Asia Pacific, Middle East & Africa, and South & Central America |
| Buying Options | Request tailored purchasing options to fulfil your requirements for research. |
Regional Analysis
How Big is North America Energy As a Service Market Size?
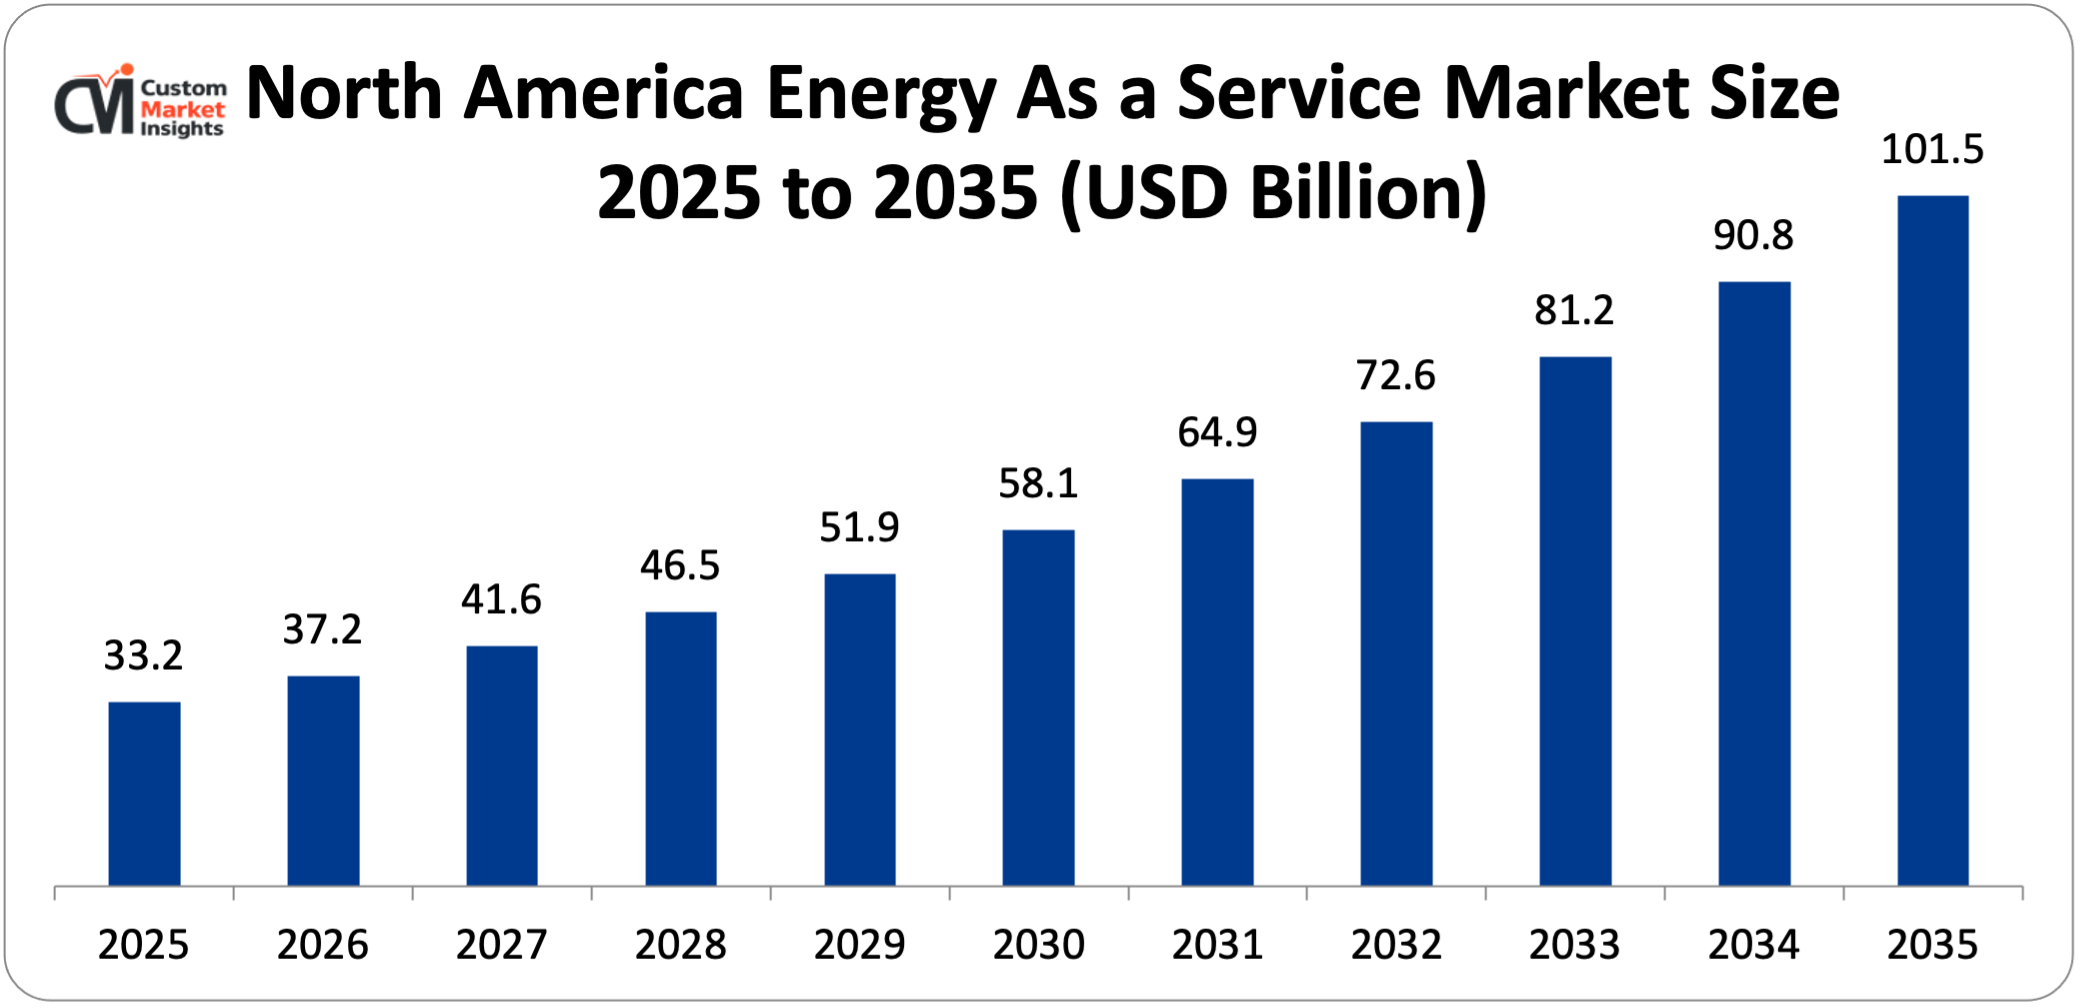
Its market size, in terms of North America Energy As a Service, is projected to be USD 33.2 billion in 2025 with a growth of about USD 101.5 billion in 2035 with a CAGR of 11.8% between 2026 and 2035.
Why did North America Dominate the Energy As a Service Market in 2025?
In 2025, North America will dominate the global market with an estimated market share of 43 This growth can be explained due to a rise in the investments made in renewable energy and a transition to sustainable practices. The North American region also has a dedicated effort towards decarbonization, with numerous government policies that support the reduction in carbon emissions which in turn promotes energy saving measures. The widespread use of newer technologies like smart grids and data analytics in energy management and the need for organizations to control operational costs and have sustainable practices have led to the high demand of EaaS in North America.
US Energy As a Service Market Trends
In the North American region, the US leads the industry expansion over the projected period. Growth is also attributed to improving environmental policies and renewing portfolio standards. As demand for cleaner and greener energy sources and greenhouse gas reduction standards increases, consumers and utilities are seeking more cost-effective ways to power their facilities. The incentives and enhanced tax credits available for renewable projects are also fueling a demand for Renewable Energy as a Service offering, as news of rising natural disasters across the globe reinforces the need for secure energy systems.
Why is Europe Experiencing Significant Growth in the Energy As a Service Market?
Europe holds a significant market share in 2025. The growth can be attributed to the evolving energy and environmental policies across Europe, primarily through sophisticated and comprehensive regulatory incentives. Substantial investments are being made by various nations, especially Germany, toward the development and adoption of renewable energy technologies. Other factors include the high cost of power transmission, the rising popularity of alternatives such as solar and wind energy, and the emphasis on reducing greenhouse gases.
Germany Energy As a Service Market Trends
Germany held the dominant position in the market in 2025. The expansion of the energy-as-a-service market in Germany can be largely attributed to established government policies towards renewable energy sources. The nation‘s strenuous efforts to achieve high penetration of renewables in its energy portfolio are incentivizing businesses to embrace EaaS business models for optimal management of the energy consumed by them. Investments to upgrade existing infrastructure and develop cutting-edge technology for better management will further assist the growth of the EaaS market, particularly by enabling more efficient energy consumption and integration of renewable sources into the energy grid.
Why is the Asia Pacific Growing at the Highest CAGR in the Energy As a Service Market?
The Asia Pacific is expected to grow at the highest CAGR of 16.8% over the projected period. This growth is driven by nations like China and India, who are upgrading their energy infrastructure. The situation is further aided by investments made into integrating renewable energy and smart grid technology. The commercial sector is also moving more towards EaaS to maximize efficiency and cut down on operational costs.
China Energy As a Service Market Trends
China holds the prominent market share in the industry. The main growth determinants are government regulations that promote cleaner energy sources and increased efficiency. Moreover, the global renewable energy figures, with their targets of having higher percentages of green energy, and the investment of companies in optimizing their energy spent through EaaS business models will demand increasing cost-saving conditions. Besides, investments in smart grid characteristics are also highly increasing the operating efficiency of an economy by enabling better energy distribution, reducing waste, and integrating renewable energy sources more effectively.
Why is the Middle East & Africa Region is growing rapidly in Energy As a Service?
The MEA region is growing at a steady rate over the projected period. The revenue increase is mainly supported by the rapid growth of electricity demand in this region. Such expansion is driven by the transition of developing countries, further urbanization and population growth, and the growing demand of energy-intensive industries that burden the current grid infrastructure (e.g., cooling and desalination, among others). Governments and companies are more and more adopting the EaaS (Energy as a Service) model in order to benefit from cheaper and flexible energy without the big up-front heavy investments that characterize the usual sources. In addition, energy efficiency and carbon mitigation targets are also fueling service-based models to optimize energy use.
Saudi Arabia Energy As a Service Market Trends
Saudi Arabia is growing at the highest CAGR during the forecast period. The increasing investment by the key market players is expected to drive the industry growth. For instance, in March 2025, Siemens Energy has received a US$1.6 billion order with Harbin Electric International as the EPC contractor to supply vital technologies for the Rumah 2 (Fujian Province) and Nairyah 2 power stations in Saudi Arabia. The two gas-fired power stations located in the western and central regions of Saudi Arabia will generate 3.6 gigawatts and have enough capacity to meet the needs of approximately 1.5 million households. Under this order, the company will undertake long-term maintenance of the stations for 25 years.
Top Players in the Energy As a Service Market and Their Offerings
- Johnson Controls
- Honeywell International Inc.
- Engie
- Siemens
- Veolia
- EDF
- Schneider Electric
- Bernhard
- General Electric
- Entegrity
- Wendel
- Ørsted A/S
- NORESCO LLC
- Centrica plc
- Enel SpA
- Others
Key Developments
Energy As a Service market has experienced considerable changes in the last two years as the market players are trying to diversify their technological aspects and develop product portfolios using strategic approaches.
- In August 2025, Elli is taking its Energy business unit to the next level by now offering energy trading as a service to external customers. Renewable electricity supply helps businesses optimize energy costs and strengthen independence from fossil fuels – Elli delivers the services to make that happen. Elli has been structuring the electricity procurement for a major industrial customer from renewable sources for their production needs since January, taking advantage of Elli’s access to the EPEX SPOT market. The aim is to compensate for fluctuations in the production of wind and solar power through targeted purchases and sales. Elli had already acquired its trading license on Europe’s largest electricity trading exchange in 2023 and has since undergone an intensive test phase. With the step from proprietary trading to energy services, Elli is now taking its energy business to the next level. (https://www.elli.eco/en/about-elli/news/newsroom/elli-launches-energy-trading-as-a-service-empowering-companies-with-green-energy#:~:text=26.08.2025-,Elli%20Launches%20Energy%20Trading%20as%20a%20Service%20%2D%20Empowering%20companies%20with,a%20service%20to%20external%20customers)
- In May 2025, ABB announced the launch of its new Battery Energy Storage Systems-as-a-Service (BESS-as-a-Service) – a flexible, zero-CapEx solution designed to accelerate the shift to clean, resilient and affordable energy. BESS-as-a-Service is the first in a range of next generation service models being developed to remove the barriers to clean technology adoption and accelerate industries’ transition to net zero. (https://new.abb.com/news/detail/126105/abb-introduces-battery-energy-storage-systems-as-a-service-to-simplify-renewable-energy-adoption)
These strategic measures have enabled the companies to reinforce their competitive positions, increase the product line, boost their technological competencies, and also seize growth opportunities in the fast-growing energy as a service market.
The Energy As a Service Market is segmented as follows:
By Service Type
- Supply Services
- Energy Optimization Services
- Demand Services
By End Use
- Commercial
- Industrial
Regional Coverage:
North America
- U.S.
- Canada
- Mexico
- Rest of North America
Europe
- Germany
- France
- U.K.
- Russia
- Italy
- Spain
- Netherlands
- Rest of Europe
Asia Pacific
- China
- Japan
- India
- New Zealand
- Australia
- South Korea
- Taiwan
- Rest of Asia Pacific
The Middle East & Africa
- Saudi Arabia
- UAE
- Egypt
- Kuwait
- South Africa
- Rest of the Middle East & Africa
Latin America
- Brazil
- Argentina
- Rest of Latin America
Table of Contents
- Chapter 1. Report Introduction
- 1.1. Report Description
- 1.1.1. Purpose of the Report
- 1.1.2. USP & Key Offerings
- 1.2. Key Benefits For Stakeholders
- 1.3. Target Audience
- 1.4. Report Scope
- 1.1. Report Description
- Chapter 2. Market Overview
- 2.1. Report Scope (Segments And Key Players)
- 2.1.1. Energy As a Service by Segments
- 2.1.2. Energy As a Service by Region
- 2.2. Executive Summary
- 2.2.1. Market Size & Forecast
- 2.2.2. Energy As a Service Market Attractiveness Analysis, By Service Type
- 2.2.3. Energy As a Service Market Attractiveness Analysis, By End Use
- 2.1. Report Scope (Segments And Key Players)
- Chapter 3. Market Dynamics (DRO)
- 3.1. Market Drivers
- 3.1.1. Growing Demand for Resilient Energy Infrastructure
- 3.1.2. Increasing Adoption of Renewable Energy
- 3.2. Market Restraints
- 3.3. Market Opportunities
- 3.5. Pestle Analysis
- 3.6. Porter Forces Analysis
- 3.7. Technology Roadmap
- 3.8. Value Chain Analysis
- 3.9. Government Policy Impact Analysis
- 3.10. Pricing Analysis
- 3.1. Market Drivers
- Chapter 4. Energy As a Service Market – By Service Type
- 4.1. Service Type Market Overview, By Service Type Segment
- 4.1.1. Energy As a Service Market Revenue Share, By Service Type, 2025 & 2035
- 4.1.2. Supply Services
- 4.1.3. Energy As a Service Share Forecast, By Region (USD Billion)
- 4.1.4. Comparative Revenue Analysis, By Country, 2025 & 2035
- 4.1.5. Key Market Trends, Growth Factors, & Opportunities
- 4.1.6. Energy Optimization Services
- 4.1.7. Energy As a Service Share Forecast, By Region (USD Billion)
- 4.1.8. Comparative Revenue Analysis, By Country, 2025 & 2035
- 4.1.9. Key Market Trends, Growth Factors, & Opportunities
- 4.1.10. Demand Services
- 4.1.11. Energy As a Service Share Forecast, By Region (USD Billion)
- 4.1.12. Comparative Revenue Analysis, By Country, 2025 & 2035
- 4.1.13. Key Market Trends, Growth Factors, & Opportunities
- 4.1. Service Type Market Overview, By Service Type Segment
- Chapter 5. Energy As a Service Market – By End Use
- 5.1. End Use Market Overview, By End Use Segment
- 5.1.1. Energy As a Service Market Revenue Share, By End Use, 2025 & 2035
- 5.1.2. Commercial
- 5.1.3. Energy As a Service Share Forecast, By Region (USD Billion)
- 5.1.4. Comparative Revenue Analysis, By Country, 2025 & 2035
- 5.1.5. Key Market Trends, Growth Factors, & Opportunities
- 5.1.6. Industrial
- 5.1.7. Energy As a Service Share Forecast, By Region (USD Billion)
- 5.1.8. Comparative Revenue Analysis, By Country, 2025 & 2035
- 5.1.9. Key Market Trends, Growth Factors, & Opportunities
- 5.1. End Use Market Overview, By End Use Segment
- Chapter 6. Energy As a Service Market – Regional Analysis
- 6.1. Energy As a Service Market Overview, By Region Segment
- 6.1.1. Global Energy As a Service Market Revenue Share, By Region, 2025 & 2035
- 6.1.2. Global Energy As a Service Market Revenue, By Region, 2026 – 2035 (USD Billion)
- 6.1.3. Global Energy As a Service Market Revenue, By Service Type, 2026 – 2035
- 6.1.4. Global Energy As a Service Market Revenue, By End Use, 2026 – 2035
- 6.2. North America
- 6.2.1. North America Energy As a Service Market Revenue, By Country, 2026 – 2035 (USD Billion)
- 6.2.2. North America Energy As a Service Market Revenue, By Service Type, 2026 – 2035
- 6.2.3. North America Energy As a Service Market Revenue, By End Use, 2026 – 2035
- 6.2.4. U.S. Energy As a Service Market Revenue, 2026 – 2035 (USD Billion)
- 6.2.5. Canada Energy As a Service Market Revenue, 2026 – 2035 (USD Billion)
- 6.2.6. Mexico Energy As a Service Market Revenue, 2026 – 2035 (USD Billion)
- 6.2.7. Rest of North America Energy As a Service Market Revenue, 2026 – 2035 (USD Billion)
- 6.3. Europe
- 6.3.1. Europe Energy As a Service Market Revenue, By Country, 2026 – 2035 (USD Billion)
- 6.3.2. Europe Energy As a Service Market Revenue, By Service Type, 2026 – 2035
- 6.3.3. Europe Energy As a Service Market Revenue, By End Use, 2026 – 2035
- 6.3.4. Germany Energy As a Service Market Revenue, 2026 – 2035 (USD Billion)
- 6.3.5. France Energy As a Service Market Revenue, 2026 – 2035 (USD Billion)
- 6.3.6. U.K. Energy As a Service Market Revenue, 2026 – 2035 (USD Billion)
- 6.3.7. Russia Energy As a Service Market Revenue, 2026 – 2035 (USD Billion)
- 6.3.8. Italy Energy As a Service Market Revenue, 2026 – 2035 (USD Billion)
- 6.3.9. Spain Energy As a Service Market Revenue, 2026 – 2035 (USD Billion)
- 6.3.10. Netherlands Energy As a Service Market Revenue, 2026 – 2035 (USD Billion)
- 6.3.11. Rest of Europe Energy As a Service Market Revenue, 2026 – 2035 (USD Billion)
- 6.4. Asia Pacific
- 6.4.1. Asia Pacific Energy As a Service Market Revenue, By Country, 2026 – 2035 (USD Billion)
- 6.4.2. Asia Pacific Energy As a Service Market Revenue, By Service Type, 2026 – 2035
- 6.4.3. Asia Pacific Energy As a Service Market Revenue, By End Use, 2026 – 2035
- 6.4.4. China Energy As a Service Market Revenue, 2026 – 2035 (USD Billion)
- 6.4.5. Japan Energy As a Service Market Revenue, 2026 – 2035 (USD Billion)
- 6.4.6. India Energy As a Service Market Revenue, 2026 – 2035 (USD Billion)
- 6.4.7. New Zealand Energy As a Service Market Revenue, 2026 – 2035 (USD Billion)
- 6.4.8. Australia Energy As a Service Market Revenue, 2026 – 2035 (USD Billion)
- 6.4.9. South Korea Energy As a Service Market Revenue, 2026 – 2035 (USD Billion)
- 6.4.10. Taiwan Energy As a Service Market Revenue, 2026 – 2035 (USD Billion)
- 6.4.11. Rest of Asia Pacific Energy As a Service Market Revenue, 2026 – 2035 (USD Billion)
- 6.5. The Middle-East and Africa
- 6.5.1. The Middle-East and Africa Energy As a Service Market Revenue, By Country, 2026 – 2035 (USD Billion)
- 6.5.2. The Middle-East and Africa Energy As a Service Market Revenue, By Service Type, 2026 – 2035
- 6.5.3. The Middle-East and Africa Energy As a Service Market Revenue, By End Use, 2026 – 2035
- 6.5.4. Saudi Arabia Energy As a Service Market Revenue, 2026 – 2035 (USD Billion)
- 6.5.5. UAE Energy As a Service Market Revenue, 2026 – 2035 (USD Billion)
- 6.5.6. Egypt Energy As a Service Market Revenue, 2026 – 2035 (USD Billion)
- 6.5.7. Kuwait Energy As a Service Market Revenue, 2026 – 2035 (USD Billion)
- 6.5.8. South Africa Energy As a Service Market Revenue, 2026 – 2035 (USD Billion)
- 6.5.9. Rest of the Middle East & Africa Energy As a Service Market Revenue, 2026 – 2035 (USD Billion)
- 6.6. Latin America
- 6.6.1. Latin America Energy As a Service Market Revenue, By Country, 2026 – 2035 (USD Billion)
- 6.6.2. Latin America Energy As a Service Market Revenue, By Service Type, 2026 – 2035
- 6.6.3. Latin America Energy As a Service Market Revenue, By End Use, 2026 – 2035
- 6.6.4. Brazil Energy As a Service Market Revenue, 2026 – 2035 (USD Billion)
- 6.6.5. Argentina Energy As a Service Market Revenue, 2026 – 2035 (USD Billion)
- 6.6.6. Rest of Latin America Energy As a Service Market Revenue, 2026 – 2035 (USD Billion)
- 6.1. Energy As a Service Market Overview, By Region Segment
- Chapter 7. Competitive Landscape
- 7.1. Company Market Share Analysis – 2025
- 7.1.1. Global Energy As a Service Market: Company Market Share, 2025
- 7.2. Global Energy As a Service Market Company Market Share, 2024
- 7.1. Company Market Share Analysis – 2025
- Chapter 8. Company Profiles
- 8.1. Johnson Controls
- 8.1.1. Company Overview
- 8.1.2. Key Executives
- 8.1.3. Product Portfolio
- 8.1.4. Financial Overview
- 8.1.5. Operating Business Segments
- 8.1.6. Business Performance
- 8.1.7. Recent Developments
- 8.2. Honeywell International Inc.
- 8.3. Engie
- 8.4. Siemens
- 8.5. Veolia
- 8.6. EDF
- 8.7. Schneider Electric
- 8.8. Bernhard
- 8.9. General Electric
- 8.10. Entegrity
- 8.11. Wendel
- 8.12. Ørsted A/S
- 8.13. NORESCO LLC
- 8.14. Centrica plc
- 8.15. Enel SpA
- 8.16. Others.
- 8.1. Johnson Controls
- Chapter 9. Research Methodology
- 9.1. Research Methodology
- 9.2. Secondary Research
- 9.3. Primary Research
- 9.3.1. Analyst Tools and Models
- 9.4. Research Limitations
- 9.5. Assumptions
- 9.6. Insights From Primary Respondents
- 9.7. Why Healthcare Foresights
- Chapter 10. Standard Report Commercials & Add-Ons
- 10.1. Customization Options
- 10.2. Subscription Module For Market Research Reports
- 10.3. Client Testimonials
- Chapter 11. List Of Figures
- 11.1. Figures No 1 to 19
- Chapter 12. List Of Tables
- 12.1. Tables No 1 to 41
Prominent Player
- Johnson Controls
- Honeywell International Inc.
- Engie
- Siemens
- Veolia
- EDF
- Schneider Electric
- Bernhard
- General Electric
- Entegrity
- Wendel
- Ørsted A/S
- NORESCO LLC
- Centrica plc
- Enel SpA
- Others
FAQs
The key players in the market are Johnson Controls, Honeywell International Inc., Engie, Siemens, Veolia, EDF, Schneider Electric, Bernhard, General Electric, Entegrity, Wendel, Ørsted A/S, NORESCO LLC, Centrica plc, Enel SpA, Others.
Regulations are a key enabler of the EaaS market. As various levels of Governments establish incentives for the use of cleaner sources and more efficient use of sources (e.g., renewable energy targets, carbon reduction commitments, and Energy efficiency standards), organizations will seek the adoption of EaaS to meet this regulation. Furthermore, financial incentives (tax rebates and subsidies) can decrease the costs of deploying renewable and energy-efficient technology to speed up the adoption of service-based models.
The price point is influential towards the development and acceptance of the EaaS market primarily through the reduction of costs and improved accessibility to end users. The EaaS business model has a distinct advantage over traditional energy infrastructure models because it does not require capital expenditure. The price point for EaaS is considerably lower than the average required capital expenditure, as it enables the user to operate them on a subscription and utilization basis, which turns capital investments into operational ones. This makes Energy-as-a-Service affordable for many industries and companies to implement innovative energy solutions such as renewable, storage, and intelligent energy control.
According to the present analysis and forecast modeling, the market of energy as a service will witness a significant growth of about USD 253.5 billion in the year 2035 with the growing innovative product launches, increasing collaboration, rising government initiatives, and integration of renewable energy with a CAGR of 12.6% between the years 2026 and 2035.
It is projected that North America will hold the largest market share in the energy-as-a-service market in the forecast period, with a share of about 43% of the global market share, which is attributed to the region’s presence of major players and increasing focus towards sustainability.
The Asia Pacific is expected to grow at the highest CAGR of 16.8% during the forecast period. The growth in the region is owing to the favorable government initiatives and integration of renewable energy.
The expansion of the EaaS market has been propelled by several forces, such as the increasing need for cost savings that leads corporations away from capital-intensive energy ownership to a more flexible service-based one; the rising focus on energy efficiency to lower operational costs; and robust targets in decarbonization and sustainability.