Adeno Associated Virus Vector Manufacturing Market Size, Trends and Insights By Vector Type (AAV2, AAV5, AAV8, AAV9, Novel Engineered Serotypes, Others), By Application (Gene Therapy, Vaccine Development, Research Applications, Others), By Disease Indication (Oncology, Neurology, Ophthalmology, Hematology, Metabolic Disorders, Others), By Production Method (Transient Transfection, Stable Cell Line, Baculovirus System, Herpes Simplex Virus System, Others), By End User (Pharmaceutical & Biotechnology Companies, Contract Development & Manufacturing Organizations, Academic & Research Institutes, Others), and By Region - Global Industry Overview, Statistical Data, Competitive Analysis, Share, Outlook, and Forecast 2026 – 2035
Report Snapshot
| Study Period: | 2026-2035 |
| Fastest Growing Market: | Asia Pacific |
| Largest Market: | North America |
Major Players
- Thermo Fisher Scientific Inc.
- Catalent Inc.
- WuXi AppTec
- Oxford Biomedica plc
- Others
Reports Description
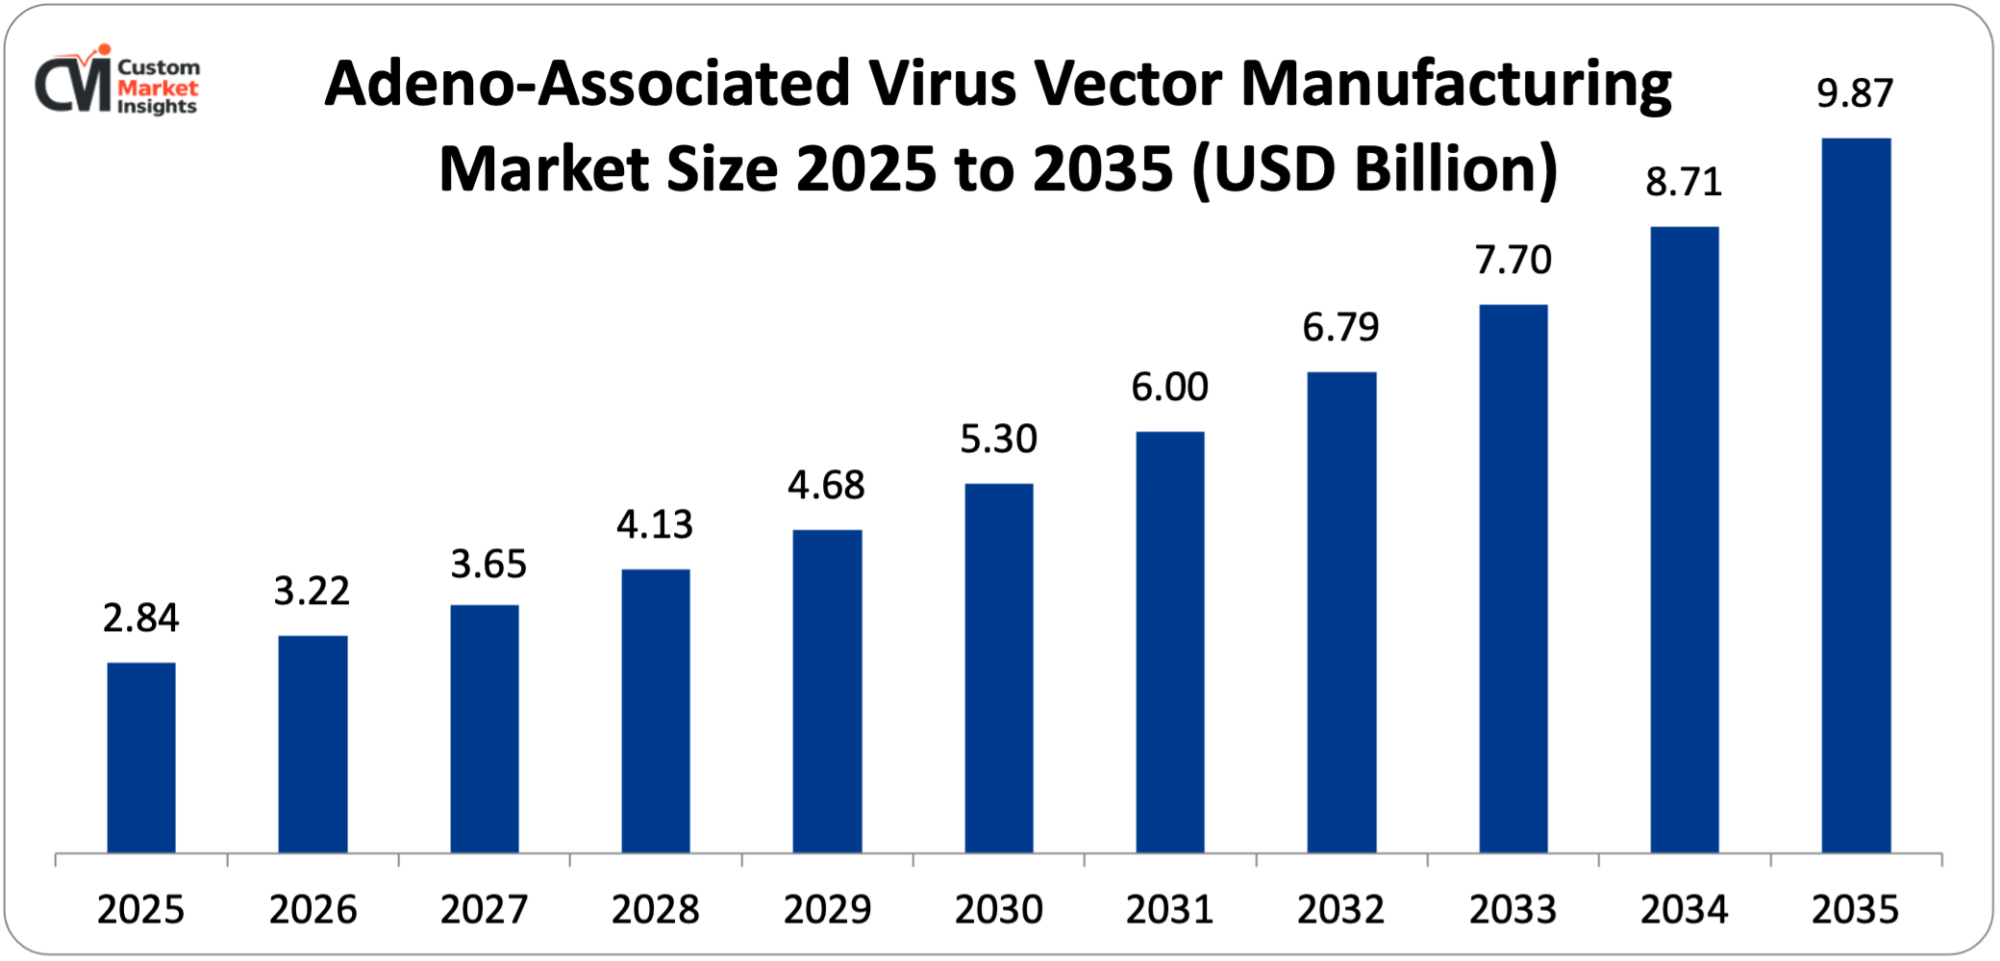
It is estimated that the market size of the global market in adeno-associated virus vector manufacturing will be USD 2.84 billion in 2025, and will increase to USD 3.22 billion in 2026, and approximately USD 9.87 billion in 2035 with a yearly CAGR of 13.4% between 2026 and 2035. The market is expanding due to a rise in the number of gene therapy trial programs and FDA approvals, the rise of the prevalence of genetic and rare ailments needing new medical treatments, advancements in technology in large-scale production and purification of AAV, rising investment in gene therapy discovery and development, and the demand for contract manufacturing services.
Market Highlight
- North America dominated the market for AAV vector manufacturing with a market share of 48% in the year 2025.
- Asia Pacific is going to expand by 16.8% between 2026 and 2035.
- By the 2025 market share by the type of vectors, the AAV2 serotype segment had captured 32% of the market.
- Gene therapy segment will have the greatest CAGR of 14.6% in the period between 2026 and 2035 by application.
- In terms of disease indication, the neurology segment is expected to record the best CAGR of 15.2% in the span of time of the projection, 2026-35.
- Pharmaceutical and biotechnology companies by end user assumed 54% of market share in 2025.
- AAV Therapies – Various AAV therapies have been approved by the FDA, and more than 280 programs with AAV backbones are in clinical development across the world today.
Significant Growth Factors
- Accelerating Gene Therapy Approvals and Clinical Pipeline Expansion: The rapid increase in the development and regulatory approval of gene therapies has already produced unprecedented demand on AAV vector production and technologies. As of 2024, 12 AAV-based gene therapies have been approved by the FDA, such as Luxturna, which is used to treat inherited retinal disease, Zolgensma, which is used to treat spinal muscular atrophy and Hemogenix which uses hemophilia B, which has led to an investment in the field. As of 2024, more than 1,200 cell and gene therapy clinical trials were ongoing worldwide, with participants in the AAV-based programs constituting 280 clinical trials (23% of the entire pipeline), according to the Alliance for Regenerative Medicine. In the studies by the American Society of Gene and Cell Therapy, there was a 185% rise in gene therapy trials developing in 2016-2024, the AAV vectors were used in 68% of programs with the desirable safety measure and widespread tissue tropism alongside extended transgene outcome. The FDA has already assigned 78 AAV programs to its Regenerative Medicine Advanced Therapy label, which grants Regulatory assistance with faster track follow-up evaluation. Market analysts forecasted 15-20 more approvals of AAV genes therapies through 2030 with the potential to develop into more driveable good health conditions in millions of cases including Parkinson’s and Alzheimer disease, heart failure and others around the world. To serve every approved treatment, the therapy will need commercial-scale production of 1,000-5,000 doses of the treatment annually in the first year, increasing to 10,000-50,000 doses as the market penetration increases and the treatment indications are expanded. The commercial production need of Zolgensma alone, at a cost of 2.1 million per treatment would require a production capacity of 500-800 patients in the United States annually, which, at therapeutic doses of 2-3 x 10¹⁴ vg/kg, would require 1.5-2.4 x 10¹⁵ vector genomes annually.
- Rising Prevalence of Genetic and Rare Diseases: The diagnostics and awareness of genetic diseases are on the rise, creating a strong market need due to its unique ability of the AAV gene treatments to treat the underlying genetic defect rather than only controlling the symptoms. The National Organization for Rare Disorders estimates that there are 300 million victims of rare diseases worldwide and 80% of these diseases are genetic and half are experienced during childhood. There are about 7,000 known rare diseases, of which one out of five is approved in the form of FDA treatment and this presents massive unmet medical demand and commercial potential of gene therapy. There is 1 in 10,000 live births of spinal muscular atrophy, and when untreated, Type 1 SMA leads to death or permanent ventilation before the age of 2, which makes the one-time curative treatment offered by Zolgensma a breakthrough at the cost of 2.1 million dollars. Duchenne muscular dystrophy is a disease with an incidence of 1 per 3500-5000 male births, and 20000 new cases are diagnosed each year, and several AAV programs are in Phase 2/3 clinical trials to replace the dystrophin gene. Hemophilia A and B have an estimated worldwide prevalence of 400,000, and AAV-based gene therapy has proven to produce sustained levels of factor eliminating or significantly diminishing bleeding events and factor replacement therapy would cost the patient between USD 300,000-700,000/year. The prevalence of inherited retinal diseases is 1 in 2,000 and Luxturna being approved to treat RPE65-mediated retinal dystrophy opens the way to 15+ more AAV programs to treat blindness caused by different genetic mutations. Rarely occurring genetic diseases impose a cost burden of over 400 billion US dollars each year in the United States alone when the cost of medical care and lost productivity are considered, and gene therapies have the potential to be cost-effective due to the high initial price when it comes to getting rid of lifetime symptomatic treatment.
- Technological Advancements in Manufacturing and Purification: History AAV production has been improved radically by novel production platforms, scalable bioreactor technologies, and downstream purification technologies of AAVs to overcome past bottlenecks in production and allow production of AAVs on a commercial scale to meet increasing demand. Non-particle-based plasmid transfection techniques in adherent cell culture were effective in producing enough plasmid vectors to research scales, which could be 1012-1013 vg/batch, but were not sufficient to achieve all commercial manufacturing goals of 1016-1017 vg/batch. Suspension-adapted HEK293 cells allow growth to greater than 10 x 106 cells/mL in stirred-tank bioreactors, transfection efficiencies of up to 70-85%, and yields of up to 5-15 x 104 vg /cell (10-fold better than adherent systems). Baculovirus expression systems based on insect cells, either Sf9 or High Five cells, offer alternative production systems with a yield of 10^4-105 vg/cell and the simplified purification by the lack of helper virus contamination. Batch-to-batch transfection variability is eliminated by developing stable producer cell lines through various methods, such as CRISPR-mediated site-specific integration, allowing stable large-scale production, although genetic drift and declining productivity over passages are still problematic. New technologies such as downstream purification such as affinity chromatography with AAV-specific antibodies or designed peptides, ion exchange chromatography optimized to separate capsids, and ultracentrifugation with iodixanol gradients have enhanced full -emptycapsid ratios against 30-50%, which is essential to optimizing therapeutic use and reducing immunity to viruses. The improvements of the analytical methods such as droplet digital PCR to determine the genome titer concentration accurately, transmission electron microscopy to measure the capsid structure and mass spectrometry to identify the post-translational modifications ensure the consistency of the product and regulatory compliance.
- Expanding CDMO Capacity and Strategic Partnerships: The growth in the rate of contract development and manufacturing companies focused on AAV production coupled with strategic alliances between the developers of gene therapy and manufacturing support agencies has led to increased progress in programs and spread infrastructure investment. In 2024, the global market of gene therapy CDMO is 3.8 billion USD, and AAV-based services constitute 58% of it as such companies as Catalent, WuXi AppTec, Oxford Biomedica, and FUJIFILM Diosynth open separate AAV production plants. In the 2020-2024 period, Catalent invested up to USD 450 million in AAV manufacturing infrastructure capacity of 50+ programs, both at the clinical and commercial scale, at the facilities in Maryland and Wisconsin. Oxford Biomedica has 750,000 square feet of GMP manufacturing capacity in the UK with 80+ AAV programs capacity at any time and has clients such as Novartis, Biogen, and Sarepta Therapeutics. The transformation of the industry to platform technologies and uniform procedures will allow CDMOs to offer the services to a wide range of clients at a reduced cost of production of per dose of a product of 500,000-1,000,000 USD at the early clinical stage to 50,000-150,000 at larger volumes. Strategic alliances give the developers of gene therapy access to specialized expertise, approved manufacturing platforms, and regulatory exposure without the capital-intensive facility development costs which require investments of up to USD 150-300 million and a time frame of 3-5 years. Three-quarters of the developers of gene therapies are small and mid-sized biotechnology firms that lack the internal capacity to manufacture their programs, and so, CDMO alliances are necessary to enable the progression of their programs to preclinical and commercialization.
What are the Major Advances Changing the AAV Vector Manufacturing Market Today
- Next-Generation AAV Capsid Engineering and Novel Serotypes: The recent techniques of capsid engineering have produced new synthetic AAV serotypes with higher tissue tropism, increased transduction efficiency and lower immunogenicity than natural serotypes, increasing therapeutic use and enhancing manufacturing performance. It has been applied in directed evolution to subject libraries of AAV capsids consisting of 107-109 variants of AAV capsid to repeated selection by target tissues, including neurons, cardiomyocytes, and hepatocytes. Rational design approaches are based on computational modeling and structural biology to alter the surface residues of the capsid, changing their receptor binding specificities, avoiding neutralizing antibodies targeting 40-60% of human populations against typical serotypes, and improving intracellular trafficking. AAV-PHP.eB, a directed evolutionary AAV showing central nervous system delivery but 40-fold greater brain transduction than AAV9 with intravenous injection in preclinical models, has the potential to deliver neurotransduction into the brain noninvasively in a systemic manner to treat neurological diseases previously incurable except by invasive intrathecal or intraparenchymal injection. Computational design of the ancient AAV capsid, Anc80, has a lower pre-existing immunity with neutralizing antibodies being detected in 15% of human serum as compared to 40-67% with AAV2, AAV8 and AAV9, and increases the number of patients who can be treated. The use of engineered capsids shows novel manufacturing benefits because they show better yields in production systems, and some of them produce vectors genome per cell up to 2-5-fold better than wild-type serotypes, directly reducing the cost of manufacturing and timelines. Capsid modification to proteasomal degradation resistance enhances the proportion of infectious particles delivered to the nucleus and leads to higher treatment efficacy and may halve or quarter the amount of required dosage in practice, saving manufacturing costs of USD 25,000-100,000 per patient at commercial scale.
- Scalable Suspension Cell Culture and Continuous Manufacturing: The shift of the planar to suspension culture cell systems and the explosion of continuous manufacturing techniques have changed the scalability, consistency and economic attractiveness of AAV production. Suspension-adapted HEK293 cells are cultured in stirred-tank bioreactors, with a 50 L volume used in clinical material production or a 500-2000 L volume in commercial production, which attain a cell density of 8-12 x 106 cells/mL and do not need the labor-intensive cell factory processes and operations that consume 500-2000 trays per batch. In suspension culture, transient transfection systems that are optimized yield transfection efficiency of 75-90% with polyethylenimine reagents or lipid-based reagents, transfection input of 1-3 ug plasmid DNA/ million cells and yield transfection outputs of 10 4-105 vg/ cell 48-72 hours post transfection. Manufacturers such as Sartorius, Thermo Fisher, and Cytiva also offer single-use bioreactor systems that are not only cleaning-validation-free but also have a lower risk of cross-contamination, as well as the ability to run multiple programs using the same facilities. The implementation of process analytical technology offers real time monitoring of critical quality parameters of dissolved oxygen, pH, glucose, lactate and cell viability, which allows the implementation of closed loop control to ensure optimal production conditions and enhance the yield consistency that was previously 60-75% to 85-95% with a 10% improvement in yield consistency to maintain optimum levels. The current in development continuous manufacturing uses perfusion culture where the cells are kept in the exponential growth stage for long durations, and harvested with a continuous stream of AAV-containing supernatant, this can improve productivity 3-5-fold over batch processes and also can allow the facility to have a smaller footprint than before, as long as 40-60. Economic modelling suggests that continuous manufacturing would decrease the cost of goods from between $75,000-125,000/treatment dose to a $25,000-45,000-dollar treatment dose, which is important to increase access to curative gene treatments.
- Advanced Purification Technologies and Process Intensification: New chromatography media, continuous processing and new modalities of purification have revolutionized AAV recovery, purity and manufacturing throughput as well as cost and timeline reduction. AAV x AAV x AVB Sepharose or POROS Capture Select AAVX affinity chromatography One-step affinity chromatography with AVB Sepharose or POROS Capture Select AAVX yields 85-95% AAV recovery, 1,000-10,000 fold purification of crude lysate, and a low level of empty capsid contamination as opposed to 40-60% recovery and purification of crude lysates in 18-24 hours, with traditional iodixan Multimodal chromatography Multimodal chromatography is a type of chromatographic technique that combines an electrostatic, hydrophobic, and hydrogen bonding interaction to achieve simultaneous removal of the host cell proteins, residual DNA and empty capsids, with full-to-empty ratios improving 50 to 85% and impurities falling below the detection limit of 10 ng/dose and 10 pg/dose, respectively. Size exclusion and ion exchange membrane-based purification has scalability capabilities with processing rates of 100-500 L per hour compared to 10-50 L per hour with packed columns and disposable formats eliminate cleaning validation and campaign changeover is less than 1 day instead of 5-7 days. The buffer exchange, concentration and formulation of closed single-uses can be realized using Tangential flow filtration systems to achieve final concentrations of 1-5 x 10¹³ vg/mL that are able to be intrathecally administered or administered into the eye via small injection volumes. Process intensification methods combine several unit operations in continuous cycles and content processing time shifts to 3-5 days as opposed to the previous 7-14 days and overall recovery improves to 40-60 as opposed to 20-30.
- Analytical Characterization and Quality Control Innovation: The new generation of analysis technologies with increased sensitivity, accuracy and throughput has revolutionized the characterisation of AAV products to provide detailed quality assessment to support regulatory submissions as well as guarantee batch-to-batch consistency. Droplet digital PCR measures the titer of vectors in genomes with coefficients of variation of less than 5% relative to quantitative PCR with coefficients of variation of up to 15-30%, offering greater accuracy needed when dose-ranging studies are needed and the commercial release of a predecessor technology, where a 10-20% error in titer would result in under- or over-dosing of the test object, which would negatively impact efficacy and safety. Multiwavelength analytical ultracentrifugation is an analysis technique that uses multiple wavelength light to measure full vectorsomes containing capsids, empty capsids with no DNA, and those that are partially filled and offers rich compositional profiles that predict therapeutic potency and immunogenicity profiles in an underlying model. Transmission electron microscopy coupled with automated image analysis analyses 500-1,000 particles per sample in hours (as opposed to days) for statistical measurements of capsid integrity and aggregation and for ratios of full to empty capsids to create manufacturing process optimization decisions. The mass spectrometry of liquid chromatography establishes the characteristics of the capsid proteins that detect post-translational modifications such as phosphorylation, oxidation, and deamidation that influence stability and uptake and immune recognition with sensitivity of detection of the key modifications at 0.1%. Next generation sequencing to validate the integrity of vector genetics (genome), integrase ITR (integrase short SSI) structure, and exclude viral replication-competent AAV sources that affect and interact with the host at detection limits of 1 in 10^6 virus particles, thereby covering protection against potential safety concerns. The high throughput potency assays based on automated microscopy or flow cytometry serve to quantify the transduction efficacy in cell types of interest and thus the data interlinking in vitro results and clinical efficacy; they also report a 3–5-day turnaround compared to traditional assays, which take 7-14 days.
Category Wise Insights
By Vector Type
Why AAV2 Leads the Market?
AAV2 leads with 32% market share in 2025: Historical precedence-since AAV2 is the first AAV serotype well characterized (history-setter), has a well-established safety profile based on decades of experience of preclinical and clinical experience, can have a broad tropism profile allowing a range of therapeutic applications, and has an extensive track record of regulatory precedence with FDA approved Luxturna using AAV2. The serotype targets ubiquitously expressed heparan sulfate proteoglycan receptors which allow transduction of neurons, hepatocytes, muscle cells and retinal cells with 40-85% efficacy depending on the target tissue and dose. Those in the US and Europe have seen AAV2 commodity themselves approved in 2017, Luxturna could treat RPE65-mediated inherited retinal disease with over 500 patients across the board (some patients showing a 5-year lasting marked increment of vision). Technology transfer benefits are enjoyed through the manufacturing infrastructure and analytical techniques designed to produce AAV2 programs which have produced yields of 8-12 x 104 vg/cell and purification procedures producing a 85-92% recovery with full-to-empty ratios greater than 80%. Neuroscience applications AAV2 is extensively used in research with 45% of publications about AAV-based studies mentioning AAV2 vectors to transduce the brain.
By Application
Why Gene Therapy Shows Fastest Growth?
Gene therapy shows the best CAGR of 14.6% between 2026-2035 propelled by the accelerating clinical trial startup events with 280 AAV programs. in clinical development, the indications range from narrative patient monogenic diseases to large scale diseases affecting millions, regulatory pathway clarity is provided with 12 FDA’s approval and finally, investments are increasing, with $18.4 Billion venture capital funding totaled for gene therapy companies in 2024. The aggregate untapped market size of approved and late-stage AAV therapies is over $65 billion per year in the case of hemophilia, spinal muscular atrophy, Duchenne muscular dystrophy, and inherited retinal diseases combined. Every commercial therapy needs a manufacturing capacity that produces between 5,000 and 50,000 doses of treatment per year based on prevalence and market penetration, which is 10¹⁷⁻¹⁸ vector genomes per therapeutic dose of 10¹³⁻¹⁴ vg/kg. The growth of pipes into Parkinson’s disease in 10 million people worldwide, Alzheimer’s disease in 55 million, and heart failure in 64 million puts manufacturing demand orders of magnitude beyond the existing rare disease focus.
By Disease Indication
Why Neurology Demonstrates Strongest Growth?
Neurology is expected to experience the greatest CAGR of 15.2% between 2026 and 2035 due to the unique ability of AAVs to cross the blood-brain barrier after systemic delivery, decades-long expression of transgenes in non-dividing neurons, and huge untapped demand in neurodegenerative diseases that lack disease-modifying therapeutics. AAV9 and engineered variants exhibit efficient CNS transduction capacity – clinical programs of AAV9 identified efficiency in spinal muscular atrophy, Rett syndrome, AADC deficiency and also GM1 gangliosidosis where efficacy was dramatic. Programs of PD apply the AAV to provide genes of GDNF, aromatic L-amino acid decarboxylase, or GBA1 enzyme, with Phase 2 trials showing motor improvement and less drug needs. Alzheimer programs focus on the APOE, BDNF, and neprilysin gene expression, the preclinical evidence demonstrates the reduction of the amyloid and preservation of the cognitive abilities. According to WHO, the neurological disorder burden impacts more than 1 billion people in the world and the gene therapies may be potentially applicable to 15-20% of the patient population which is 150-200 million individuals and the manufacturing needs are 100 times higher than the current industry capacity.
Report Scope
| Feature of the Report | Details |
| Market Size in 2026 | USD 3.22 billion |
| Projected Market Size in 2035 | USD 9.87 billion |
| Market Size in 2025 | USD 2.84 billion |
| CAGR Growth Rate | 13.4% CAGR |
| Base Year | 2025 |
| Forecast Period | 2026-2035 |
| Key Segment | By Vector Type, Application, Disease Indication, Production Method, End User and Region |
| Report Coverage | Revenue Estimation and Forecast, Company Profile, Competitive Landscape, Growth Factors and Recent Trends |
| Regional Scope | North America, Europe, Asia Pacific, Middle East & Africa, and South & Central America |
| Buying Options | Request tailored purchasing options to fulfil your requirements for research. |
Regional Analysis
How Big is the North America Market Size?
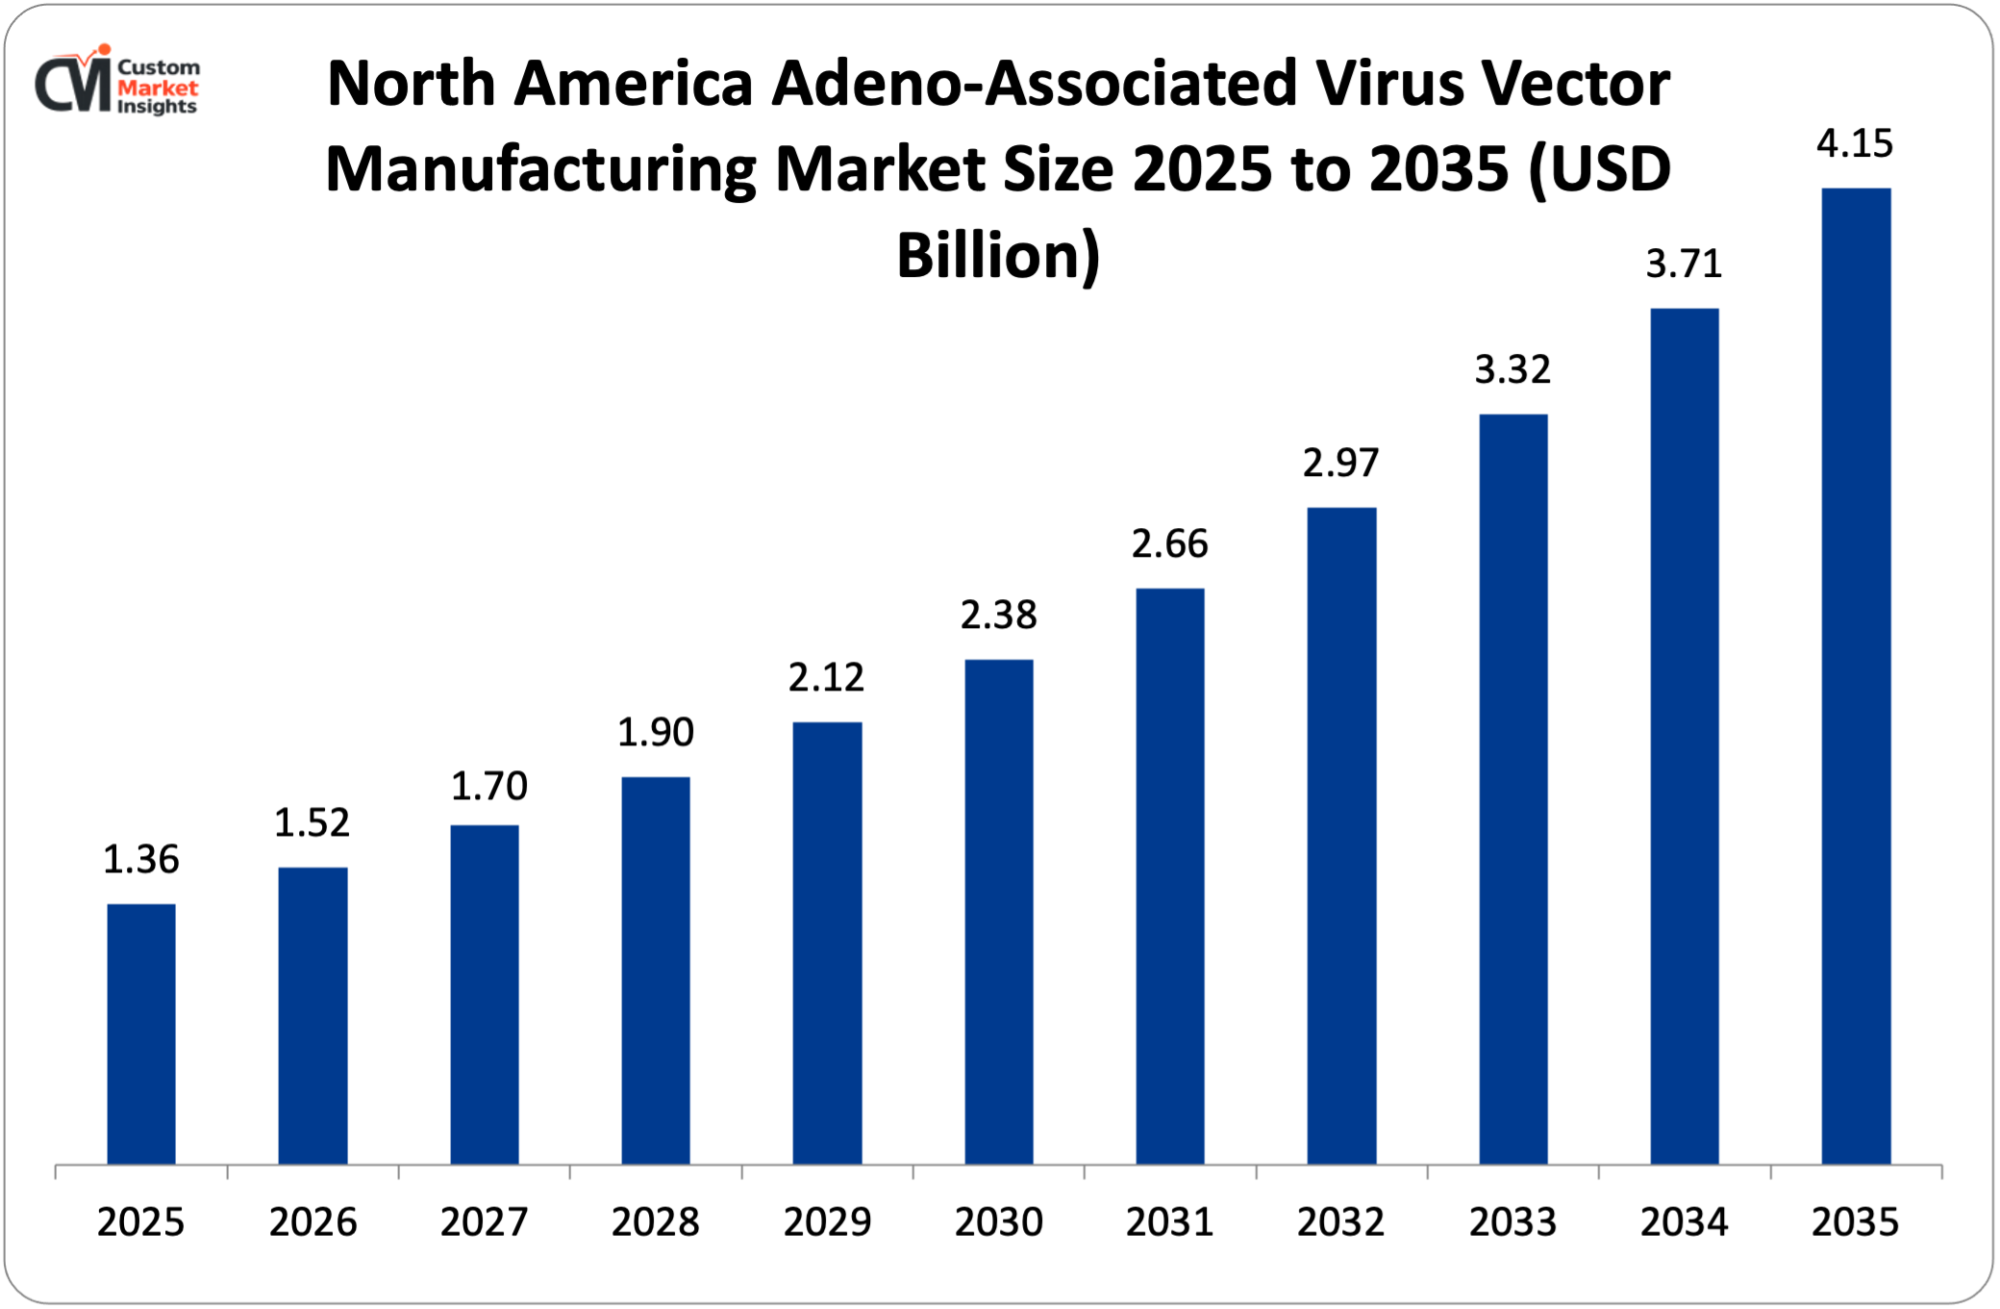
The North America AAV vector manufacturing market size is estimated at USD 1.36 billion in 2025 and is projected to reach approximately USD 4.15 billion by 2035, with a 12.8% CAGR from 2026 to 2035.
Why did North America Dominate the Market in 2025?
In 2025, it is projected that North America will have 48% market share because of its greatest concentration of gene therapy developers, 420 companies running AAV programs, extensive CDMO infrastructure with 18 dedicated AAV manufacturing plants, substantial venture capital investment in gene therapy of more than 12.4 billion, a positive regulatory environment with the Center of Biologics Evaluation and Research at the FDA providing guidance and leading academic centers such as the University of Pennsylvania, Harvard, and Stanford leading AAV research. The U.S. has 65% of all clinical trials in gene therapy in the world with NIH annually budgeting $425 million on AAV research. The fact that the FDA approved 9 out of 12 global AAV therapies demonstrates that the region performs well in regulation and is appealing to investors. Capacity Manufacturing capacity consists of the 230,000 sq ft Catalent facility in Maryland, the 150,000 sq ft FUJIFILM Diosynth facility in North Carolina, and the proposed 105,000 sq ft Oxford Biomedica facility in Massachusetts, which can support 100+ programs simultaneously.
What is the Size of the U.S. Market?
In the U.S., the market size of AAV vector manufacturing is estimated at USD 1.24 billion in 2025 and is anticipated to grow at 12.6% between 2026 and 2035.
Why is Asia Pacific Experiencing Rapid Growth?
The fastest growth is in Asia Pacific which is projected at 16.8% CAGR in 2026-2035 due to rapidly growing gene therapy ecosystem in China with 85 AAV clinical trials in 2024, large government investment where the 14th Five-Year Plan of the Chinese government has allocated 2.3 billion to gene therapy development, low cost of manufacturing with labor and facility costs 50-70 less than Western markets and increasing medical tourism for gene therapies. WuXi AppTec is a design company that has 180,000 sq ft AAV manufacturing capacity in Shanghai that can produce 60 or more programs, and domestic firms such as Shanghai Genbase and Huidagene are able to generate GMP facilities to international standards. China’s National Medical Products Administration approved 4 domestic gene therapies in 2024, which will increase the onus on local manufacturing. India and Singapore are developing as manufacturing centres and have good regulatory environments and availability of a skilled labour force.
Why is Europe Focusing on Advanced Manufacturing?
The market penetration of Europe is high at 1.18 billion in 2025 with well-defined academic research institutions, favorable regulatory environment due to the European Medicines Agency regulation of Advanced Therapy Medicinal Products, and a developed CDMO. Oxford Biomedica has 750,000 sq ft in the UK facilities and Batavia Biosciences, Netherlands and SIRION Biotech, Germany offer special AAV services. The manufacturers of European gene therapies such as UniQure, Freeline Therapeutics and 4D Molecular Therapeutics are spurring manufacturing demand. The region worked on 135 AAV clinical trials during 2024, targeting hemophilia, neurology, and ophthalmology indications. In 2021, Government funding for advanced therapy development under the Horizon Europe program was allocated 850 million.
Top Players in the Market and Their Offerings
- Thermo Fisher Scientific Inc.
- Catalent Inc.
- WuXi AppTec
- Oxford Biomedica plc
- FUJIFILM Diosynth Biotechnologies
- Lonza Group Ltd.
- MilliporeSigma (Merck KGaA)
- Cobra Biologics
- Vigene Biosciences
- SignaGen Laboratories
- Charles River Laboratories
- Batavia Biosciences
- Others
Key Developments
- In February 2025: Thermo Fisher acquired Vigene Biosciences for $785 million, adding a suspension cell culture platform that achieves 3-5-fold higher AAV yields and expands CDMO market share.
- In April 2025: Oxford Biomedica announced a strategic partnership with Eli Lilly for commercial AAV manufacturing supporting multiple neurological disease programs, representing $450 million in potential revenue over 5 years.
These strategic activities have allowed companies to strengthen market positions, expand production capacity, enhance technological capabilities, and capitalize on growth opportunities within the expanding market.
The Adeno Associated Virus Vector Manufacturing Market is segmented as follows:
By Vector Type
- AAV2
- AAV5
- AAV8
- AAV9
- Novel Engineered Serotypes
- Others
By Application
- Gene Therapy
- Vaccine Development
- Research Applications
- Others
By Disease Indication
- Oncology
- Neurology
- Ophthalmology
- Hematology
- Metabolic Disorders
- Others
By Production Method
- Transient Transfection
- Stable Cell Line
- Baculovirus System
- Herpes Simplex Virus System
- Others
By End User
- Pharmaceutical & Biotechnology Companies
- Contract Development & Manufacturing Organizations
- Academic & Research Institutes
- Others
Regional Coverage:
North America
- U.S.
- Canada
- Mexico
- Rest of North America
Europe
- Germany
- France
- U.K.
- Russia
- Italy
- Spain
- Netherlands
- Rest of Europe
Asia Pacific
- China
- Japan
- India
- New Zealand
- Australia
- South Korea
- Taiwan
- Rest of Asia Pacific
The Middle East & Africa
- Saudi Arabia
- UAE
- Egypt
- Kuwait
- South Africa
- Rest of the Middle East & Africa
Latin America
- Brazil
- Argentina
- Rest of Latin America
Table of Contents
- Chapter 1. Preface
- 1.1 Report Description and Scope
- 1.2 Research scope
- 1.3 Research methodology
- 1.3.1 Market Research Type
- 1.3.2 Market research methodology
- Chapter 2. Executive Summary
- 2.1 Global Adeno Associated Virus Vector Manufacturing Market, (2026 – 2035) (USD Billion)
- 2.2 Global Adeno Associated Virus Vector Manufacturing Market: snapshot
- Chapter 3. Global Adeno Associated Virus Vector Manufacturing Market – Industry Analysis
- 3.1 Adeno Associated Virus Vector Manufacturing Market: Market Dynamics
- 3.2 Market Drivers
- 3.2.1 Accelerating Gene Therapy Approvals and Clinical Pipeline Expansion
- 3.2.2 Rising Prevalence of Genetic and Rare Diseases
- 3.2.3 Technological Advancements in Manufacturing and Purification
- 3.2.4 Expanding CDMO Capacity and Strategic Partnerships
- 3.3 Market Restraints
- 3.4 Market Opportunities
- 3.5 Market Challenges
- 3.6 Porter’s Five Forces Analysis
- 3.7 Market Attractiveness Analysis
- 3.7.1 Market attractiveness analysis By Vector Type
- 3.7.2 Market attractiveness analysis By Application
- 3.7.3 Market attractiveness analysis By Disease Indication
- 3.7.4 Market attractiveness analysis By Production Method
- 3.7.5 Market attractiveness analysis By End User
- Chapter 4. Global Adeno Associated Virus Vector Manufacturing Market- Competitive Landscape
- 4.1 Company market share analysis
- 4.1.1 Global Adeno Associated Virus Vector Manufacturing Market: company market share, 2025
- 4.2 Strategic development
- 4.2.1 Acquisitions & mergers
- 4.2.2 New Product launches
- 4.2.3 Agreements, partnerships, collaborations, and joint ventures
- 4.2.4 Research and development and Regional expansion
- 4.3 Price trend analysis
- 4.1 Company market share analysis
- Chapter 5. Global Adeno Associated Virus Vector Manufacturing Market – Vector Type Analysis
- 5.1 Global Adeno Associated Virus Vector Manufacturing Market overview: By Vector Type
- 5.1.1 Global Adeno Associated Virus Vector Manufacturing Market share, By Vector Type, 2025 and 2035
- 5.2 AAV2
- 5.2.1 Global Adeno Associated Virus Vector Manufacturing Market by AAV2, 2026 – 2035 (USD Billion)
- 5.3 AAV5
- 5.3.1 Global Adeno Associated Virus Vector Manufacturing Market by AAV5, 2026 – 2035 (USD Billion)
- 5.4 AAV8
- 5.4.1 Global Adeno Associated Virus Vector Manufacturing Market by AAV8, 2026 – 2035 (USD Billion)
- 5.5 AAV9
- 5.5.1 Global Adeno Associated Virus Vector Manufacturing Market by AAV9, 2026 – 2035 (USD Billion)
- 5.6 Novel Engineered Serotypes
- 5.6.1 Global Adeno Associated Virus Vector Manufacturing Market by Novel Engineered Serotypes, 2026 – 2035 (USD Billion)
- 5.7 Others
- 5.7.1 Global Adeno Associated Virus Vector Manufacturing Market by Others, 2026 – 2035 (USD Billion)
- 5.1 Global Adeno Associated Virus Vector Manufacturing Market overview: By Vector Type
- Chapter 6. Global Adeno Associated Virus Vector Manufacturing Market – Application Analysis
- 6.1 Global Adeno Associated Virus Vector Manufacturing Market overview: By Application
- 6.1.1 Global Adeno Associated Virus Vector Manufacturing Market share, By Application, 2025 and 2035
- 6.2 Gene Therapy
- 6.2.1 Global Adeno Associated Virus Vector Manufacturing Market by Gene Therapy, 2026 – 2035 (USD Billion)
- 6.3 Vaccine Development
- 6.3.1 Global Adeno Associated Virus Vector Manufacturing Market by Vaccine Development, 2026 – 2035 (USD Billion)
- 6.4 Research Applications
- 6.4.1 Global Adeno Associated Virus Vector Manufacturing Market by Research Applications, 2026 – 2035 (USD Billion)
- 6.5 Others
- 6.5.1 Global Adeno Associated Virus Vector Manufacturing Market by Others, 2026 – 2035 (USD Billion)
- 6.1 Global Adeno Associated Virus Vector Manufacturing Market overview: By Application
- Chapter 7. Global Adeno Associated Virus Vector Manufacturing Market – Disease Indication Analysis
- 7.1 Global Adeno Associated Virus Vector Manufacturing Market overview: By Disease Indication
- 7.1.1 Global Adeno Associated Virus Vector Manufacturing Market share, By Disease Indication, 2025 and 2035
- 7.2 Oncology
- 7.2.1 Global Adeno Associated Virus Vector Manufacturing Market by Oncology, 2026 – 2035 (USD Billion)
- 7.3 Neurology
- 7.3.1 Global Adeno Associated Virus Vector Manufacturing Market by Neurology, 2026 – 2035 (USD Billion)
- 7.4 Ophthalmology
- 7.4.1 Global Adeno Associated Virus Vector Manufacturing Market by Ophthalmology, 2026 – 2035 (USD Billion)
- 7.5 Hematology
- 7.5.1 Global Adeno Associated Virus Vector Manufacturing Market by Hematology, 2026 – 2035 (USD Billion)
- 7.6 Metabolic Disorders
- 7.6.1 Global Adeno Associated Virus Vector Manufacturing Market by Metabolic Disorders, 2026 – 2035 (USD Billion)
- 7.7 Others
- 7.7.1 Global Adeno Associated Virus Vector Manufacturing Market by Others, 2026 – 2035 (USD Billion)
- 7.1 Global Adeno Associated Virus Vector Manufacturing Market overview: By Disease Indication
- Chapter 8. Global Adeno Associated Virus Vector Manufacturing Market – Production Method Analysis
- 8.1 Global Adeno Associated Virus Vector Manufacturing Market overview: By Production Method
- 8.1.1 Global Adeno Associated Virus Vector Manufacturing Market share, By Production Method, 2025 and 2035
- 8.2 Transient Transfection
- 8.2.1 Global Adeno Associated Virus Vector Manufacturing Market by Transient Transfection, 2026 – 2035 (USD Billion)
- 8.3 Stable Cell Line
- 8.3.1 Global Adeno Associated Virus Vector Manufacturing Market by Stable Cell Line, 2026 – 2035 (USD Billion)
- 8.4 Baculovirus System
- 8.4.1 Global Adeno Associated Virus Vector Manufacturing Market by Baculovirus System, 2026 – 2035 (USD Billion)
- 8.5 Herpes Simplex Virus System
- 8.5.1 Global Adeno Associated Virus Vector Manufacturing Market by Herpes Simplex Virus System, 2026 – 2035 (USD Billion)
- 8.6 Others
- 8.6.1 Global Adeno Associated Virus Vector Manufacturing Market by Others, 2026 – 2035 (USD Billion)
- 8.1 Global Adeno Associated Virus Vector Manufacturing Market overview: By Production Method
- Chapter 9. Global Adeno Associated Virus Vector Manufacturing Market – End User Analysis
- 9.1 Global Adeno Associated Virus Vector Manufacturing Market overview: By End User
- 9.1.1 Global Adeno Associated Virus Vector Manufacturing Market share, By End User, 2025 and 2035
- 9.2 Pharmaceutical & Biotechnology Companies
- 9.2.1 Global Adeno Associated Virus Vector Manufacturing Market by Pharmaceutical & Biotechnology Companies, 2026 – 2035 (USD Billion)
- 9.3 Contract Development & Manufacturing Organizations
- 9.3.1 Global Adeno Associated Virus Vector Manufacturing Market by Contract Development & Manufacturing Organizations, 2026 – 2035 (USD Billion)
- 9.4 Academic & Research Institutes
- 9.4.1 Global Adeno Associated Virus Vector Manufacturing Market by Academic & Research Institutes, 2026 – 2035 (USD Billion)
- 9.5 Others
- 9.5.1 Global Adeno Associated Virus Vector Manufacturing Market by Others, 2026 – 2035 (USD Billion)
- 9.1 Global Adeno Associated Virus Vector Manufacturing Market overview: By End User
- Chapter 10. Adeno Associated Virus Vector Manufacturing Market – Regional Analysis
- 10.1 Global Adeno Associated Virus Vector Manufacturing Market Regional Overview
- 10.2 Global Adeno Associated Virus Vector Manufacturing Market Share, by Region, 2025 & 2035 (USD Billion)
- 10.3. North America
- 10.3.1 North America Adeno Associated Virus Vector Manufacturing Market, 2026 – 2035 (USD Billion)
- 10.3.1.1 North America Adeno Associated Virus Vector Manufacturing Market, by Country, 2026 – 2035 (USD Billion)
- 10.3.1 North America Adeno Associated Virus Vector Manufacturing Market, 2026 – 2035 (USD Billion)
- 10.4 North America Adeno Associated Virus Vector Manufacturing Market, by Vector Type, 2026 – 2035
- 10.4.1 North America Adeno Associated Virus Vector Manufacturing Market, by Vector Type, 2026 – 2035 (USD Billion)
- 10.5 North America Adeno Associated Virus Vector Manufacturing Market, by Application, 2026 – 2035
- 10.5.1 North America Adeno Associated Virus Vector Manufacturing Market, by Application, 2026 – 2035 (USD Billion)
- 10.6 North America Adeno Associated Virus Vector Manufacturing Market, by Disease Indication, 2026 – 2035
- 10.6.1 North America Adeno Associated Virus Vector Manufacturing Market, by Disease Indication, 2026 – 2035 (USD Billion)
- 10.7 North America Adeno Associated Virus Vector Manufacturing Market, by Production Method, 2026 – 2035
- 10.7.1 North America Adeno Associated Virus Vector Manufacturing Market, by Production Method, 2026 – 2035 (USD Billion)
- 10.8 North America Adeno Associated Virus Vector Manufacturing Market, by End User, 2026 – 2035
- 10.8.1 North America Adeno Associated Virus Vector Manufacturing Market, by End User, 2026 – 2035 (USD Billion)
- 10.9. Europe
- 10.9.1 Europe Adeno Associated Virus Vector Manufacturing Market, 2026 – 2035 (USD Billion)
- 10.9.1.1 Europe Adeno Associated Virus Vector Manufacturing Market, by Country, 2026 – 2035 (USD Billion)
- 10.9.1 Europe Adeno Associated Virus Vector Manufacturing Market, 2026 – 2035 (USD Billion)
- 10.10 Europe Adeno Associated Virus Vector Manufacturing Market, by Vector Type, 2026 – 2035
- 10.10.1 Europe Adeno Associated Virus Vector Manufacturing Market, by Vector Type, 2026 – 2035 (USD Billion)
- 10.11 Europe Adeno Associated Virus Vector Manufacturing Market, by Application, 2026 – 2035
- 10.11.1 Europe Adeno Associated Virus Vector Manufacturing Market, by Application, 2026 – 2035 (USD Billion)
- 10.12 Europe Adeno Associated Virus Vector Manufacturing Market, by Disease Indication, 2026 – 2035
- 10.12.1 Europe Adeno Associated Virus Vector Manufacturing Market, by Disease Indication, 2026 – 2035 (USD Billion)
- 10.13 Europe Adeno Associated Virus Vector Manufacturing Market, by Production Method, 2026 – 2035
- 10.13.1 Europe Adeno Associated Virus Vector Manufacturing Market, by Production Method, 2026 – 2035 (USD Billion)
- 10.14 Europe Adeno Associated Virus Vector Manufacturing Market, by End User, 2026 – 2035
- 10.14.1 Europe Adeno Associated Virus Vector Manufacturing Market, by End User, 2026 – 2035 (USD Billion)
- 10.15. Asia Pacific
- 10.15.1 Asia Pacific Adeno Associated Virus Vector Manufacturing Market, 2026 – 2035 (USD Billion)
- 10.15.1.1 Asia Pacific Adeno Associated Virus Vector Manufacturing Market, by Country, 2026 – 2035 (USD Billion)
- 10.15.1 Asia Pacific Adeno Associated Virus Vector Manufacturing Market, 2026 – 2035 (USD Billion)
- 10.16 Asia Pacific Adeno Associated Virus Vector Manufacturing Market, by Vector Type, 2026 – 2035
- 10.16.1 Asia Pacific Adeno Associated Virus Vector Manufacturing Market, by Vector Type, 2026 – 2035 (USD Billion)
- 10.17 Asia Pacific Adeno Associated Virus Vector Manufacturing Market, by Application, 2026 – 2035
- 10.17.1 Asia Pacific Adeno Associated Virus Vector Manufacturing Market, by Application, 2026 – 2035 (USD Billion)
- 10.18 Asia Pacific Adeno Associated Virus Vector Manufacturing Market, by Disease Indication, 2026 – 2035
- 10.18.1 Asia Pacific Adeno Associated Virus Vector Manufacturing Market, by Disease Indication, 2026 – 2035 (USD Billion)
- 10.19 Asia Pacific Adeno Associated Virus Vector Manufacturing Market, by Production Method, 2026 – 2035
- 10.19.1 Asia Pacific Adeno Associated Virus Vector Manufacturing Market, by Production Method, 2026 – 2035 (USD Billion)
- 10.20 Asia Pacific Adeno Associated Virus Vector Manufacturing Market, by End User, 2026 – 2035
- 10.20.1 Asia Pacific Adeno Associated Virus Vector Manufacturing Market, by End User, 2026 – 2035 (USD Billion)
- 10.21. Latin America
- 10.21.1 Latin America Adeno Associated Virus Vector Manufacturing Market, 2026 – 2035 (USD Billion)
- 10.21.1.1 Latin America Adeno Associated Virus Vector Manufacturing Market, by Country, 2026 – 2035 (USD Billion)
- 10.21.1 Latin America Adeno Associated Virus Vector Manufacturing Market, 2026 – 2035 (USD Billion)
- 10.22 Latin America Adeno Associated Virus Vector Manufacturing Market, by Vector Type, 2026 – 2035
- 10.22.1 Latin America Adeno Associated Virus Vector Manufacturing Market, by Vector Type, 2026 – 2035 (USD Billion)
- 10.23 Latin America Adeno Associated Virus Vector Manufacturing Market, by Application, 2026 – 2035
- 10.23.1 Latin America Adeno Associated Virus Vector Manufacturing Market, by Application, 2026 – 2035 (USD Billion)
- 10.24 Latin America Adeno Associated Virus Vector Manufacturing Market, by Disease Indication, 2026 – 2035
- 10.24.1 Latin America Adeno Associated Virus Vector Manufacturing Market, by Disease Indication, 2026 – 2035 (USD Billion)
- 10.25 Latin America Adeno Associated Virus Vector Manufacturing Market, by Production Method, 2026 – 2035
- 10.25.1 Latin America Adeno Associated Virus Vector Manufacturing Market, by Production Method, 2026 – 2035 (USD Billion)
- 10.26 Latin America Adeno Associated Virus Vector Manufacturing Market, by End User, 2026 – 2035
- 10.26.1 Latin America Adeno Associated Virus Vector Manufacturing Market, by End User, 2026 – 2035 (USD Billion)
- 10.27. The Middle-East and Africa
- 10.27.1 The Middle-East and Africa Adeno Associated Virus Vector Manufacturing Market, 2026 – 2035 (USD Billion)
- 10.27.1.1 The Middle-East and Africa Adeno Associated Virus Vector Manufacturing Market, by Country, 2026 – 2035 (USD Billion)
- 10.27.1 The Middle-East and Africa Adeno Associated Virus Vector Manufacturing Market, 2026 – 2035 (USD Billion)
- 10.28 The Middle-East and Africa Adeno Associated Virus Vector Manufacturing Market, by Vector Type, 2026 – 2035
- 10.28.1 The Middle-East and Africa Adeno Associated Virus Vector Manufacturing Market, by Vector Type, 2026 – 2035 (USD Billion)
- 10.29 The Middle-East and Africa Adeno Associated Virus Vector Manufacturing Market, by Application, 2026 – 2035
- 10.29.1 The Middle-East and Africa Adeno Associated Virus Vector Manufacturing Market, by Application, 2026 – 2035 (USD Billion)
- 10.30 The Middle-East and Africa Adeno Associated Virus Vector Manufacturing Market, by Disease Indication, 2026 – 2035
- 10.30.1 The Middle-East and Africa Adeno Associated Virus Vector Manufacturing Market, by Disease Indication, 2026 – 2035 (USD Billion)
- 10.31 The Middle-East and Africa Adeno Associated Virus Vector Manufacturing Market, by Production Method, 2026 – 2035
- 10.31.1 The Middle-East and Africa Adeno Associated Virus Vector Manufacturing Market, by Production Method, 2026 – 2035 (USD Billion)
- 10.32 The Middle-East and Africa Adeno Associated Virus Vector Manufacturing Market, by End User, 2026 – 2035
- 10.32.1 The Middle-East and Africa Adeno Associated Virus Vector Manufacturing Market, by End User, 2026 – 2035 (USD Billion)
- Chapter 11. Company Profiles
- 11.1 Thermo Fisher Scientific Inc.
- 11.1.1 Overview
- 11.1.2 Financials
- 11.1.3 Product Portfolio
- 11.1.4 Business Strategy
- 11.1.5 Recent Developments
- 11.2 Catalent Inc.
- 11.2.1 Overview
- 11.2.2 Financials
- 11.2.3 Product Portfolio
- 11.2.4 Business Strategy
- 11.2.5 Recent Developments
- 11.3 WuXi AppTec
- 11.3.1 Overview
- 11.3.2 Financials
- 11.3.3 Product Portfolio
- 11.3.4 Business Strategy
- 11.3.5 Recent Developments
- 11.4 Oxford Biomedica plc
- 11.4.1 Overview
- 11.4.2 Financials
- 11.4.3 Product Portfolio
- 11.4.4 Business Strategy
- 11.4.5 Recent Developments
- 11.5 FUJIFILM Diosynth Biotechnologies
- 11.5.1 Overview
- 11.5.2 Financials
- 11.5.3 Product Portfolio
- 11.5.4 Business Strategy
- 11.5.5 Recent Developments
- 11.6 Lonza Group Ltd.
- 11.6.1 Overview
- 11.6.2 Financials
- 11.6.3 Product Portfolio
- 11.6.4 Business Strategy
- 11.6.5 Recent Developments
- 11.7 MilliporeSigma (Merck KGaA)
- 11.7.1 Overview
- 11.7.2 Financials
- 11.7.3 Product Portfolio
- 11.7.4 Business Strategy
- 11.7.5 Recent Developments
- 11.8 Cobra Biologics
- 11.8.1 Overview
- 11.8.2 Financials
- 11.8.3 Product Portfolio
- 11.8.4 Business Strategy
- 11.8.5 Recent Developments
- 11.9 Vigene Biosciences
- 11.9.1 Overview
- 11.9.2 Financials
- 11.9.3 Product Portfolio
- 11.9.4 Business Strategy
- 11.9.5 Recent Developments
- 11.10 SignaGen Laboratories
- 11.10.1 Overview
- 11.10.2 Financials
- 11.10.3 Product Portfolio
- 11.10.4 Business Strategy
- 11.10.5 Recent Developments
- 11.11 Charles River Laboratories
- 11.11.1 Overview
- 11.11.2 Financials
- 11.11.3 Product Portfolio
- 11.11.4 Business Strategy
- 11.11.5 Recent Developments
- 11.12 Batavia Biosciences
- 11.12.1 Overview
- 11.12.2 Financials
- 11.12.3 Product Portfolio
- 11.12.4 Business Strategy
- 11.12.5 Recent Developments
- 11.13 Others.
- 11.13.1 Overview
- 11.13.2 Financials
- 11.13.3 Product Portfolio
- 11.13.4 Business Strategy
- 11.13.5 Recent Developments
- 11.1 Thermo Fisher Scientific Inc.
List Of Figures
Figures No 1 to 45
List Of Tables
Tables No 1 to 127
Prominent Player
- Thermo Fisher Scientific Inc.
- Catalent Inc.
- WuXi AppTec
- Oxford Biomedica plc
- FUJIFILM Diosynth Biotechnologies
- Lonza Group Ltd.
- MilliporeSigma (Merck KGaA)
- Cobra Biologics
- Vigene Biosciences
- SignaGen Laboratories
- Charles River Laboratories
- Batavia Biosciences
- Others
FAQs
The key players in the market are Thermo Fisher Scientific Inc., Catalent Inc., WuXi AppTec, Oxford Biomedica plc, FUJIFILM Diosynth Biotechnologies, Lonza Group Ltd., MilliporeSigma (Merck KGaA), Cobra Biologics, Vigene Biosciences, SignaGen Laboratories, Charles River Laboratories, Batavia Biosciences, Others.
Regulations have a major influence through FDA regulatory instructions of gene therapy manufacturing safety and efficacy, the EMA Advanced Therapy Medicinal Products framework of EU standards, GMP requirements of validated production processes and quality systems, orphan drug designation of market exclusivity incentives of rare disease treatments, and reimbursement policies to determine market access to costly gene therapies of between 850,000 and USD 3.5 million per treatment.
By the year 2035, the market is projected to grow to USD 9.87 billion at a CAGR of 13.4% between the years 2026 and 2035 due to increased approved therapy portfolios, maturation of clinical pipelines, advancement in manufacturing technologies, expansion of CDMO capacity, as well as a rise in indication by rare to common diseases.
North America is the leader with a 48% share, led by 420 gene therapy companies, 18 dedicated AAV manufacturing facilities, the presence of 12 AAV therapies approved by the FDA, of 12 approved worldwide), and the presence of leading academic institutions doing pioneering work on AAV.
Asia-Pacific has shown the highest growth of 16.8% CAGR between 2026-2035 due to China’s 85 AAV clinical trials and government funding of 2.3 billion dollars, low cost manufacturing of 50-70 lower cost, growing CDMO infrastructure with WuXi and domestic providers, and the growth in medical tourism of gene therapies with government regulations supporting it.
The Global AAV Vector Manufacturing Market is growing due to accelerating approval rates of gene therapies with 12 approved FDA AAV therapeutics and 280 development programs, rising prevalence of genetic diseases with 300 million globally and genetic diseases, increased manufacturing technology with 10-fold to 10^4-105 vg/cell, increased CDMO capacity with more than 2 billion infrastructure investment from 2020-2024 and increasing R&D funding with 18.4 billion in venture capital in gene therapy companies in 2024.