Heavy Commercial Vehicle Lubricants Market Size, Trends and Insights By Product Type (Engine Oils, Monograde Engine Oils, Multigrade Mineral Engine Oils, Synthetic Blend Engine Oils, Fully Synthetic Engine Oils, Natural Gas Engine Oils, Transmission Fluids, Automatic Transmission Fluids (ATF), AMT-Specific Transmission Fluids, Manual Transmission Fluids, Gear Oils, Axle & Differential Gear Oils, Transfer Case Oils, Final Drive Oils, Hydraulic Fluids, Mineral-Based Hydraulic Fluids, Synthetic Hydraulic Fluids, Environmentally Acceptable Hydraulic Fluids (EAH), Grease & Other Lubricants, Chassis & Wheel Bearing Grease, Multipurpose Grease, Specialty Greases), By Vehicle Type (Trucks, Long-Haul Heavy Trucks (Class 8 / >15T GVW), Medium Heavy Trucks (Class 6–7 / 6–15T GVW), Vocational & Specialty Trucks, Buses & Coaches, City Transit Buses, Intercity & Coach Buses, School Buses, Construction Vehicles, Excavators & Loaders, Dump Trucks & Articulated Haulers, Cranes & Piling Equipment, Agricultural Vehicles, Tractors (High-Horsepower), Combine Harvesters, Self-Propelled Sprayers), By Sales Channel (OEM (Original Equipment Manufacturer), Aftermarket, Independent Workshops & Dealers, Fleet Service Centers, Retail & Online Channels, Fleet Direct), By End Use (Long-Haul Transportation, Construction & Mining, Agriculture, Public Transit, Other End Uses), and By Region - Global Industry Overview, Statistical Data, Competitive Analysis, Share, Outlook, and Forecast 2026 – 2035
Report Snapshot
CAGR: 4.6%
| Study Period: | 2026-2035 |
| Fastest Growing Market: | LAMEA |
| Largest Market: | Asia Pacific |
Major Players
- Shell plc
- ExxonMobil Corporation
- BP plc (Castrol)
- TotalEnergies SE
- Others
Reports Description
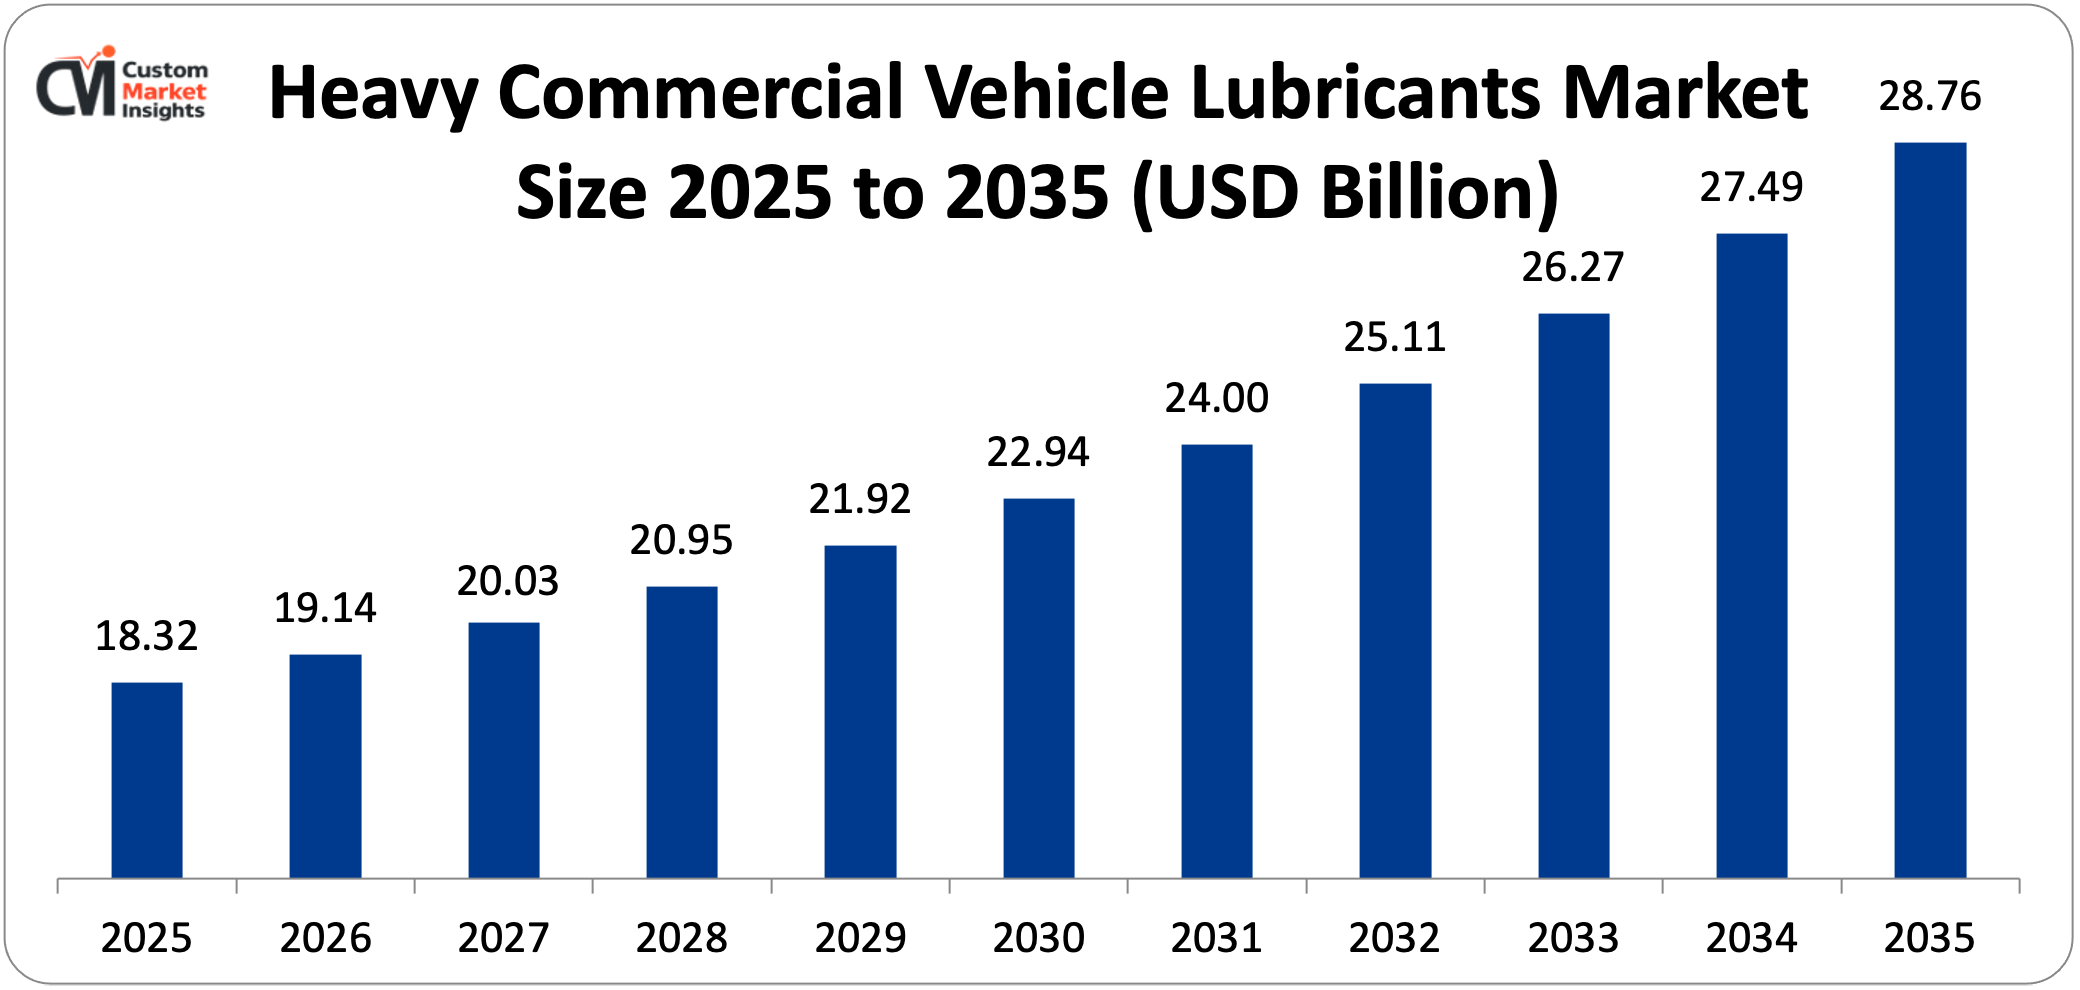
The size of the global lubricant business of heavy commercial vehicles is estimated to be USD 19.14 billion in 2026, and is expected to grow to approximately USD 28.76 billion by the year 2035 having a CAGR of 4.6% between the years 2026 and 2035. The ongoing increase in volume of freight worldwide courtesy of increased e-commerce and supply chain intense activity, the continued investment in infrastructure building and mining sector expansion in the emerging economies, the increased penetration of longer-drain synthetic lubricants and lower aggregate costs of ownership for fleet operators, the growing pressure in regulation to ensure an environmentally compliant formulation of engine lubricants based on low-emission engine lubricants and the increased use of natural gas and hybrid commercial vehicle powertrains requiring specialized lubricant chemistries are collectively propelling market growth.
Market Highlight
- Asia Pacific led the heavy commercial vehicle lubricants market with a 46% market share in 2025, driven by the region’s dominant commercial vehicle production and operation base across China, India, and Southeast Asia.
- North America is expected to expand at a CAGR of 4.1% between 2026 and 2035, driven by fleet modernization, extended-drain synthetic lubricant adoption, and growing natural gas truck penetration across long-haul freight corridors.
- By product type, engine oils captured approximately 48% of market share in 2025, reflecting the dominant role of diesel engine lubrication as the highest-volume and highest-value lubricant application in heavy commercial vehicles globally.
- By product type, the transmission fluids segment is growing at the fastest CAGR of 5.8% from 2026 to 2035, driven by the rapid adoption of automated manual transmissions and fully automatic transmissions in heavy trucks requiring sophisticated ATF and AMT-specific fluid chemistries.
- By vehicle type, trucks held a dominant 61% share of total market revenue in 2025, reflecting their position as the primary heavy commercial vehicle category by both population and lubricant consumption intensity.
- By sales channel, the aftermarket segment contributed the highest market share of 54% in 2025, reflecting the large installed base of in-service heavy commercial vehicles consuming replacement lubricants across their operational lifetimes.
- By sales channel, the aftermarket segment contributed the highest market share of 54% in 2025, reflecting the large installed base of in-service heavy commercial vehicles consuming replacement lubricants across their operational lifetimes.
Significant Growth Factors
The Heavy Commercial Vehicle Lubricants Market Trends present significant growth opportunities due to several factors:
- Sustained Global Freight Volume Growth and Commercial Vehicle Fleet Expansion Driving Structural Lubricant Demand: The transition from conventional mineral oil-based heavy-duty diesel engine oils with drain intervals of 15,000–25,000 kilometers to fully synthetic and synthetic-blend formulations enabling extended drain intervals of 80,000–150,000 kilometers or more — depending on engine type, operating conditions, and used oil analysis program results — represents the most commercially significant technical development in the heavy commercial vehicle lubricant market, simultaneously transforming fleet maintenance economics and reducing total lubricant consumption volume per vehicle lifetime while substantially increasing the per-liter revenue value of the lubricant consumed. Extended drain interval lubricants benefit fleet operators through multiple cost reduction pathways: reduced maintenance labor costs as oil change frequency decreases from every 4–6 weeks to every 3–6 months for long-haul operations, reduced lubricant purchase frequency offsetting the premium per-liter price of synthetic products, reduced vehicle downtime for scheduled maintenance enabling higher fleet utilization rates and lower revenue-per-mile operating costs, and reduced used oil disposal costs and associated environmental compliance burden for fleet operators managing large volumes of waste oil. For major long-haul fleet operators with hundreds or thousands of trucks, the total cost of ownership reduction from extended drain synthetic engine oil adoption can represent millions of dollars annually in maintenance savings — an economic case that is well established in North American and European premium fleet segments and progressively penetrating commercial fleet operations in Asia, Latin America, and the Middle East as fleet operators gain exposure to and confidence in synthetic lubricant performance data. The lubricant industry consequence of extended drain adoption is a volume-versus-value trade-off that has structurally characterized the market in North America and Europe for over a decade: total engine oil volume consumed per vehicle decreases as drain intervals extend, but the higher per-liter price of synthetic formulations compensates for volume reduction in revenue terms, with the net effect being relatively flat volume growth but sustained revenue growth in technically advanced markets where extended drain adoption is already widespread. In emerging markets where drain intervals remain shorter due to harder operating conditions, less sophisticated used oil analysis programs, and greater price sensitivity, the transition to extended drain synthetics represents a long-duration formulation upgrade opportunity that will progressively drive revenue growth above volume growth through the forecast period.
- Tightening Emissions Regulations Mandating Lubricant Chemistry Evolution and Premium Formulation Adoption: The world regulatory system on emission in heavy commercial vehicles is creating increasingly tougher restrictions on the engine-out concentration of nitrogen oxides (NOx), particulate matter (PM), hydrocarbons, and carbon monoxide – restrictions that fundamentally necessitate modifications in the engine design and lubricant chemistry, necessitating the The EPA and NHTSA Greenhouse Gas Emissions and Fuel Efficiency Standards of Medium- and Heavy-Duty Engines and Vehicles, including the Phase 2 standards that must take effect in 2021 and the stricter Phase 3 standards under development, and the California Air Resources Board (CARB) Advanced Clean Trucks regulations demanding the use of a zero-percent percentage of vehicles sold by truck manufacturers in 2 In 2017, the API CK-4 and FA-4 classes of engine oils were specifically developed to meet the lubricant compatibility requirements of advanced diesel oxidation catalysts (DOC), selective catalytic reduction (SCR) systems, and diesel particulate filters (DPF), which are being universal on North American The Euro VII emissions standard, whose final requirements set will cut off NOx and PM limits on heavy-duty diesel engines around the world like never before, now and will place a heavy burden on engine hardware, such as more complex EGR systems, increased dosing to SCR, and potentially the introduction of diesel particulate filter redesign, which will necessitate engine formulation upgrades corresponding to the current categories of ACEA E9 and E1 Asia China In Asia, the National VI emission standards introduced by China to apply to heavy-duty diesel vehicles in 2021 and the Bharat Stage VI standards implemented there in 2020 have required similar aftertreatment technology adoption in the populations of the two largest and fastest-growing commercial vehicle markets in the world, resulting in a demand for CJ-4/CK-4 level equivalent low-SAPS lubricant formulations across previously less regulated vehicle populations.
What are the Major Advances Changing the Heavy Commercial Vehicle Lubricants Market Today
- Extended Drain Interval Synthetic Lubricants Transforming Fleet Economics and Reducing Environmental Impact: The move toward fully synthetic and synthetic-blend formulations that allow the lubricant to maintain considerably longer drain intervals of 80,000150,000 kilometers or more depending on the type of engine, the conditions of use, and the result of lubricant used oil analysis programs the replacement of standard mineral oil-based heavy-duty diesel engine oils with a drain interval of 15,0002 Long-drain interval lubricants also offer fleet operators several cost-saving avenues, including, but not limited to, decreased maintenance labor costs due to less frequent gasoline changes every 3-6 months instead of every 4-6 weeks, higher prices per liter on synthetic lubricants offset by lower frequency of lubricant purchases; and decreased vehicle downtime by allowing another service to be performed to increase fleet utilization rates and lower operation costs. When senior long-haul fleet operators (with hundreds or thousands of trucks) switch to using extended drain synthetic engine oils, the overall cost of ownership savings may be millions of dollars a year in maintenance savings, which is an economic case that is already well established in the premium Fleet segments of North America and Europe and is increasingly being seen and adopted in commercial Fleet operations in Asia, Latin America and the Middle East as companies adopt the synthetic lubricant performance information.
- Natural Gas and Alternative Fuel Commercial Vehicles Creating Specialized Lubricant Market Segments:The growing penetration of compressed natural gas (CNG) and liquefied natural gas (LNG) powered heavy commercial vehicles — driven by lower fuel costs relative to diesel in markets with favorable natural gas pricing, government incentives targeting fleet decarbonization, and shipper sustainability requirements driving carrier fuel transition commitments — is creating specialized lubricant market requirements for natural gas engine oils that differ fundamentally from conventional diesel engine lubricant formulations. Natural gas engines operate at higher temperatures than equivalent diesel engines due to natural gas’s higher combustion temperature and the absence of fuel injection cooling effects, creating greater lubricant thermal stress and higher volatility requirements. Natural gas combustion produces no soot — unlike diesel combustion, which generates significant soot that disperses into the engine oil and influences viscosity, requiring detergent and dispersant additive packages optimized for soot handling — but generates higher concentrations of combustion by products including water and acidic species that impose different neutralization base reserve requirements on the lubricant. Additionally, CNG and LNG engines often use three-way catalyst (TWC) aftertreatment systems that are more sensitive to lubricant sulfur and phosphorus contributions than diesel SCR/DPF systems, driving formulation toward even lower SAPS specifications than current diesel categories. The major manufacturers of oils such as Shell (Shell Rimula Natural Gas), Castrol (heavy-duty oil for CNG engines), and Mobil (Delvac Natural Gas) have produced oils specifically for natural gas engines, and the growth of this niche market will be seen at a CAGR of 8.4% between 2026 and 2035 due to the increasing use of natural gas trucks in China, which boasts the largest number of CNG trucks worldwide with more than 700,000 units of heavy-duty CNG trucks, followed by the USA, Europe, and India. The introduction of biomethane (renewable natural gas) as fuel for carbon-neutral heavy-duty trucks is driving the addressable market for natural gas engine oils further.
- Digitalization of Fleet Lubrication Management Through Telematics and Used Oil Analysis Integration: The combination of vehicle telematics data with used oil analysis programs and predictive lubricant management algorithms is changing the way heavy commercial vehicles get their lubricant service. The new approach offers maximum protection to the engines along with the timing of the drain period according to actual conditions rather than according to time or mileage. The approach is advantageous to both fleet owners, who will see fewer engine breakdowns, and lubricant providers, who have alternative means of services for maintaining customer loyalty. Modern telematics systems for heavy commercial vehicles collect real-time data on engine temperature, load cycles, idle time, fuel consumption, braking events, and total operating hours. These are the factors that determine how quickly engine oil breaks down in service. For example, a truck that mostly drives on flat highways at moderate loads will break down engine oil 3–5 times faster per kilometer than a truck that mostly drives in high-load, high-temperature, mountainous terrain. Lubricant suppliers like Shell with its LubeAnalyst program, Castrol with its Labcheck used oil analysis service, and Fuchs with its OilDoc platform are now offering integrated telematics-linked lubricant management services. These services use sensors on board to measure oil viscosity, dielectric constant, and contamination levels, and they also do periodic laboratory used oil analyses of samples. This creates fleet-level dashboards that show the oil condition status of all vehicles and recommend maintenance when the oil condition data shows that the end of service life is near. The commercial model for these digital lubricant management services—usually bundled with lubricant supply contracts under fixed-price per-vehicle-per-year arrangements that transfer oil-related maintenance cost risk to the lubricant supplier—is becoming more popular with major fleet operators around the world. European long-haul operators and North American truckload carriers are the most advanced adopters, while Asian fleet operators are starting to look into these programs as fleet management becomes more sophisticated. The information these programs collect gives lubricant formulators access to real-world oil degradation data from a wide range of operating conditions. This makes it possible to develop and optimize additive packages more accurately, which improves the performance of the next generation of products compared to what laboratory testing alone can do.
Category Wise Insights
By Product Type
Why Do Engine Oils Lead the Heavy Commercial Vehicle Lubricants Market?
Engine oils will be the biggest type of product in 2025, bringing in about 48% of all market revenue. This dominance shows that diesel engine lubrication is the most important lubrication need for heavy commercial vehicles, as it is the need that occurs most often, in the largest volume, and is most critical for performance. Every diesel-powered heavy truck, bus, construction machine, and agricultural tractor needs regular oil changes, which make up the majority of both the lubricant volume consumed and the service event frequency across the global heavy commercial vehicle fleet. The average heavy-duty diesel truck engine displaces 10–15 liters, while a typical passenger car engine displaces 1.5–2.5 liters. In long-haul applications, the truck engine runs for 3,000–5,000 hours a year, uses engine oil at sump capacities of 30–60 liters, and needs to be replaced much more often than the annual intervals that are common for passenger car oil changes, even with extended drain synthetic formulations. In 2024, the global market for heavy-duty diesel engine oil used about 6.8 billion liters. Asia Pacific made up about 44% of the total, North America made up 22%, and Europe made up 21%. In the engine oil segment, the formulation mix varies greatly by region. Fully synthetic and synthetic blend formulations make up about 65% of the North American and European premium fleet segments, while mineral and semi-synthetic grades make up about 70% of the price-sensitive Asian and emerging market segments. This is a long-term upgrade opportunity that will generate above-market revenue growth in Asia through the forecast period as fleet management becomes more sophisticated and regulatory pressure increases.
By Vehicle Type
Why Do Trucks Dominate the Heavy Commercial Vehicle Lubricants Market?
In 2025, trucks will make up about 61% of the total market revenue. This is because they have the most fleets and use the most lubricants per vehicle among heavy commercial vehicle categories. The global fleet of heavy trucks, which includes about 58 million vehicles, is responsible for most of the demand for heavy commercial vehicle lubricants. Long-haul Class 8 trucks (those with a GVW of more than 15 tons) use the most lubricants per vehicle each year because they travel 150,000 to 250,000 kilometers per year, have large engine sumps that hold 30 to 60 liters of oil, and have multiple lubrication points in their drivetrains, such as tandem rear axles, fifth wheels, and multi-speed transmissions. The long-haul truck segment in North America, which includes Class 8 sleeper cab tractors that run 24-hour relay freight networks covering 150,000 to 200,000 miles a year, has the highest per-vehicle lubricant consumption intensity in the world and the most technically demanding performance environment for engine oil. This has led to the use of the most advanced synthetic lubricant formulations and extended drain programs among any heavy vehicle category.
By Sales Channel
Why Does the Aftermarket Dominate Sales Channel Revenue?
In 2025, the aftermarket sales channel will bring in about 54% of all market revenue. This is because of the basic economics of lubricant use over the lifetime of a vehicle: OEM factory fill is the first lubricant fill when a vehicle is built, but over the next 8–15 years of operation, the vehicle will use replacement lubricants at regular service intervals, which is 15–25 times the amount of lubricant used by OEM factory fill. This means that the majority of lifetime lubricant revenue will be in the aftermarket channel. Independent workshops and truck service centers, authorized dealer service networks, fleet maintenance facilities that do their own service, and retail stores that serve owner-operators and small fleet operators make up the aftermarket channel. In developing markets like India, Southeast Asia, and Latin America, the highly fragmented independent workshop network is the main way to get aftermarket lubricants. Workshop owners’ preferences, distributor relationships, and price sensitivity are what determine which brand of lubricant to buy, not the fleet-managed specification programs that are common in developed markets with large fleets. Fleet direct supply, in which lubricant suppliers sell directly to large fleet operators under annual supply contracts without going through distributors, makes up about 22% of market revenue and is growing as fleet operators combine their lubricant purchases to take advantage of volume pricing and standardize fluid specifications across multi-vehicle, multi-depot operations. OEM fill lubricants make up about 24% of the market’s revenue. Factory fill specifications are an important business battleground for lubricant suppliers because a lot of fleet operators who follow OEM service guidelines prefer aftermarket specifications that are OEM-recommended or factory-approved.
By End Use
Why Does Long-Haul Transportation Lead the End Use Segment?
Long-haul transportation will account for about 34% of total market revenue in 2025. This is because long-haul heavy trucks have the highest per-vehicle lubricant consumption intensity due to their maximum annual mileage accumulation, largest engine sump capacity, and full complement of transmission, axle, and fifth wheel lubrication points that are always in use. There is also a large and growing global installed base of long-haul heavy trucks that are needed to meet the demand for freight created by international trade and the intensification of domestic supply chains. Long-haul transportation is also the end use segment with the highest synthetic lubricant penetration, as fleet operators in this segment have the clearest economic case for extended drain synthetic adoption: at 200,000 kilometers annually, reducing oil change frequency from every 25,000 kilometers to every 80,000–100,000 kilometers represents a reduction from eight to two or three oil changes per truck per year, generating substantial maintenance labor and vehicle downtime savings that readily justify synthetic lubricant price premiums. Construction and mining account for about 24% of market revenue, making them the most lubricant-intensive end uses per operating hour. This is because construction equipment’s hydraulic systems use a lot of hydraulic fluid because of contamination, thermal stress, and the high-pressure hydraulic cycles that are common when excavators, loaders, and cranes work in tough site conditions.
Report Scope
| Feature of the Report | Details |
| Market Size in 2026 | USD 19.14 billion |
| Projected Market Size in 2035 | USD 28.76 billion |
| Market Size in 2025 | USD 18.32 billion |
| CAGR Growth Rate | 4.6% CAGR |
| Base Year | 2025 |
| Forecast Period | 2026-2035 |
| Key Segment | By Product Type, Vehicle Type, Sales Channel, End Use and Region |
| Report Coverage | Revenue Estimation and Forecast, Company Profile, Competitive Landscape, Growth Factors and Recent Trends |
| Regional Scope | North America, Europe, Asia Pacific, Middle East & Africa, and South & Central America |
| Buying Options | Request tailored purchasing options to fulfil your requirements for research. |
Regional Analysis
How Big is the Asia Pacific Market Size?
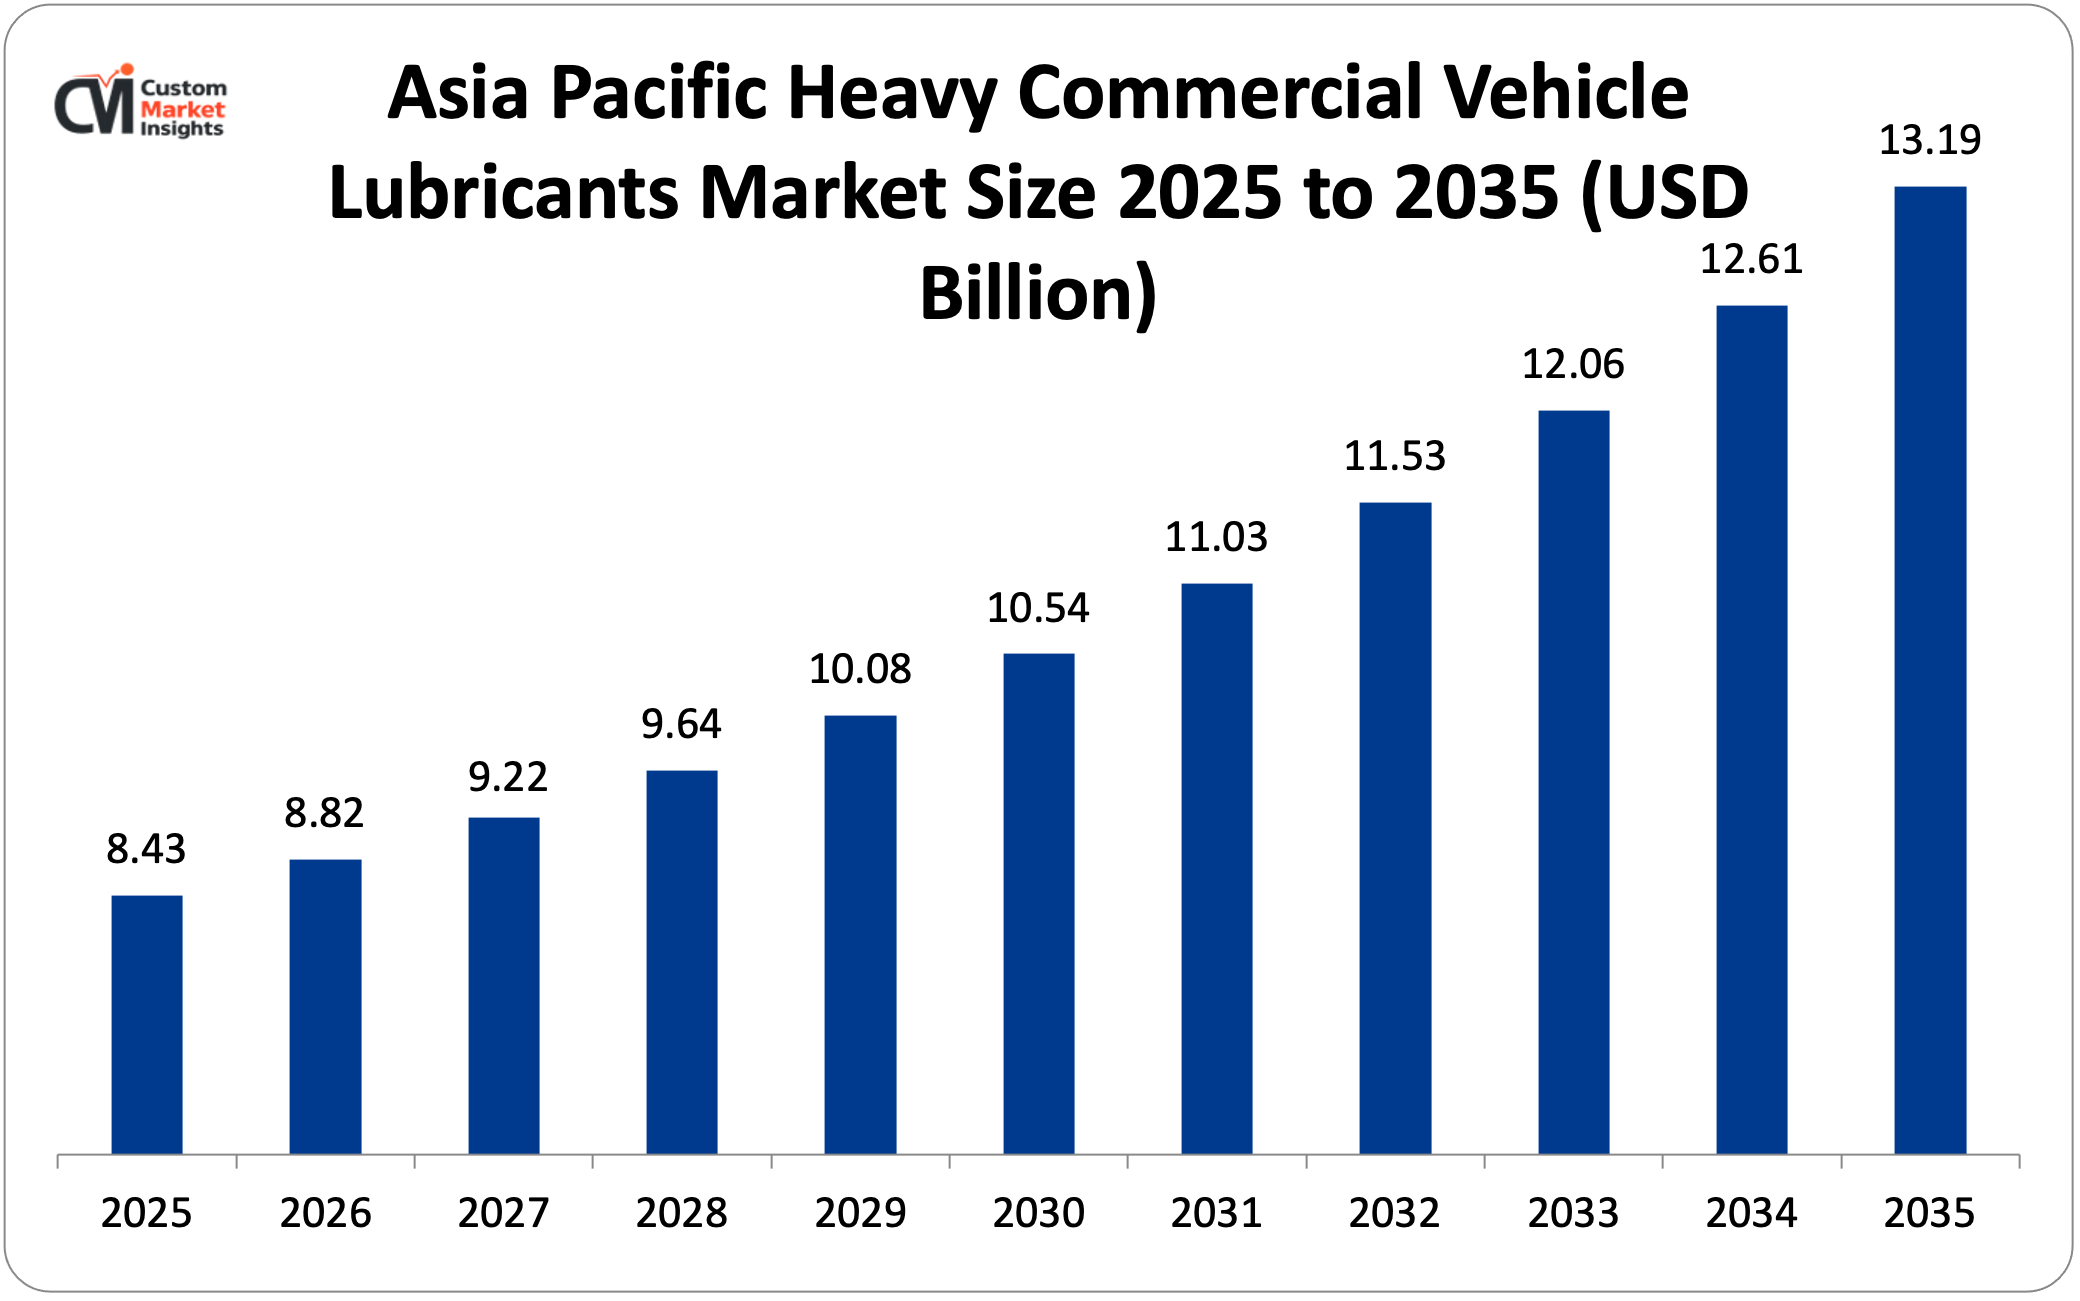
The Asia Pacific heavy commercial vehicle lubricants market size is estimated at USD 8.43 billion in 2025 and is projected to reach approximately USD 13.19 billion by 2035, growing at a CAGR of 4.6% from 2026 to 2035.
Why did Asia Pacific Dominate the Market in 2025?
In 2025, Asia Pacific will account for about 46% of the global heavy commercial vehicle lubricant market. This is because the region is the largest producer and operator of heavy commercial vehicles. For example, China has the world’s largest fleet of heavy trucks, with about 9.5 million units as of 2024. India’s fleet of 3.8 million heavy trucks is growing quickly because of the demand for freight from infrastructure investment and manufacturing expansion. Japan, South Korea, Australia, and Southeast Asian countries also have large fleets of commercial vehicles. China’s lubricant market for heavy commercial vehicles is the world’s largest by volume, with an estimated 2.4 billion liters sold each year across all product types. The Chinese market has some unique features, such as a high penetration of CNG trucks (making China’s natural gas engine oil market the world’s largest), a large population of construction vehicles that use hydraulic fluid and drivetrain lubricants in large infrastructure development programs, and a formulation mix that is still weighted toward mineral and semi-synthetic grades.
This means that premium lubricant suppliers have a big opportunity to upgrade their products over a long period of time as fleet operators modernize their maintenance practices. Japan and South Korea make a lot more money per liter of lubricant than their fleet sizes would suggest. This is because they have advanced formulation profiles—fully synthetic engine oils are the most popular type of lubricant in these markets—and because technically advanced products cost more in fleet operations where maintenance quality is important and total cost of ownership optimization is standard practice.
Why is Europe the Second-Largest and Most Technically Demanding Market?
In 2025, Europe will account for about 22% of the world’s market revenue, or about USD 4.03 billion. It will also have the highest average lubricant formulation quality and price per liter of any major regional market. This is due to a combination of strict Euro VI emission standards that require high-performance low-SAPS lubricant chemistry, advanced fleet management practices among European long-haul operators who collectively operate the world’s most technically advanced truck fleets, strong sustainability imperatives driving bio-based and recyclable lubricant adoption, and the regulatory framework of REACH restricting specific additive chemistries and creating formulation upgrade requirements for European-market lubricants.
Germany is the biggest market in Europe for heavy commercial vehicle lubricants. It is home to major truck manufacturers like Mercedes-Benz Trucks (Actros), MAN Truck & Bus, and Volkswagen Truck & Bus (Scania, MAN). Their OEM lubricant approval systems—Mercedes-Benz Approved MB 228.31/228.51/228.61, MAN M3277/M3575, and Scania Low SAPS—set the highest standards for engine oil in the world and the technical standards that lubricant suppliers must meet to sell to the European premium fleet market.
Why is North America Showing Moderate but Sustained Growth?
In 2025, North America will account for about 19% of the world’s market revenue. From 2026 to 2035, the market is expected to grow at a CAGR of 4.1%. This is because the market is mature but still changing, and revenue growth is driven more by formulation value migration—toward synthetic, natural gas-specific, and e-axle fluids at higher per-liter prices—than by fleet population growth. This is because the North American heavy truck fleet is growing at a relatively slow pace compared to fleets in Asia and other emerging markets.
Why is the Middle East & Africa Region an Emerging High-Growth Market?
In 2025, the LAMEA region will account for about 10% of global market revenue. However, from 2026 to 2035, it will grow at the fastest regional CAGR of 5.8%, thanks to several unique growth drivers in its sub-regions. The Gulf Cooperation Council countries, especially Saudi Arabia, the UAE, Kuwait, and Qatar, are running and growing large fleets of construction vehicles for Vision 2030 megaprojects, NEOM, and other national development programs. This creates a lot of demand for hydraulic fluid and engine oil because these projects require a lot of construction vehicles. In South Africa, Zambia, the Democratic Republic of Congo, and West African countries, mining activity is on the rise.
This includes the extraction of coal, gold, platinum, copper, and iron ore. These operations use large fleets of mining haul trucks, loaders, and drilling equipment that need lubricants to work properly. Mining is especially hard on lubricants because of the heavy loads, exposure to contaminants, and constant multi-shift operations that are common in open-pit and underground mining environments. Brazil leads Latin America in the heavy commercial vehicle lubricant market, which is large and growing slowly. This is because Brazil has a large network of roads that connect agricultural production areas with export ports, a large fleet of construction equipment that supports infrastructure investment, and a lot of agricultural machinery that uses tractor oils in Brazil’s large soy, corn, and sugar cane production areas.
Top Players in the Market and Their Offerings
- Shell plc
- ExxonMobil Corporation
- BP plc (Castrol)
- TotalEnergies SE
- Chevron Corporation
- Fuchs Petrolub SE
- Valvoline Inc.
- Petro-Canada Lubricants (HF Sinclair)
- Gulf Oil International
- Idemitsu Kosan Co. Ltd.
- Others
Key Developments
The market has undergone significant developments as industry participants seek to expand capabilities and enhance product portfolios.
- In March 2025: Shell plc announced the commercial launch of Shell Rimula R6 LME, a new ultra-low viscosity SAE 5W-20 fully synthetic heavy-duty diesel engine oil specifically engineered for next-generation fuel-efficient heavy truck engines operating under Euro VII and EPA Phase 3 equivalent emission standards, incorporating Shell’s proprietary DynafleX technology, delivering enhanced engine cleanliness, superior oxidation stability across extended drain intervals of up to 150,000 kilometers, and reduced internal engine friction contributing to verified fuel consumption improvements of 1.5–2.1% versus the prior generation Rimula R6 M product — directly addressing fleet operators’ dual imperatives of reducing fuel costs and meeting escalating environmental compliance requirements.
- In February 2025: ExxonMobil announced that it would be adding a new line of natural gas engine oils to its Mobil Delvac product line. Mobil Delvac NG 15W-40 and 10W-40 are specially formulated to serve heavy-duty diesel engines that use CNG and LNG fuels in long-haul and urban delivery routes. They offer enhanced thermal oxidative stability, a high base number that neutralizes combustion acids, and low copper corrosive additives compatible with valve seats of natural gas engines. These products are marketed to fast-growing fleets of CNG trucks owned by logistics service providers and local transportation agencies in China, India, and Europe.
These strategic actions have helped businesses improve their positions in the market, add new products to their portfolios that meet changing powertrain technology needs, create new lubricant formulations that meet stricter emission and fuel efficiency standards, and take advantage of growth opportunities created by the growth of natural gas truck fleets, the faster adoption of synthetic oils with longer drain times, and the gradual digitalization of fleet lubricant management in heavy commercial vehicle operating environments around the world.
The Heavy Commercial Vehicle Lubricants Market is segmented as follows:
By Product Type
- Engine Oils
- Monograde Engine Oils
- Multigrade Mineral Engine Oils
- Synthetic Blend Engine Oils
- Fully Synthetic Engine Oils
- Natural Gas Engine Oils
- Transmission Fluids
- Automatic Transmission Fluids (ATF)
- AMT-Specific Transmission Fluids
- Manual Transmission Fluids
- Gear Oils
- Axle & Differential Gear Oils
- Transfer Case Oils
- Final Drive Oils
- Hydraulic Fluids
- Mineral-Based Hydraulic Fluids
- Synthetic Hydraulic Fluids
- Environmentally Acceptable Hydraulic Fluids (EAH)
- Grease & Other Lubricants
- Chassis & Wheel Bearing Grease
- Multipurpose Grease
- Specialty Greases
By Vehicle Type
- Trucks
- Long-Haul Heavy Trucks (Class 8 / >15T GVW)
- Medium Heavy Trucks (Class 6–7 / 6–15T GVW)
- Vocational & Specialty Trucks
- Buses & Coaches
- City Transit Buses
- Intercity & Coach Buses
- School Buses
- Construction Vehicles
- Excavators & Loaders
- Dump Trucks & Articulated Haulers
- Cranes & Piling Equipment
- Agricultural Vehicles
- Tractors (High-Horsepower)
- Combine Harvesters
- Self-Propelled Sprayers
By Sales Channel
- OEM (Original Equipment Manufacturer)
- Aftermarket
- Independent Workshops & Dealers
- Fleet Service Centers
- Retail & Online Channels
- Fleet Direct
By End Use
- Long-Haul Transportation
- Construction & Mining
- Agriculture
- Public Transit
- Other End Uses
Regional Coverage:
North America
- U.S.
- Canada
- Mexico
- Rest of North America
Europe
- Germany
- France
- U.K.
- Russia
- Italy
- Spain
- Netherlands
- Rest of Europe
Asia Pacific
- China
- Japan
- India
- New Zealand
- Australia
- South Korea
- Taiwan
- Rest of Asia Pacific
The Middle East & Africa
- Saudi Arabia
- UAE
- Egypt
- Kuwait
- South Africa
- Rest of the Middle East & Africa
Latin America
- Brazil
- Argentina
- Rest of Latin America
Table of Contents
- Chapter 1. Report Introduction
- 1.1. Report Description
- 1.1.1. Purpose of the Report
- 1.1.2. USP & Key Offerings
- 1.2. Key Benefits For Stakeholders
- 1.3. Target Audience
- 1.4. Report Scope
- 1.1. Report Description
- Chapter 2. Market Overview
- 2.1. Report Scope (Segments And Key Players)
- 2.1.1. Heavy Commercial Vehicle Lubricants by Segments
- 2.1.2. Heavy Commercial Vehicle Lubricants by Region
- 2.2. Executive Summary
- 2.2.1. Market Size & Forecast
- 2.2.2. Heavy Commercial Vehicle Lubricants Market Attractiveness Analysis, By Product Type
- 2.2.3. Heavy Commercial Vehicle Lubricants Market Attractiveness Analysis, By Vehicle Type
- 2.2.4. Heavy Commercial Vehicle Lubricants Market Attractiveness Analysis, By Sales Channel
- 2.2.5. Heavy Commercial Vehicle Lubricants Market Attractiveness Analysis, By End Use
- 2.1. Report Scope (Segments And Key Players)
- Chapter 3. Market Dynamics (DRO)
- 3.1. Market Drivers
- 3.1.1. Sustained Global Freight Volume Growth and Commercial Vehicle Fleet Expansion Driving Structural Lubricant Demand
- 3.1.2. Tightening Emissions Regulations Mandating Lubricant Chemistry Evolution and Premium Formulation Adoption
- 3.2. Market Restraints
- 3.3. Market Opportunities
- 3.5. Pestle Analysis
- 3.6. Porter Forces Analysis
- 3.7. Technology Roadmap
- 3.8. Value Chain Analysis
- 3.9. Government Policy Impact Analysis
- 3.10. Pricing Analysis
- 3.1. Market Drivers
- Chapter 4. Heavy Commercial Vehicle Lubricants Market – By Product Type
- 4.1. Product Type Market Overview, By Product Type Segment
- 4.1.1. Heavy Commercial Vehicle Lubricants Market Revenue Share, By Product Type, 2025 & 2035
- 4.1.2. Engine Oils
- 4.1.2.1. Monograde Engine Oils
- 4.1.2.2. Multigrade Mineral Engine Oils
- 4.1.2.3. Synthetic Blend Engine Oils
- 4.1.2.4. Fully Synthetic Engine Oils
- 4.1.2.5. Natural Gas Engine Oils
- 4.1.3. Heavy Commercial Vehicle Lubricants Share Forecast, By Region (USD Billion)
- 4.1.4. Comparative Revenue Analysis, By Country, 2025 & 2035
- 4.1.5. Key Market Trends, Growth Factors, & Opportunities
- 4.1.6. Transmission Fluids
- 4.1.6.1. Automatic Transmission Fluids (ATF)
- 4.1.6.2. AMT-Specific Transmission Fluids
- 4.1.6.3. Manual Transmission Fluids
- 4.1.7. Heavy Commercial Vehicle Lubricants Share Forecast, By Region (USD Billion)
- 4.1.8. Comparative Revenue Analysis, By Country, 2025 & 2035
- 4.1.9. Key Market Trends, Growth Factors, & Opportunities
- 4.1.10. Gear Oils
- 4.1.10.1. Axle & Differential Gear Oils
- 4.1.10.2. Transfer Case Oils
- 4.1.10.3. Final Drive Oils
- 4.1.11. Heavy Commercial Vehicle Lubricants Share Forecast, By Region (USD Billion)
- 4.1.12. Comparative Revenue Analysis, By Country, 2025 & 2035
- 4.1.13. Key Market Trends, Growth Factors, & Opportunities
- 4.1.14. Hydraulic Fluids
- 4.1.14.1. Mineral-Based Hydraulic Fluids
- 4.1.14.2. Synthetic Hydraulic Fluids
- 4.1.14.3. Environmentally Acceptable Hydraulic Fluids (EAH)
- 4.1.15. Heavy Commercial Vehicle Lubricants Share Forecast, By Region (USD Billion)
- 4.1.16. Comparative Revenue Analysis, By Country, 2025 & 2035
- 4.1.17. Key Market Trends, Growth Factors, & Opportunities
- 4.1.18. Grease & Other Lubricants
- 4.1.18.1. Chassis & Wheel Bearing Grease
- 4.1.18.2. Multipurpose Grease
- 4.1.18.3. Specialty Greases
- 4.1.19. Heavy Commercial Vehicle Lubricants Share Forecast, By Region (USD Billion)
- 4.1.20. Comparative Revenue Analysis, By Country, 2025 & 2035
- 4.1.21. Key Market Trends, Growth Factors, & Opportunities
- 4.1. Product Type Market Overview, By Product Type Segment
- Chapter 5. Heavy Commercial Vehicle Lubricants Market – By Vehicle Type
- 5.1. Vehicle Type Market Overview, By Vehicle Type Segment
- 5.1.1. Heavy Commercial Vehicle Lubricants Market Revenue Share, By Vehicle Type, 2025 & 2035
- 5.1.2. Trucks
- 5.1.2.1. Long-Haul Heavy Trucks (Class 8 / >15T GVW)
- 5.1.2.2. Medium Heavy Trucks (Class 6–7 / 6–15T GVW)
- 5.1.2.3. Vocational & Specialty Trucks
- 5.1.3. Heavy Commercial Vehicle Lubricants Share Forecast, By Region (USD Billion)
- 5.1.4. Comparative Revenue Analysis, By Country, 2025 & 2035
- 5.1.5. Key Market Trends, Growth Factors, & Opportunities
- 5.1.6. Buses & Coaches
- 5.1.6.1. City Transit Buses
- 5.1.6.2. Intercity & Coach Buses
- 5.1.6.3. School Buses
- 5.1.7. Heavy Commercial Vehicle Lubricants Share Forecast, By Region (USD Billion)
- 5.1.8. Comparative Revenue Analysis, By Country, 2025 & 2035
- 5.1.9. Key Market Trends, Growth Factors, & Opportunities
- 5.1.10. Construction Vehicles
- 5.1.10.1. Excavators & Loaders
- 5.1.10.2. Dump Trucks & Articulated Haulers
- 5.1.10.3. Cranes & Piling Equipment
- 5.1.11. Heavy Commercial Vehicle Lubricants Share Forecast, By Region (USD Billion)
- 5.1.12. Comparative Revenue Analysis, By Country, 2025 & 2035
- 5.1.13. Key Market Trends, Growth Factors, & Opportunities
- 5.1.14. Agricultural Vehicles
- 5.1.14.1. Tractors (High-Horsepower)
- 5.1.14.2. Combine Harvesters
- 5.1.14.3. Self-Propelled Sprayers
- 5.1.15. Heavy Commercial Vehicle Lubricants Share Forecast, By Region (USD Billion)
- 5.1.16. Comparative Revenue Analysis, By Country, 2025 & 2035
- 5.1.17. Key Market Trends, Growth Factors, & Opportunities
- 5.1. Vehicle Type Market Overview, By Vehicle Type Segment
- Chapter 6. Heavy Commercial Vehicle Lubricants Market – By Sales Channel
- 6.1. Sales Channel Market Overview, By Sales Channel Segment
- 6.1.1. Heavy Commercial Vehicle Lubricants Market Revenue Share, By Sales Channel, 2025 & 2035
- 6.1.2. OEM (Original Equipment Manufacturer)
- 6.1.3. Heavy Commercial Vehicle Lubricants Share Forecast, By Region (USD Billion)
- 6.1.4. Comparative Revenue Analysis, By Country, 2025 & 2035
- 6.1.5. Key Market Trends, Growth Factors, & Opportunities
- 6.1.6. Aftermarket
- 6.1.6.1. Independent Workshops & Dealers
- 6.1.6.2. Fleet Service Centers
- 6.1.6.3. Retail & Online Channels
- 6.1.7. Heavy Commercial Vehicle Lubricants Share Forecast, By Region (USD Billion)
- 6.1.8. Comparative Revenue Analysis, By Country, 2025 & 2035
- 6.1.9. Key Market Trends, Growth Factors, & Opportunities
- 6.1.10. Fleet Direct
- 6.1.11. Heavy Commercial Vehicle Lubricants Share Forecast, By Region (USD Billion)
- 6.1.12. Comparative Revenue Analysis, By Country, 2025 & 2035
- 6.1.13. Key Market Trends, Growth Factors, & Opportunities
- 6.1. Sales Channel Market Overview, By Sales Channel Segment
- Chapter 7. Heavy Commercial Vehicle Lubricants Market – By End Use
- 7.1. End Use Market Overview, By End Use Segment
- 7.1.1. Heavy Commercial Vehicle Lubricants Market Revenue Share, By End Use, 2025 & 2035
- 7.1.2. Long-Haul Transportation
- 7.1.3. Heavy Commercial Vehicle Lubricants Share Forecast, By Region (USD Billion)
- 7.1.4. Comparative Revenue Analysis, By Country, 2025 & 2035
- 7.1.5. Key Market Trends, Growth Factors, & Opportunities
- 7.1.6. Construction & Mining
- 7.1.7. Heavy Commercial Vehicle Lubricants Share Forecast, By Region (USD Billion)
- 7.1.8. Comparative Revenue Analysis, By Country, 2025 & 2035
- 7.1.9. Key Market Trends, Growth Factors, & Opportunities
- 7.1.10. Agriculture
- 7.1.11. Heavy Commercial Vehicle Lubricants Share Forecast, By Region (USD Billion)
- 7.1.12. Comparative Revenue Analysis, By Country, 2025 & 2035
- 7.1.13. Key Market Trends, Growth Factors, & Opportunities
- 7.1.14. Public Transit
- 7.1.15. Heavy Commercial Vehicle Lubricants Share Forecast, By Region (USD Billion)
- 7.1.16. Comparative Revenue Analysis, By Country, 2025 & 2035
- 7.1.17. Key Market Trends, Growth Factors, & Opportunities
- 7.1.18. Other End Uses
- 7.1.19. Heavy Commercial Vehicle Lubricants Share Forecast, By Region (USD Billion)
- 7.1.20. Comparative Revenue Analysis, By Country, 2025 & 2035
- 7.1.21. Key Market Trends, Growth Factors, & Opportunities
- 7.1. End Use Market Overview, By End Use Segment
- Chapter 8. Heavy Commercial Vehicle Lubricants Market – Regional Analysis
- 8.1. Heavy Commercial Vehicle Lubricants Market Overview, By Region Segment
- 8.1.1. Global Heavy Commercial Vehicle Lubricants Market Revenue Share, By Region, 2025 & 2035
- 8.1.2. Global Heavy Commercial Vehicle Lubricants Market Revenue, By Region, 2026 – 2035 (USD Billion)
- 8.1.3. Global Heavy Commercial Vehicle Lubricants Market Revenue, By Product Type, 2026 – 2035
- 8.1.4. Global Heavy Commercial Vehicle Lubricants Market Revenue, By Vehicle Type, 2026 – 2035
- 8.1.5. Global Heavy Commercial Vehicle Lubricants Market Revenue, By Sales Channel, 2026 – 2035
- 8.1.6. Global Heavy Commercial Vehicle Lubricants Market Revenue, By End Use, 2026 – 2035
- 8.2. North America
- 8.2.1. North America Heavy Commercial Vehicle Lubricants Market Revenue, By Country, 2026 – 2035 (USD Billion)
- 8.2.2. North America Heavy Commercial Vehicle Lubricants Market Revenue, By Product Type, 2026 – 2035
- 8.2.3. North America Heavy Commercial Vehicle Lubricants Market Revenue, By Vehicle Type, 2026 – 2035
- 8.2.4. North America Heavy Commercial Vehicle Lubricants Market Revenue, By Sales Channel, 2026 – 2035
- 8.2.5. North America Heavy Commercial Vehicle Lubricants Market Revenue, By End Use, 2026 – 2035
- 8.2.6. U.S. Heavy Commercial Vehicle Lubricants Market Revenue, 2026 – 2035 (USD Billion)
- 8.2.7. Canada Heavy Commercial Vehicle Lubricants Market Revenue, 2026 – 2035 (USD Billion)
- 8.2.8. Mexico Heavy Commercial Vehicle Lubricants Market Revenue, 2026 – 2035 (USD Billion)
- 8.2.9. Rest of North America Heavy Commercial Vehicle Lubricants Market Revenue, 2026 – 2035 (USD Billion)
- 8.3. Europe
- 8.3.1. Europe Heavy Commercial Vehicle Lubricants Market Revenue, By Country, 2026 – 2035 (USD Billion)
- 8.3.2. Europe Heavy Commercial Vehicle Lubricants Market Revenue, By Product Type, 2026 – 2035
- 8.3.3. Europe Heavy Commercial Vehicle Lubricants Market Revenue, By Vehicle Type, 2026 – 2035
- 8.3.4. Europe Heavy Commercial Vehicle Lubricants Market Revenue, By Sales Channel, 2026 – 2035
- 8.3.5. Europe Heavy Commercial Vehicle Lubricants Market Revenue, By End Use, 2026 – 2035
- 8.3.6. Germany Heavy Commercial Vehicle Lubricants Market Revenue, 2026 – 2035 (USD Billion)
- 8.3.7. France Heavy Commercial Vehicle Lubricants Market Revenue, 2026 – 2035 (USD Billion)
- 8.3.8. U.K. Heavy Commercial Vehicle Lubricants Market Revenue, 2026 – 2035 (USD Billion)
- 8.3.9. Russia Heavy Commercial Vehicle Lubricants Market Revenue, 2026 – 2035 (USD Billion)
- 8.3.10. Italy Heavy Commercial Vehicle Lubricants Market Revenue, 2026 – 2035 (USD Billion)
- 8.3.11. Spain Heavy Commercial Vehicle Lubricants Market Revenue, 2026 – 2035 (USD Billion)
- 8.3.12. Netherlands Heavy Commercial Vehicle Lubricants Market Revenue, 2026 – 2035 (USD Billion)
- 8.3.13. Rest of Europe Heavy Commercial Vehicle Lubricants Market Revenue, 2026 – 2035 (USD Billion)
- 8.4. Asia Pacific
- 8.4.1. Asia Pacific Heavy Commercial Vehicle Lubricants Market Revenue, By Country, 2026 – 2035 (USD Billion)
- 8.4.2. Asia Pacific Heavy Commercial Vehicle Lubricants Market Revenue, By Product Type, 2026 – 2035
- 8.4.3. Asia Pacific Heavy Commercial Vehicle Lubricants Market Revenue, By Vehicle Type, 2026 – 2035
- 8.4.4. Asia Pacific Heavy Commercial Vehicle Lubricants Market Revenue, By Sales Channel, 2026 – 2035
- 8.4.5. Asia Pacific Heavy Commercial Vehicle Lubricants Market Revenue, By End Use, 2026 – 2035
- 8.4.6. China Heavy Commercial Vehicle Lubricants Market Revenue, 2026 – 2035 (USD Billion)
- 8.4.7. Japan Heavy Commercial Vehicle Lubricants Market Revenue, 2026 – 2035 (USD Billion)
- 8.4.8. India Heavy Commercial Vehicle Lubricants Market Revenue, 2026 – 2035 (USD Billion)
- 8.4.9. New Zealand Heavy Commercial Vehicle Lubricants Market Revenue, 2026 – 2035 (USD Billion)
- 8.4.10. Australia Heavy Commercial Vehicle Lubricants Market Revenue, 2026 – 2035 (USD Billion)
- 8.4.11. South Korea Heavy Commercial Vehicle Lubricants Market Revenue, 2026 – 2035 (USD Billion)
- 8.4.12. Taiwan Heavy Commercial Vehicle Lubricants Market Revenue, 2026 – 2035 (USD Billion)
- 8.4.13. Rest of Asia Pacific Heavy Commercial Vehicle Lubricants Market Revenue, 2026 – 2035 (USD Billion)
- 8.5. The Middle-East and Africa
- 8.5.1. The Middle-East and Africa Heavy Commercial Vehicle Lubricants Market Revenue, By Country, 2026 – 2035 (USD Billion)
- 8.5.2. The Middle-East and Africa Heavy Commercial Vehicle Lubricants Market Revenue, By Product Type, 2026 – 2035
- 8.5.3. The Middle-East and Africa Heavy Commercial Vehicle Lubricants Market Revenue, By Vehicle Type, 2026 – 2035
- 8.5.4. The Middle-East and Africa Heavy Commercial Vehicle Lubricants Market Revenue, By Sales Channel, 2026 – 2035
- 8.5.5. The Middle-East and Africa Heavy Commercial Vehicle Lubricants Market Revenue, By End Use, 2026 – 2035
- 8.5.6. Saudi Arabia Heavy Commercial Vehicle Lubricants Market Revenue, 2026 – 2035 (USD Billion)
- 8.5.7. UAE Heavy Commercial Vehicle Lubricants Market Revenue, 2026 – 2035 (USD Billion)
- 8.5.8. Egypt Heavy Commercial Vehicle Lubricants Market Revenue, 2026 – 2035 (USD Billion)
- 8.5.9. Kuwait Heavy Commercial Vehicle Lubricants Market Revenue, 2026 – 2035 (USD Billion)
- 8.5.10. South Africa Heavy Commercial Vehicle Lubricants Market Revenue, 2026 – 2035 (USD Billion)
- 8.5.11. Rest of the Middle East & Africa Heavy Commercial Vehicle Lubricants Market Revenue, 2026 – 2035 (USD Billion)
- 8.6. Latin America
- 8.6.1. Latin America Heavy Commercial Vehicle Lubricants Market Revenue, By Country, 2026 – 2035 (USD Billion)
- 8.6.2. Latin America Heavy Commercial Vehicle Lubricants Market Revenue, By Product Type, 2026 – 2035
- 8.6.3. Latin America Heavy Commercial Vehicle Lubricants Market Revenue, By Vehicle Type, 2026 – 2035
- 8.6.4. Latin America Heavy Commercial Vehicle Lubricants Market Revenue, By Sales Channel, 2026 – 2035
- 8.6.5. Latin America Heavy Commercial Vehicle Lubricants Market Revenue, By End Use, 2026 – 2035
- 8.6.6. Brazil Heavy Commercial Vehicle Lubricants Market Revenue, 2026 – 2035 (USD Billion)
- 8.6.7. Argentina Heavy Commercial Vehicle Lubricants Market Revenue, 2026 – 2035 (USD Billion)
- 8.6.8. Rest of Latin America Heavy Commercial Vehicle Lubricants Market Revenue, 2026 – 2035 (USD Billion)
- 8.1. Heavy Commercial Vehicle Lubricants Market Overview, By Region Segment
- Chapter 9. Competitive Landscape
- 9.1. Company Market Share Analysis – 2025
- 9.1.1. Global Heavy Commercial Vehicle Lubricants Market: Company Market Share, 2025
- 9.2. Global Heavy Commercial Vehicle Lubricants Market Company Market Share, 2024
- 9.1. Company Market Share Analysis – 2025
- Chapter 10. Company Profiles
- 10.1. Shell plc
- 10.1.1. Company Overview
- 10.1.2. Key Executives
- 10.1.3. Product Portfolio
- 10.1.4. Financial Overview
- 10.1.5. Operating Business Segments
- 10.1.6. Business Performance
- 10.1.7. Recent Developments
- 10.2. ExxonMobil Corporation
- 10.3. BP plc (Castrol)
- 10.4. TotalEnergies SE
- 10.5. Chevron Corporation
- 10.6. Fuchs Petrolub SE
- 10.7. Valvoline Inc.
- 10.8. Petro-Canada Lubricants (HF Sinclair)
- 10.9. Gulf Oil International
- 10.10. Idemitsu Kosan Co. Ltd.
- 10.11. Others.
- 10.1. Shell plc
- Chapter 11. Research Methodology
- 11.1. Research Methodology
- 11.2. Secondary Research
- 11.3. Primary Research
- 11.3.1. Analyst Tools and Models
- 11.4. Research Limitations
- 11.5. Assumptions
- 11.6. Insights From Primary Respondents
- 11.7. Why Healthcare Foresights
- Chapter 12. Standard Report Commercials & Add-Ons
- 12.1. Customization Options
- 12.2. Subscription Module For Market Research Reports
- 12.3. Client Testimonials
- Chapter 13. List Of Figures
- 13.1. Figures No 1 to 67
- Chapter 14. List Of Tables
- 14.1. Tables No 1 to 51
Prominent Player
- Shell plc
- ExxonMobil Corporation
- BP plc (Castrol)
- TotalEnergies SE
- Chevron Corporation
- Fuchs Petrolub SE
- Valvoline Inc.
- Petro-Canada Lubricants (HF Sinclair)
- Gulf Oil International
- Idemitsu Kosan Co. Ltd.
- Others
FAQs
The key players in the market are Shell plc, ExxonMobil Corporation, BP plc (Castrol), TotalEnergies SE, Chevron Corporation, Fuchs Petrolub SE, Valvoline Inc., Petro-Canada Lubricants (HF Sinclair), Gulf Oil International, Idemitsu Kosan Co. Ltd., Others.
Government regulations have the biggest and most far-reaching effect on the heavy commercial vehicle lubricant market of any outside factor. They do this through a number of different regulatory mechanisms that together affect product formulation requirements, fleet purchasing decisions, and sales channel dynamics. Emission standards in North America (EPA and CARB), Europe (Euro VI and Euro VII), China (China National VI), and India (Bharat Stage VI) require exhaust aftertreatment systems. These systems’ catalyst and particulate filter components have specific compatibility requirements for engine oil formulations, which means that low-SAPS chemistry is required for all new vehicles. This leads to API and ACEA specification changes that require fleet-wide lubricant upgrades. Fuel economy and greenhouse gas emission standards, such as those in the U.S. The EPA Phase 2 GHG rules, the EU CO₂ standards for heavy-duty vehicles that will go into effect in 2025 and get stricter through 2030, and China’s fuel consumption limits for heavy trucks are all making engines smaller, increasing combustion pressures, and using waste heat recovery technologies that put more stress on lubricants. At the same time, these rules are encouraging the use of lower-viscosity synthetic formulations that reduce internal friction and improve fuel efficiency. Vehicle safety and maintenance rules that require regular inspections and service intervals set minimum lubricant replacement frequency requirements for all commercial vehicle fleets. This means that there is a regulatory floor demand for replacement lubricants, regardless of fleet operator cost-cutting incentives. Environmental rules for getting rid of lubricants, such as EU waste oil rules that require collection and re-refining, and similar rules in Japan, South Korea, and Australia, create costs for handling and getting rid of lubricants that encourage fleet operators to use extended drain lubricants to cut down on how often and how much they have to throw away.
Heavy commercial vehicle lubricants have very different prices depending on their formulation grades and performance categories. For example, fully synthetic heavy-duty diesel engine oils cost between USD 12 and 22 per liter in North America and Europe, while mineral multigrade oils cost between USD 4 and 8 per liter in Asian emerging markets. This price difference is due to both the quality of the formulation and the economic premium that comes with longer drain intervals and better engine protection, which lowers the total cost of ownership for fleet operators who are willing and able to pay for premium lubricants. The synthetic engine oil which is approved by the OEM and used in the Euro VI engines made by manufacturers such as Mercedes-Benz, MAN, Volvo, or Scania is the most expensive one at around USD 16-28 per liter in Europe. This is due to the high cost of manufacturing them according to OEM approval criteria, plus there is high demand for them. Economy mineral multigrade engine oils for older vehicles in developing markets, on the other hand, cost between USD 2.00 and 4.00 per liter. Price is the most important factor for owner-operators and small fleet operators who don’t have the maintenance knowledge to figure out the total cost of ownership. Natural gas engine oils cost 15–25% more than diesel engine oils of the same viscosity grade because they need special formulations. E-axle fluids, on the other hand, cost a lot more—USD 20–45 per liter—because there aren’t many suppliers and the electric commercial vehicle market is still new.
The market is expected to reach about USD 28.76 billion by 2035, according to current analyses. This is because the global commercial vehicle fleet is growing at a rate that matches the growth in freight demand, the formulation mix is shifting from mineral to synthetic engine oils, which raises average selling prices in Asian and Latin American markets, the natural gas engine oil segment is growing at a rate of 8.4% CAGR as CNG and LNG truck penetration grows worldwide, the demand for transmission fluid is growing at a rate of 5.8% CAGR as AMT adoption grows, e-axle fluids are becoming a premium growth sub-segment as electric truck fleets grow, and digital lubricant management service revenues are adding to product supply revenues in premium fleet markets at a rate of 4.6% CAGR from 2026 to 2035.
Asia Pacific is expected to keep the biggest share of revenue throughout the forecast period, growing from 46% in 2025 to about 48% by 2035. This is because the Chinese and Indian commercial vehicle fleets are still growing, the average revenue per liter is going up as mineral grades are replaced with synthetic grades across Asian markets, China has the world’s largest CNG truck fleet, which creates demand for specialized natural gas engine oil, and infrastructure megaprojects across the region create demand for construction equipment lubricants. Europe will continue to be the world leader in the technical sophistication of lubricant formulation, keeping prices high per liter across its heavy commercial vehicle lubricant market, which means that it will make more money than its fleet size would suggest.
The LAMEA region is expected to grow at the fastest CAGR of 5.8% from 2026 to 2035. This is because of the demand for Gulf Cooperation Council construction equipment lubricants from Vision 2030 megaprojects, the demand for mining fleet lubricants in Sub-Saharan Africa as mineral extraction activity grows, Brazil’s large market for automotive and agricultural vehicle lubricants, and the overall growth of emerging market commercial vehicle fleets in regions where vehicle population growth rates are much higher than those in mature North American and European markets. India is the fastest-growing individual national market in the Asia Pacific region, with a projected CAGR of 6.3%. This is because of the growing demand for freight due to infrastructure investment, manufacturing growth, and the modernization of agricultural logistics, which is increasing the size of India’s heavy truck fleet faster than any other major economy in the world.
The Global Heavy Commercial Vehicle Lubricants Market is predicted to experience sustained growth driven by the global road freight market valued at approximately USD 4.3 trillion in 2024 and growing at 4.8% CAGR generating proportionate commercial vehicle fleet expansion; India’s heavy truck fleet projected to grow from 3.8 million units in 2024 to over 5.5 million by 2030 representing one of the most dynamic individual market growth vectors globally; China operating the world’s largest CNG truck fleet of over 700,000 units driving natural gas engine oil demand growing at 8.4% CAGR; Euro VII emission standard implementation from 2027–2028 mandating formulation upgrades across European heavy-duty engine oil categories; AMT transmission adoption across Chinese, Indian, and European heavy trucks driving transmission fluid segment growth at the fastest product type CAGR of 5.8%; e-axle fluid demand growing at approximately 22.3% CAGR as electric truck penetration increases in urban logistics applications; and digital fleet lubricant management platforms enabling extended drain intervals and creating service-based revenue streams that differentiate premium lubricant suppliers in increasingly competitive fleet supply markets.