Infrastructure as a Service Market Size, Trends and Insights By Type (Storage, Disaster Recovery, Compute, Desktop, Network, Others), By Deployment Model (Private, Public, Hybrid), By Enterprise Size (Large Enterprises, SMEs), By Vertical (IT & Telecom, Banking, Financial Services, and Insurance (BFSI), Healthcare, Government & Defense, Retail and E-commerce, Manufacturing, Energy & Utilities, Others), and By Region – Global Industry Overview, Statistical Data, Competitive Analysis, Share, Outlook, and Forecast 2026 – 2035
Report Snapshot
CAGR: 25.4%
| Study Period: | 2026-2035 |
| Fastest Growing Market: | Asia Pacific |
| Largest Market: | North America |
Major Players
- Red Hat Inc.
- Google Inc.
- IBM Corporation
- Microsoft Corporation
- Others
Reports Description
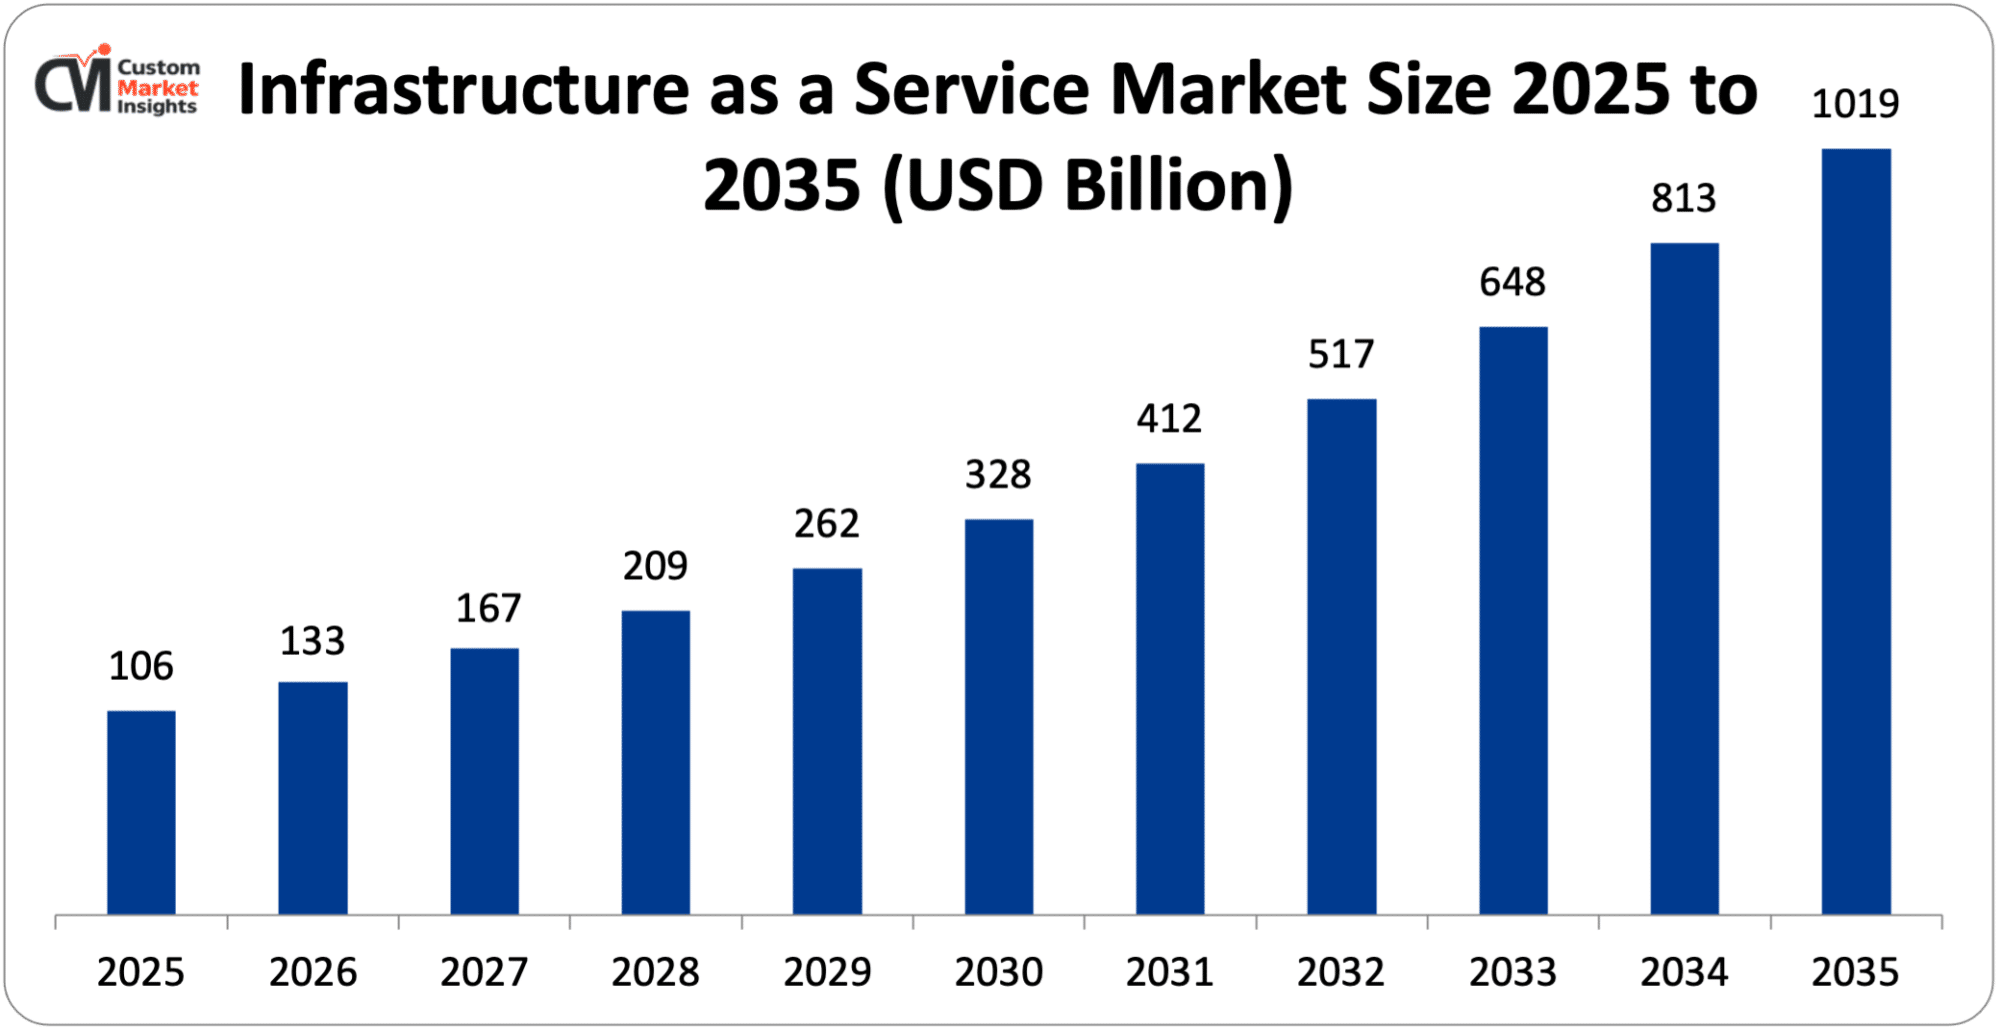
The market size of global infrastructure as a service will be estimated at USD 106 billion in 2025 and is expected to grow to between USD 133 billion in 2026 and about USD 1019 billion by 2035, with a current CAGR (compound annual growth rate) of 25.4% during the period of 2026 to 2035. Infrastructure as a service (IaaS) is the most flexible of the cloud services. Users are provided with virtualized hardware such as networks, storage, and servers over the internet. Users then pay for what they use.
This is opposed to corporate resources or hardware being purchased and linked together, which they maintain themselves and sometimes have underutilized. Amazon Web Services, Microsoft Azure, and Google Cloud Platform are a few of a plethora of providers that offer IaaS. This form is used for many different applications, such as hosting websites, storage and backup of data, and even application development environments.
Market Highlight
- In 2025, North America will dominate the global market with an estimated market share of 38%. The presence of major players and technological innovation drives the market growth.
- The Asia Pacific is growing at the highest rate over the analysis period. The increasing government initiative drives the regional growth.
- By type, the compute segment dominated the industry in 2025.
- By deployment model, the hybrid segment would have the highest share of the market in 2025.
- By enterprise size, the large enterprises segment would have the highest share of the market in 2025.
- By vertical, the IT & Telecom segment would have the highest share of the market in 2025.
Significant Growth Factors
The infrastructure as a service market trends present significant growth opportunities due to several factors:
- Remote Work & Digital Services Expansion: The ever-expanding use of digital services and growing popularity of remote work are equally driving investments for Infrastructure as a Service (IaaS). As digital services consume more and more daily life and consumers require elastic scalability and service level services, cloud services are replacing physical on-premise infrastructure. Secure, scalable, ubiquitous access to computing power enables the traditionally geographically disparate and always-on workforce to replace expensive on-site infrastructure with a cloud solution by major providers like AWS, Azure, and Google Cloud Platform. As digital services like e-Commerce, online banking, streaming, telemedicine, and SaaS applications grow quickly, there is a rising need for strong computing power and reliable service, which is often provided through elastic scalability that helps organizations handle varying amounts of traffic and data.
- Increasing Startup Ecosystem: The rise of the startup ecosystem is a key factor that is adding to the growth of the Infrastructure as a Service (IaaS) market, and this is supported by many statistics and initiatives undertaken by the government. It is seen that the government, globally and in emerging economies like India, is encouraging the startup ecosystem through many initiatives, which is directly adding to the demand for the IaaS market. Under the ‘Startup India’ initiative, the number of officially recognized startups by the Department for Promotion of Industry and Internal Trade (DPIIT) has increased exponentially, rising to over 197,000 by the year 2025, compared to just around 500 startups in the year 2016. This number has now crossed the 200,000 marks recently. Additionally, the startups together have created more than 16.6 lakh direct jobs, which shows the impact of the startup ecosystem. Further, more than 73,000 startups have at least one woman director, and many startups are emerging out of Tier-II and Tier-III cities. This is showing the increasing diversification of the startup ecosystem. This is directly adding to the demand for the IaaS market because startups are avoiding capital investment in infrastructure and are choosing the cloud infrastructure of Amazon Web Services, Microsoft Azure, and Google Cloud Platform to get computing infrastructure at affordable rates. Startups, especially those operating in the fintech, ed-tech, AI, and e-commerce sectors, need infrastructure that is flexible enough to support the rapid development and testing of their applications. Moreover, the initiatives taken by the government are also adding to the demand for the IaaS market because the government is providing tax benefits and is encouraging the startup ecosystem through many initiatives, which is indirectly adding to the demand for the IaaS market. As the number of startups is increasing globally and regionally, the demand for the IaaS market is also increasing.
What are the Major Advances Changing the Infrastructure as a Service Market Today?
- AI and Machine Learning Integration: AI and Machine Learning Integration has emerged as one of the major improvements in the IaaS industry, drastically bringing about revolutionary change in the way cloud infrastructures are configured and run. Today’s IaaS industry is witnessing the evolution of intelligent and automated cloud infrastructures by integrating AI-based capabilities, wherein infrastructures are designed for dynamic provisioning of resources based on consumption patterns, detecting anomalies, and performing optimization tasks without human intervention. In the case of product innovations, IaaS service providers are offering services like Amazon Compute Optimizer, a predictive auto-scaling wherein machine learning is used to optimize resource utilization. Microsoft Azure’s investments in Azure Advisor and Azure Automanage are similar examples of applications leveraging machine learning capabilities to improve the performance of infrastructures. Use of special hardware for AI services such as Graphic processing units (GPUs), tensor processing units (TPUs), and AI accelerators is another significant trend in the IaaS industry. Improving cloud security through sophisticated threat detection mechanisms and automated workflows driven by AI is yet another characteristic feature of today’s IaaS industry.
- Rise of Edge Computing: The concept of edge computing is a major technological breakthrough causing a lot of disruption in the IaaS market. This approach processes data at the edge rather than relying on traditional cloud data centers, where computing processes are centralized. Local edge node processing results in lower latency, better real-time data processing, and optimized application performance. Edge is critical to the Internet of Things, autonomous vehicles, smart cities, and industrial internet related use cases. Some of the world’s largest cloud vendors (AWS, MS Azure, and Google Cloud) are rapidly merging their IaaS capabilities into the edges by adopting distributed infrastructure and deploying edge zones. This gives the opportunity to deploy Latency sensitive and real-time applications at the edge closer to users, while still benefiting from Amazon’s huge infrastructure, innovation, and pay-as-you-go model. In a similar trend, the extension of 5G connections and the large volume of connected devices are rapidly increasing edge computing adoption.
Category Wise Insights
By Type
Why Compute Hold a Prominent Position in the Market?
The compute segment dominated the industry in 2025. Enterprises are rapidly demanding scalable, high-performance compute services for a wide range of use cases. Majority of enterprise workloads are shifting from traditional on-premise infrastructure to cloud-based compute services provided by other market leaders like Amazon Web Services, Microsoft Azure, Google Cloud platform etc., that provide virtual machines, containers, and serverless compute on a just-in-time basis. Market is also witnessing a rapid increase in demand for cloud-based compute servers as AI/ML, Big data applications, and high-performance compute (HPC) workloads are being widely adopted by the enterprise customers who need flexible and high-performance compute infrastructure. The COVID-19 pandemic resulted in a sharp focus on digital services, home working, and online applications, which further increased the deployment of cloud-based compute resources to meet growing demand for performance & availability as well as reduce CAPEX by means of pay-as-you-go computing. The utility of GPU- and TPU-based instances, infrastructure automation, and auto-scaling also increased this segment‘s revenue.
The storage segment is growing at the highest CAGR during the forecast period. The shift towards the use of backup, disaster recovery, and data archiving solutions in the cloud is helping the revenue growth as companies are now looking for data resiliency and business continuity above all. With flexible pay-as-you-go prices and developments like object storage, tiered storage, and better data security, large organizations and start-ups are being lured to move their systems to cloud-based storage systems, thus helping increase the storage segment of the IaaS market.
By Deployment Model
Why Hybrid Capture the Highest Market Share in the Infrastructure as a Service Market?
The hybrid segment would have the highest share of the market in 2025. Enterprises interested in digital transformation want to begin switching to hybrid models, which allow them to move legacy systems between two domains during a period of application modernization in the cloud. Improvements in cloud interoperability, containerization, and consistent management platforms are becoming less complex so organizations can more easily adopt hybrid environments and continue to contribute to revenue growth. As organizations put more importance on agility, resilience, and cost savings of running applications, the hybrid cloud segment will continue to be an important driver of growth in the IaaS space.
The private segment is growing at a steady rate over the projected period. Private clouds have been introduced in enterprises using legacy systems. Enterprises can migrate one workload at a time onto a private cloud while gradually retiring legacy platforms rather than doing a big-bang migration to the public cloud. Improvements in virtualization, automation, and software-defined infrastructure are also making private cloud deployment more efficient and manageable, thus further contributing to private clouds’ revenue growth in the IaaS market.
By Enterprise Size
What Factor Causes Large Enterprises to Have a Dominant Position in the Market?
The large enterprises segment would have the highest share of the market in 2025. Large enterprises produce huge amounts of data and have requirements for HPC, storage, and networking, which IaaS cloud platforms can provide as needed. Growing trend among large enterprises towards leveraging newer technologies such as big data & analytics, ERP and others is providing impetus for higher adoption of Cloud & IaaS platforms. Hybrid clouds and multi-cloud approaches are also gaining popularity among enterprises, as deployments can be made cost-effective, enable business continuity, and avoid vendor lock-in. Growing importance of digital transformation initiatives, better security, compliance, and disaster recovery offerings are also contributing to faster adoption of IaaS for large enterprises.
The SMEs segment is growing at a rapid rate over the projected period. The increasing trend of digitalization of SMEs (e.g. E-commerce, FinTech, online business, and others) in a growing number is projected to drive enormous demand for reliable, scalable IaaS platforms. Additionally, the availability of easy-to-use tools for cloud management, the growing penetration of the internet, government initiatives encouraging small business digitalization, and other factors such as economic growth are expected to increase the adoption of IaaS. IaaS enables a brisk business scale and effective competition with bigger players, increasing revenue of this IaaS market segment.
By Vertical
What Factor Causes IT & Telecom to Have a Dominant Position in the Market?
The IT & Telecom segment would have the highest share of the market in 2025. Telecoms are adopting cloud-centric technologies like network function virtualization (NFV) and software-defined networking (SDN) to gain efficiencies and lower platform operational expenses. The rapid growth in availability of streaming, cloud communications, and real-time applications and analytics is creating an additional imperative for scale-out compute and storage infrastructure. As technology companies and telecoms evolve their infrastructure and deliver more digital services, the scalability, elasticity, and value-per-dollar of IaaS are enabling continued revenue expansion, as well, among tech-communications providers.
The healthcare segment is growing at a rapid rate over the projected period. The burgeoning of telemedicine, remote patient monitoring, and digital health has also created a need for secure, reliable, scalable, and flexible healthcare cloud infrastructure. Furthermore, breakthroughs in data analytics, artificial intelligence, and genomic research are all highly processor- and memory-intensive and can be delivered by Infrastructure as a Service (IaaS) very effectively. Achieving more scientific breakthroughs and innovations, while tighter regulation in terms of security and privacy is driving a dramatic migration to compliant, secure clouds.
Report Scope
| Feature of the Report | Details |
| Market Size in 2026 | USD 133 billion |
| Projected Market Size in 2035 | USD 1019 billion |
| Market Size in 2025 | USD 106 billion |
| CAGR Growth Rate | 25.4% CAGR |
| Base Year | 2025 |
| Forecast Period | 2026-2035 |
| Key Segment | By Type, Deployment Model, Enterprise Size, Vertical and Region |
| Report Coverage | Revenue Estimation and Forecast, Company Profile, Competitive Landscape, Growth Factors and Recent Trends |
| Regional Scope | North America, Europe, Asia Pacific, Middle East & Africa, and South & Central America |
| Buying Options | Request tailored purchasing options to fulfil your requirements for research. |
Regional Analysis
How Big is North America Infrastructure as a Service Market Size?
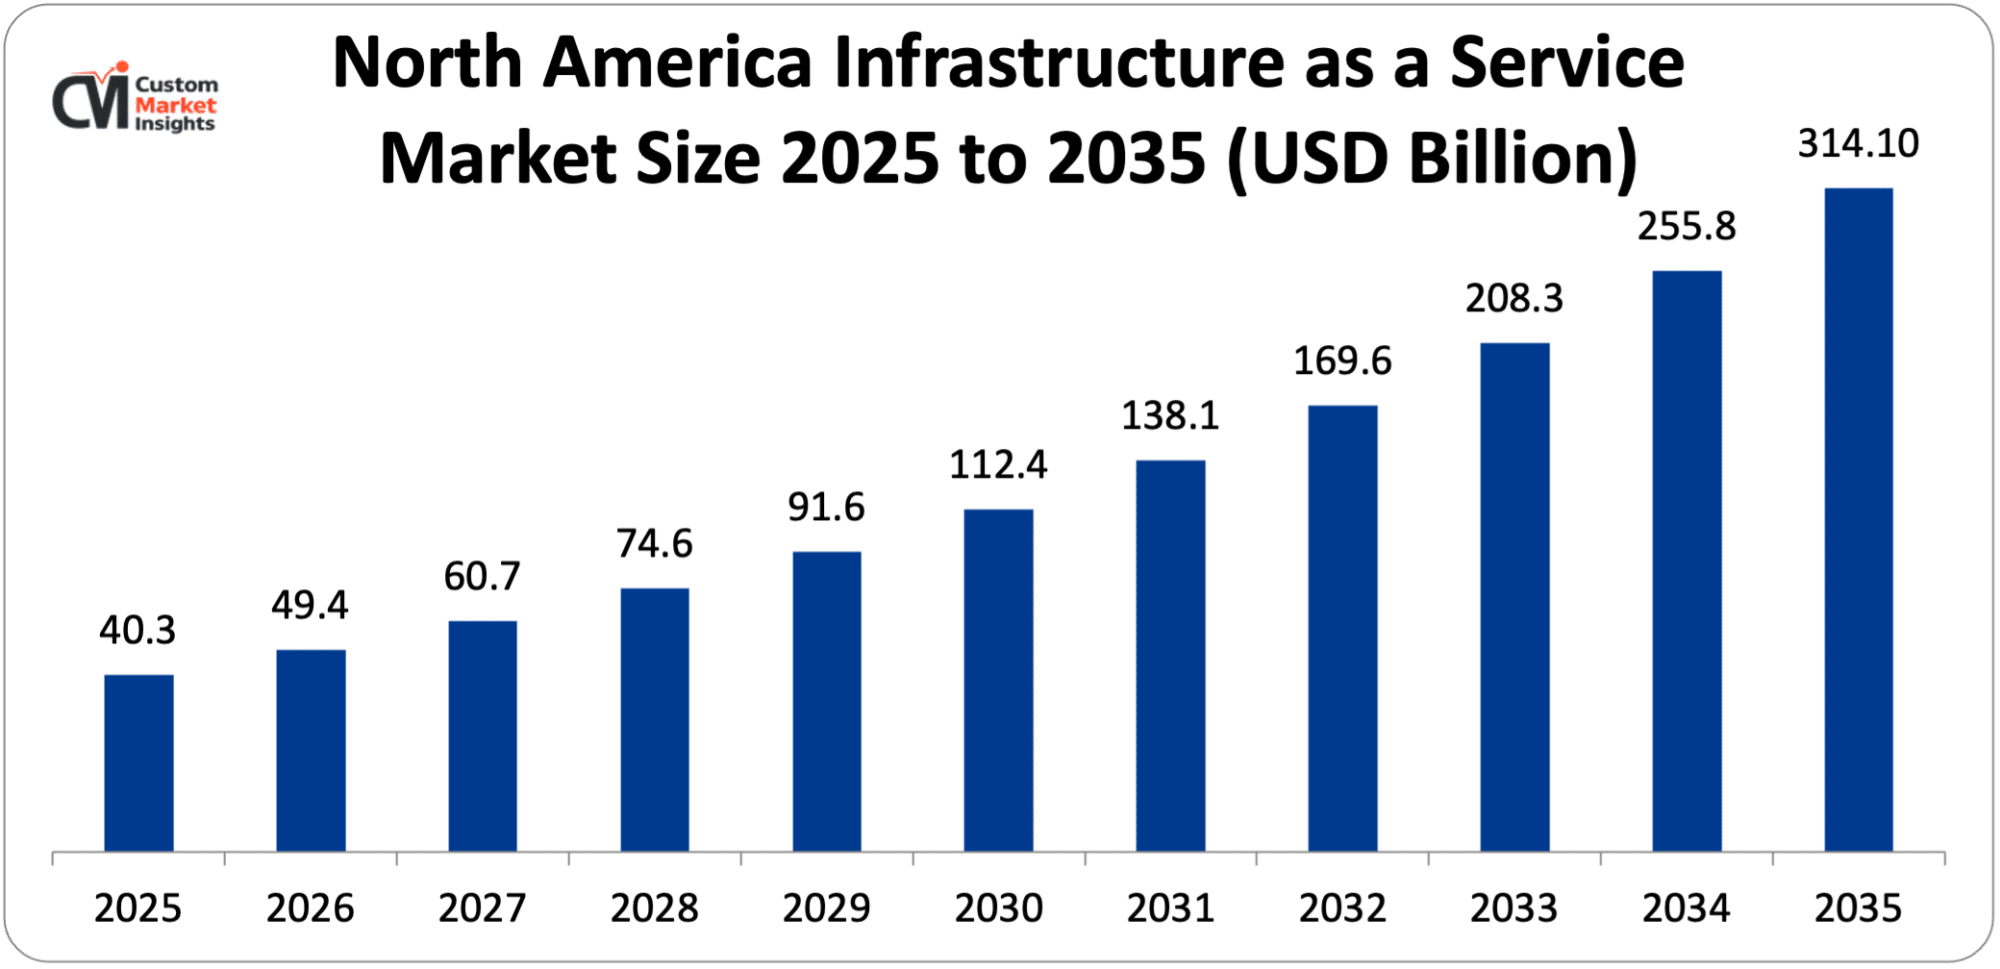
Its market size, in terms of North American infrastructure as a service, is projected to be USD 40.3 billion in 2025 with a growth of about USD 314.1 billion in 2035 with a CAGR of 22.8% between 2026 and 2035.
Why did North America Dominate the Infrastructure as a Service Market in 2025?
In 2025, North America will dominate the global market with an estimated market share of 38%. Various businesses in the region are investing in cloud computing for larger digital transformation projects like big data analytics and mobile, enterprise modernization, and Artificial Intelligence. Market momentum has been further buoyed with more hybrid and multi-cloud setups and rising demand for elastic and cost-effective IT infrastructure solutions. Next-generation technologies like 5G, Internet of Things (IoT), and edge computing also drive the demand for high-end cloud infrastructure solutions. Mature startup ecosystem and stringent regulatory environment coupled with high IT spending have helped North America to retain dominance in the IaaS market.
US Infrastructure as a Service Market Trends
In the North America region, the US leads the industry expansion over the projected period. The increasing product launch is expected to flourish the industry growth. For instance, in June 2025, to celebrate the 30-year partnership with Cisco, NTT DATA, one of the leaders on digital business and digital technology services is launching the newest evolution of their collaboration that focuses on the deployment of AI powered Software Defined Infrastructure (SDI) services for Cisco’s infrastructure and software services.
Why is Europe Experiencing Significant Growth in the Infrastructure as a Service Market?
Europe holds a significant market share in 2025. This growth is primarily driven by the increasing adoption of cloud computing by enterprises and regulatory measures focused on data protection and digital sovereignty. Customers from across the industries are adopting cloud platforms by providers like Amazon Web Services, Microsoft Azure, and Google Cloud Platform to revolutionize their IT infrastructure, improve efficiency, and accelerate digital transformation. The policies like GDPR are inducing organizations to adopt secure and compliant cloud platforms that are further propelling IaaS adoption.
UK Infrastructure as a Service Market Trends
The UK held the dominant position in the market in 2025. The rising demand for cost-effective, compliant, and secure infrastructure due to the increasing pressure of ever-stricter data protection regulations is pushing towards a transition to the cloud. Data center footprints are growing in prominence, IT investments are rising, and the proliferation of digi-businesses such as fintechs and e-commerce is also boosting market expansion.
Why is the Asia Pacific Growing at the Highest CAGR in the Infrastructure as a Service Market?
The Asia Pacific is expected to grow at the highest CAGR over the projected period. Increasing government initiatives fostering digital economies (Digital India and others in the region) are further accelerating the adoption of cloud by enterprises & SMEs. The explosion of mobile devices, the rollout of 5G, and the increasing performance needs of the cloud for data analytics, artificial intelligence (AI), and Internet of Things (IoT) applications are also further supporting this trend.
India Infrastructure as a Service Market Trends
India holds the prominent market share in the industry. The growing investment in digital technology drives the industry growth.
Why is the Middle East & Africa Region is growing rapidly in Infrastructure as a Service?
The MEA region is growing at a steady rate over the projected period. This expansion is driven by the fast digitalization and increasing investment in advanced technology.
UAE Infrastructure as a Service Market Trends
The UAE is growing at the highest CAGR during the forecast period. The growth is owing to the rising investment in Infrastructure as a Service and growing technological advancements.
Top Players in the Infrastructure as a Service Market and Their Offerings
- Alibaba Group Holding Limited
- Red Hat Inc.
- Google Inc.
- IBM Corporation
- Microsoft Corporation
- Oracle Corporation
- Rackspace Hosting Inc.
- EMC Corporation
- Redcentric plc.
- VMware Inc.
- Profitbricks
- Cisco Systems Inc.
- Computer Sciences Corporation (CSC)
- Fujitsu
- Amazon Web Services Inc.
- Dell EMC
- Hewlett Packard Enterprise
- Profitbricks Inc.
- Mindtree Pvt. Ltd.
- Others
Key Developments
Infrastructure as a service market has experienced considerable changes in the last two years as the market players are trying to diversify their technological aspects and develop product portfolios using strategic approaches.
- In March 2025, IBM announced the addition of IBM Storage Ceph as a Service to its emerging portfolio of flexible as a service solution for on-premises infrastructure. The portfolio includes IBM Power delivered as a service, which already offers the distributed compute platform in new form factors and flexible consumption options. (https://newsroom.ibm.com/2025-03-27-ibm-accelerates-momentum-in-the-as-a-service-space-with-growing-portfolio-of-tools-simplifying-infrastructure-management)
- In November 2025, six months after launching its first cloud region in Indonesia, Microsoft announced the availability of new cloud and AI services in the Indonesia Central cloud region, strengthening the foundation for Indonesian organizations to build the next generation of AI-powered solutions. (https://news.microsoft.com/source/asia/2025/11/25/microsoft-expands-ai-infrastructure-and-cloud-services-in-indonesia-empowering-more-organizations-to-innovate-locally/)
These strategic measures have enabled the companies to reinforce their competitive positions, increase the product line, boost their technological competencies, and also seize growth opportunities in the fast-growing infrastructure as a service market.
The Infrastructure as a Service Market is segmented as follows:
By Type
- Storage
- Disaster Recovery
- Compute
- Desktop
- Network
- Others
By Deployment Model
- Private
- Public
- Hybrid
By Enterprise Size
- Large Enterprises
- SMEs
By Vertical
- IT & Telecom
- Banking, Financial Services, and Insurance (BFSI)
- Healthcare
- Government & Defense
- Retail and E-commerce
- Manufacturing
- Energy & Utilities
- Others
Regional Coverage:
North America
- U.S.
- Canada
- Mexico
- Rest of North America
Europe
- Germany
- France
- U.K.
- Russia
- Italy
- Spain
- Netherlands
- Rest of Europe
Asia Pacific
- China
- Japan
- India
- New Zealand
- Australia
- South Korea
- Taiwan
- Rest of Asia Pacific
The Middle East & Africa
- Saudi Arabia
- UAE
- Egypt
- Kuwait
- South Africa
- Rest of the Middle East & Africa
Latin America
- Brazil
- Argentina
- Rest of Latin America
Table of Contents
- Chapter 1. Report Introduction
- 1.1. Report Description
- 1.1.1. Purpose of the Report
- 1.1.2. USP & Key Offerings
- 1.2. Key Benefits For Stakeholders
- 1.3. Target Audience
- 1.4. Report Scope
- 1.1. Report Description
- Chapter 2. Market Overview
- 2.1. Report Scope (Segments And Key Players)
- 2.1.1. Infrastructure as a Service by Segments
- 2.1.2. Infrastructure as a Service by Region
- 2.2. Executive Summary
- 2.2.1. Market Size & Forecast
- 2.2.2. Infrastructure as a Service Market Attractiveness Analysis, By Type
- 2.2.3. Infrastructure as a Service Market Attractiveness Analysis, By Deployment Model
- 2.2.4. Infrastructure as a Service Market Attractiveness Analysis, By Enterprise Size
- 2.2.5. Infrastructure as a Service Market Attractiveness Analysis, By Vertical
- 2.1. Report Scope (Segments And Key Players)
- Chapter 3. Market Dynamics (DRO)
- 3.1. Market Drivers
- 3.1.1. Remote Work & Digital Services Expansion
- 3.1.2. Increasing Startup Ecosystem
- 3.2. Market Restraints
- 3.3. Market Opportunities
- 3.5. Pestle Analysis
- 3.6. Porter Forces Analysis
- 3.7. Technology Roadmap
- 3.8. Value Chain Analysis
- 3.9. Government Policy Impact Analysis
- 3.10. Pricing Analysis
- 3.1. Market Drivers
- Chapter 4. Infrastructure as a Service Market – By Type
- 4.1. Type Market Overview, By Type Segment
- 4.1.1. Infrastructure as a Service Market Revenue Share, By Type, 2025 & 2035
- 4.1.2. Storage
- 4.1.3. Infrastructure as a Service Share Forecast, By Region (USD Billion)
- 4.1.4. Comparative Revenue Analysis, By Country, 2025 & 2035
- 4.1.5. Key Market Trends, Growth Factors, & Opportunities
- 4.1.6. Disaster Recovery
- 4.1.7. Infrastructure as a Service Share Forecast, By Region (USD Billion)
- 4.1.8. Comparative Revenue Analysis, By Country, 2025 & 2035
- 4.1.9. Key Market Trends, Growth Factors, & Opportunities
- 4.1.10. Compute
- 4.1.11. Infrastructure as a Service Share Forecast, By Region (USD Billion)
- 4.1.12. Comparative Revenue Analysis, By Country, 2025 & 2035
- 4.1.13. Key Market Trends, Growth Factors, & Opportunities
- 4.1.14. Desktop
- 4.1.15. Infrastructure as a Service Share Forecast, By Region (USD Billion)
- 4.1.16. Comparative Revenue Analysis, By Country, 2025 & 2035
- 4.1.17. Key Market Trends, Growth Factors, & Opportunities
- 4.1.18. Network
- 4.1.19. Infrastructure as a Service Share Forecast, By Region (USD Billion)
- 4.1.20. Comparative Revenue Analysis, By Country, 2025 & 2035
- 4.1.21. Key Market Trends, Growth Factors, & Opportunities
- 4.1.22. Others
- 4.1.23. Infrastructure as a Service Share Forecast, By Region (USD Billion)
- 4.1.24. Comparative Revenue Analysis, By Country, 2025 & 2035
- 4.1.25. Key Market Trends, Growth Factors, & Opportunities
- 4.1. Type Market Overview, By Type Segment
- Chapter 5. Infrastructure as a Service Market – By Deployment Model
- 5.1. Deployment Model Market Overview, By Deployment Model Segment
- 5.1.1. Infrastructure as a Service Market Revenue Share, By Deployment Model, 2025 & 2035
- 5.1.2. Private
- 5.1.3. Infrastructure as a Service Share Forecast, By Region (USD Billion)
- 5.1.4. Comparative Revenue Analysis, By Country, 2025 & 2035
- 5.1.5. Key Market Trends, Growth Factors, & Opportunities
- 5.1.6. Public
- 5.1.7. Infrastructure as a Service Share Forecast, By Region (USD Billion)
- 5.1.8. Comparative Revenue Analysis, By Country, 2025 & 2035
- 5.1.9. Key Market Trends, Growth Factors, & Opportunities
- 5.1.10. Hybrid
- 5.1.11. Infrastructure as a Service Share Forecast, By Region (USD Billion)
- 5.1.12. Comparative Revenue Analysis, By Country, 2025 & 2035
- 5.1.13. Key Market Trends, Growth Factors, & Opportunities
- 5.1. Deployment Model Market Overview, By Deployment Model Segment
- Chapter 6. Infrastructure as a Service Market – By Enterprise Size
- 6.1. Enterprise Size Market Overview, By Enterprise Size Segment
- 6.1.1. Infrastructure as a Service Market Revenue Share, By Enterprise Size, 2025 & 2035
- 6.1.2. Large Enterprises
- 6.1.3. Infrastructure as a Service Share Forecast, By Region (USD Billion)
- 6.1.4. Comparative Revenue Analysis, By Country, 2025 & 2035
- 6.1.5. Key Market Trends, Growth Factors, & Opportunities
- 6.1.6. SMEs
- 6.1.7. Infrastructure as a Service Share Forecast, By Region (USD Billion)
- 6.1.8. Comparative Revenue Analysis, By Country, 2025 & 2035
- 6.1.9. Key Market Trends, Growth Factors, & Opportunities
- 6.1. Enterprise Size Market Overview, By Enterprise Size Segment
- Chapter 7. Infrastructure as a Service Market – By Vertical
- 7.1. Vertical Market Overview, By Vertical Segment
- 7.1.1. Infrastructure as a Service Market Revenue Share, By Vertical, 2025 & 2035
- 7.1.2. IT & Telecom
- 7.1.3. Infrastructure as a Service Share Forecast, By Region (USD Billion)
- 7.1.4. Comparative Revenue Analysis, By Country, 2025 & 2035
- 7.1.5. Key Market Trends, Growth Factors, & Opportunities
- 7.1.6. Banking, Financial Services, and Insurance (BFSI)
- 7.1.7. Infrastructure as a Service Share Forecast, By Region (USD Billion)
- 7.1.8. Comparative Revenue Analysis, By Country, 2025 & 2035
- 7.1.9. Key Market Trends, Growth Factors, & Opportunities
- 7.1.10. Healthcare
- 7.1.11. Infrastructure as a Service Share Forecast, By Region (USD Billion)
- 7.1.12. Comparative Revenue Analysis, By Country, 2025 & 2035
- 7.1.13. Key Market Trends, Growth Factors, & Opportunities
- 7.1.14. Government & Defense
- 7.1.15. Infrastructure as a Service Share Forecast, By Region (USD Billion)
- 7.1.16. Comparative Revenue Analysis, By Country, 2025 & 2035
- 7.1.17. Key Market Trends, Growth Factors, & Opportunities
- 7.1.18. Retail and E-commerce
- 7.1.19. Infrastructure as a Service Share Forecast, By Region (USD Billion)
- 7.1.20. Comparative Revenue Analysis, By Country, 2025 & 2035
- 7.1.21. Key Market Trends, Growth Factors, & Opportunities
- 7.1.22. Manufacturing
- 7.1.23. Infrastructure as a Service Share Forecast, By Region (USD Billion)
- 7.1.24. Comparative Revenue Analysis, By Country, 2025 & 2035
- 7.1.25. Key Market Trends, Growth Factors, & Opportunities
- 7.1.26. Energy & Utilities
- 7.1.27. Infrastructure as a Service Share Forecast, By Region (USD Billion)
- 7.1.28. Comparative Revenue Analysis, By Country, 2025 & 2035
- 7.1.29. Key Market Trends, Growth Factors, & Opportunities
- 7.1.30. Others
- 7.1.31. Infrastructure as a Service Share Forecast, By Region (USD Billion)
- 7.1.32. Comparative Revenue Analysis, By Country, 2025 & 2035
- 7.1.33. Key Market Trends, Growth Factors, & Opportunities
- 7.1. Vertical Market Overview, By Vertical Segment
- Chapter 8. Infrastructure as a Service Market – Regional Analysis
- 8.1. Infrastructure as a Service Market Overview, By Region Segment
- 8.1.1. Global Infrastructure as a Service Market Revenue Share, By Region, 2025 & 2035
- 8.1.2. Global Infrastructure as a Service Market Revenue, By Region, 2026 – 2035 (USD Billion)
- 8.1.3. Global Infrastructure as a Service Market Revenue, By Type, 2026 – 2035
- 8.1.4. Global Infrastructure as a Service Market Revenue, By Deployment Model, 2026 – 2035
- 8.1.5. Global Infrastructure as a Service Market Revenue, By Enterprise Size, 2026 – 2035
- 8.1.6. Global Infrastructure as a Service Market Revenue, By Vertical, 2026 – 2035
- 8.2. North America
- 8.2.1. North America Infrastructure as a Service Market Revenue, By Country, 2026 – 2035 (USD Billion)
- 8.2.2. North America Infrastructure as a Service Market Revenue, By Type, 2026 – 2035
- 8.2.3. North America Infrastructure as a Service Market Revenue, By Deployment Model, 2026 – 2035
- 8.2.4. North America Infrastructure as a Service Market Revenue, By Enterprise Size, 2026 – 2035
- 8.2.5. North America Infrastructure as a Service Market Revenue, By Vertical, 2026 – 2035
- 8.2.6. U.S. Infrastructure as a Service Market Revenue, 2026 – 2035 (USD Billion)
- 8.2.7. Canada Infrastructure as a Service Market Revenue, 2026 – 2035 (USD Billion)
- 8.2.8. Mexico Infrastructure as a Service Market Revenue, 2026 – 2035 (USD Billion)
- 8.2.9. Rest of North America Infrastructure as a Service Market Revenue, 2026 – 2035 (USD Billion)
- 8.3. Europe
- 8.3.1. Europe Infrastructure as a Service Market Revenue, By Country, 2026 – 2035 (USD Billion)
- 8.3.2. Europe Infrastructure as a Service Market Revenue, By Type, 2026 – 2035
- 8.3.3. Europe Infrastructure as a Service Market Revenue, By Deployment Model, 2026 – 2035
- 8.3.4. Europe Infrastructure as a Service Market Revenue, By Enterprise Size, 2026 – 2035
- 8.3.5. Europe Infrastructure as a Service Market Revenue, By Vertical, 2026 – 2035
- 8.3.6. Germany Infrastructure as a Service Market Revenue, 2026 – 2035 (USD Billion)
- 8.3.7. France Infrastructure as a Service Market Revenue, 2026 – 2035 (USD Billion)
- 8.3.8. U.K. Infrastructure as a Service Market Revenue, 2026 – 2035 (USD Billion)
- 8.3.9. Russia Infrastructure as a Service Market Revenue, 2026 – 2035 (USD Billion)
- 8.3.10. Italy Infrastructure as a Service Market Revenue, 2026 – 2035 (USD Billion)
- 8.3.11. Spain Infrastructure as a Service Market Revenue, 2026 – 2035 (USD Billion)
- 8.3.12. Netherlands Infrastructure as a Service Market Revenue, 2026 – 2035 (USD Billion)
- 8.3.13. Rest of Europe Infrastructure as a Service Market Revenue, 2026 – 2035 (USD Billion)
- 8.4. Asia Pacific
- 8.4.1. Asia Pacific Infrastructure as a Service Market Revenue, By Country, 2026 – 2035 (USD Billion)
- 8.4.2. Asia Pacific Infrastructure as a Service Market Revenue, By Type, 2026 – 2035
- 8.4.3. Asia Pacific Infrastructure as a Service Market Revenue, By Deployment Model, 2026 – 2035
- 8.4.4. Asia Pacific Infrastructure as a Service Market Revenue, By Enterprise Size, 2026 – 2035
- 8.4.5. Asia Pacific Infrastructure as a Service Market Revenue, By Vertical, 2026 – 2035
- 8.4.6. China Infrastructure as a Service Market Revenue, 2026 – 2035 (USD Billion)
- 8.4.7. Japan Infrastructure as a Service Market Revenue, 2026 – 2035 (USD Billion)
- 8.4.8. India Infrastructure as a Service Market Revenue, 2026 – 2035 (USD Billion)
- 8.4.9. New Zealand Infrastructure as a Service Market Revenue, 2026 – 2035 (USD Billion)
- 8.4.10. Australia Infrastructure as a Service Market Revenue, 2026 – 2035 (USD Billion)
- 8.4.11. South Korea Infrastructure as a Service Market Revenue, 2026 – 2035 (USD Billion)
- 8.4.12. Taiwan Infrastructure as a Service Market Revenue, 2026 – 2035 (USD Billion)
- 8.4.13. Rest of Asia Pacific Infrastructure as a Service Market Revenue, 2026 – 2035 (USD Billion)
- 8.5. The Middle-East and Africa
- 8.5.1. The Middle-East and Africa Infrastructure as a Service Market Revenue, By Country, 2026 – 2035 (USD Billion)
- 8.5.2. The Middle-East and Africa Infrastructure as a Service Market Revenue, By Type, 2026 – 2035
- 8.5.3. The Middle-East and Africa Infrastructure as a Service Market Revenue, By Deployment Model, 2026 – 2035
- 8.5.4. The Middle-East and Africa Infrastructure as a Service Market Revenue, By Enterprise Size, 2026 – 2035
- 8.5.5. The Middle-East and Africa Infrastructure as a Service Market Revenue, By Vertical, 2026 – 2035
- 8.5.6. Saudi Arabia Infrastructure as a Service Market Revenue, 2026 – 2035 (USD Billion)
- 8.5.7. UAE Infrastructure as a Service Market Revenue, 2026 – 2035 (USD Billion)
- 8.5.8. Egypt Infrastructure as a Service Market Revenue, 2026 – 2035 (USD Billion)
- 8.5.9. Kuwait Infrastructure as a Service Market Revenue, 2026 – 2035 (USD Billion)
- 8.5.10. South Africa Infrastructure as a Service Market Revenue, 2026 – 2035 (USD Billion)
- 8.5.11. Rest of the Middle East & Africa Infrastructure as a Service Market Revenue, 2026 – 2035 (USD Billion)
- 8.6. Latin America
- 8.6.1. Latin America Infrastructure as a Service Market Revenue, By Country, 2026 – 2035 (USD Billion)
- 8.6.2. Latin America Infrastructure as a Service Market Revenue, By Type, 2026 – 2035
- 8.6.3. Latin America Infrastructure as a Service Market Revenue, By Deployment Model, 2026 – 2035
- 8.6.4. Latin America Infrastructure as a Service Market Revenue, By Enterprise Size, 2026 – 2035
- 8.6.5. Latin America Infrastructure as a Service Market Revenue, By Vertical, 2026 – 2035
- 8.6.6. Brazil Infrastructure as a Service Market Revenue, 2026 – 2035 (USD Billion)
- 8.6.7. Argentina Infrastructure as a Service Market Revenue, 2026 – 2035 (USD Billion)
- 8.6.8. Rest of Latin America Infrastructure as a Service Market Revenue, 2026 – 2035 (USD Billion)
- 8.1. Infrastructure as a Service Market Overview, By Region Segment
- Chapter 9. Competitive Landscape
- 9.1. Company Market Share Analysis – 2025
- 9.1.1. Global Infrastructure as a Service Market: Company Market Share, 2025
- 9.2. Global Infrastructure as a Service Market Company Market Share, 2024
- 9.1. Company Market Share Analysis – 2025
- Chapter 10. Company Profiles
- 10.1. Alibaba Group Holding Limited
- 10.1.1. Company Overview
- 10.1.2. Key Executives
- 10.1.3. Product Portfolio
- 10.1.4. Financial Overview
- 10.1.5. Operating Business Segments
- 10.1.6. Business Performance
- 10.1.7. Recent Developments
- 10.2. Red Hat Inc.
- 10.3. Google Inc.
- 10.4. IBM Corporation
- 10.5. Microsoft Corporation
- 10.6. Oracle Corporation
- 10.7. Rackspace Hosting Inc.
- 10.8. EMC Corporation
- 10.9. Redcentric plc.
- 10.10. VMware Inc.
- 10.11. Profitbricks
- 10.12. Cisco Systems Inc.
- 10.13. Computer Sciences Corporation (CSC)
- 10.14. Fujitsu
- 10.15. Amazon Web Services Inc.
- 10.16. Dell EMC
- 10.17. Hewlett Packard Enterprise
- 10.18. Profitbricks Inc.
- 10.19. Mindtree Pvt. Ltd.
- 10.20. Others.
- 10.1. Alibaba Group Holding Limited
- Chapter 11. Research Methodology
- 11.1. Research Methodology
- 11.2. Secondary Research
- 11.3. Primary Research
- 11.3.1. Analyst Tools and Models
- 11.4. Research Limitations
- 11.5. Assumptions
- 11.6. Insights From Primary Respondents
- 11.7. Why Custom Market Insights
- Chapter 12. Standard Report Commercials & Add-Ons
- 12.1. Customization Options
- 12.2. Subscription Module For Market Research Reports
- 12.3. Client Testimonials
List Of Figures
Figures No 1 to 37
List Of Tables
Tables No 1 to 51
Prominent Players
- Alibaba Group Holding Limited
- Red Hat Inc.
- Google Inc.
- IBM Corporation
- Microsoft Corporation
- Oracle Corporation
- Rackspace Hosting Inc.
- EMC Corporation
- Redcentric plc.
- VMware Inc.
- Profitbricks
- Cisco Systems Inc.
- Computer Sciences Corporation (CSC)
- Fujitsu
- Amazon Web Services Inc.
- Dell EMC
- Hewlett Packard Enterprise
- Profitbricks Inc.
- Mindtree Pvt. Ltd.
- Others
FAQs
The key players in the market are Alibaba Group Holding Limited, Red Hat Inc., Google Inc., IBM Corporation, Microsoft Corporation, Oracle Corporation, Rackspace Hosting Inc., EMC Corporation, Redcentric plc., VMware Inc., Profitbricks, Cisco Systems Inc., Computer Sciences Corporation (CSC), Fujitsu, Amazon Web Services Inc., Dell EMC, Hewlett Packard Enterprise, Profitbricks Inc., Mindtree Pvt. Ltd., Others.
Government initiatives promoting digital transformation and cloud adoption, including public sector cloud policies and funding programs, further accelerate market growth. At the same time, strict regulatory requirements can increase compliance costs and complexity for providers and users, potentially slowing adoption in certain sectors.
The price point plays a critical role in influencing the growth and adoption of the Infrastructure as a Service (IaaS) market, as it directly impacts affordability, scalability, and return on investment for businesses. The pay-as-you-go pricing model offered by providers such as Amazon Web Services, Microsoft Azure, and Google Cloud Platform lowers the barrier to entry by eliminating large upfront capital expenditures, making cloud infrastructure accessible to startups, SMEs, and large enterprises alike. Competitive pricing and flexible billing options allow organizations to optimize costs based on actual usage, encouraging wider adoption and experimentation with cloud services.
According to the present analysis and forecast modeling, the market of infrastructure as a service will witness a significant growth of about USD 1019.2 billion in the year 2035 with the growing innovative product launch, increasing collaboration, and rising digitalization, with a CAGR of 25.4% between the years 2026 and 2035.
It is projected that North America will hold the largest market share in the Infrastructure as a Service market in the forecast period, with a share of about 38% of the global market share, which is attributed to the presence of major players and increasing investment in advanced technology.
The Asia Pacific is expected to grow at the highest rate during the forecast period. The growth in the region is owing to the increasing investment by the government.
The growth of the Infrastructure as a Service (IaaS) market is driven by several key factors, including rapid digital transformation, which is pushing organizations to modernize their IT infrastructure for greater agility and efficiency, and the cost efficiency of the pay-as-you-go model, which reduces upfront capital expenditure while optimizing operational spending.