Environmental Mass Spectrometry Market Size, Trends and Insights By Product Type (Gas Chromatography-Mass Spectrometry (GC-MS and GC-MS/MS), Liquid Chromatography-Mass Spectrometry (LC-MS/MS, Triple Quadrupole, QTOF), Inductively Coupled Plasma Mass Spectrometry (ICP-MS, ICP-MS/MS), Ion Mobility Spectrometry, High-Resolution Mass Spectrometry (Orbitrap, TOF), Other Product Types (Direct MS, Field-Deployable Systems)), By Application (Water Quality Testing (Drinking Water, Groundwater, Surface Water, Wastewater), Air Quality Monitoring (Ambient Air, Stack Emissions, Indoor Air), Soil & Sediment Analysis (Contaminated Land, Agricultural Soil), Food Safety & Contamination Testing (Pesticide Residues, Mycotoxins, Veterinary Drugs), Industrial Effluent & Process Monitoring, Other Applications (Biota, Emerging Contaminants)), By End-User (Environmental Testing Laboratories (Accredited Commercial Labs), Government & Regulatory Agencies (EPA, Environment Agency, CPCB), Industrial & Manufacturing Facilities, Academic & Research Institutes, Water Utilities & Municipal Authorities, Other End-Users), and By Region - Global Industry Overview, Statistical Data, Competitive Analysis, Share, Outlook, and Forecast 2026 – 2035
Report Snapshot
CAGR: 7.6%
| Study Period: | 2026-2035 |
| Fastest Growing Market: | Asia Pacific |
| Largest Market: | North America |
Major Players
- Waters Corporation
- Agilent Technologies Inc.
- Sciex (Danaher Corporation)
- Shimadzu Corporation
- Others
Reports Description
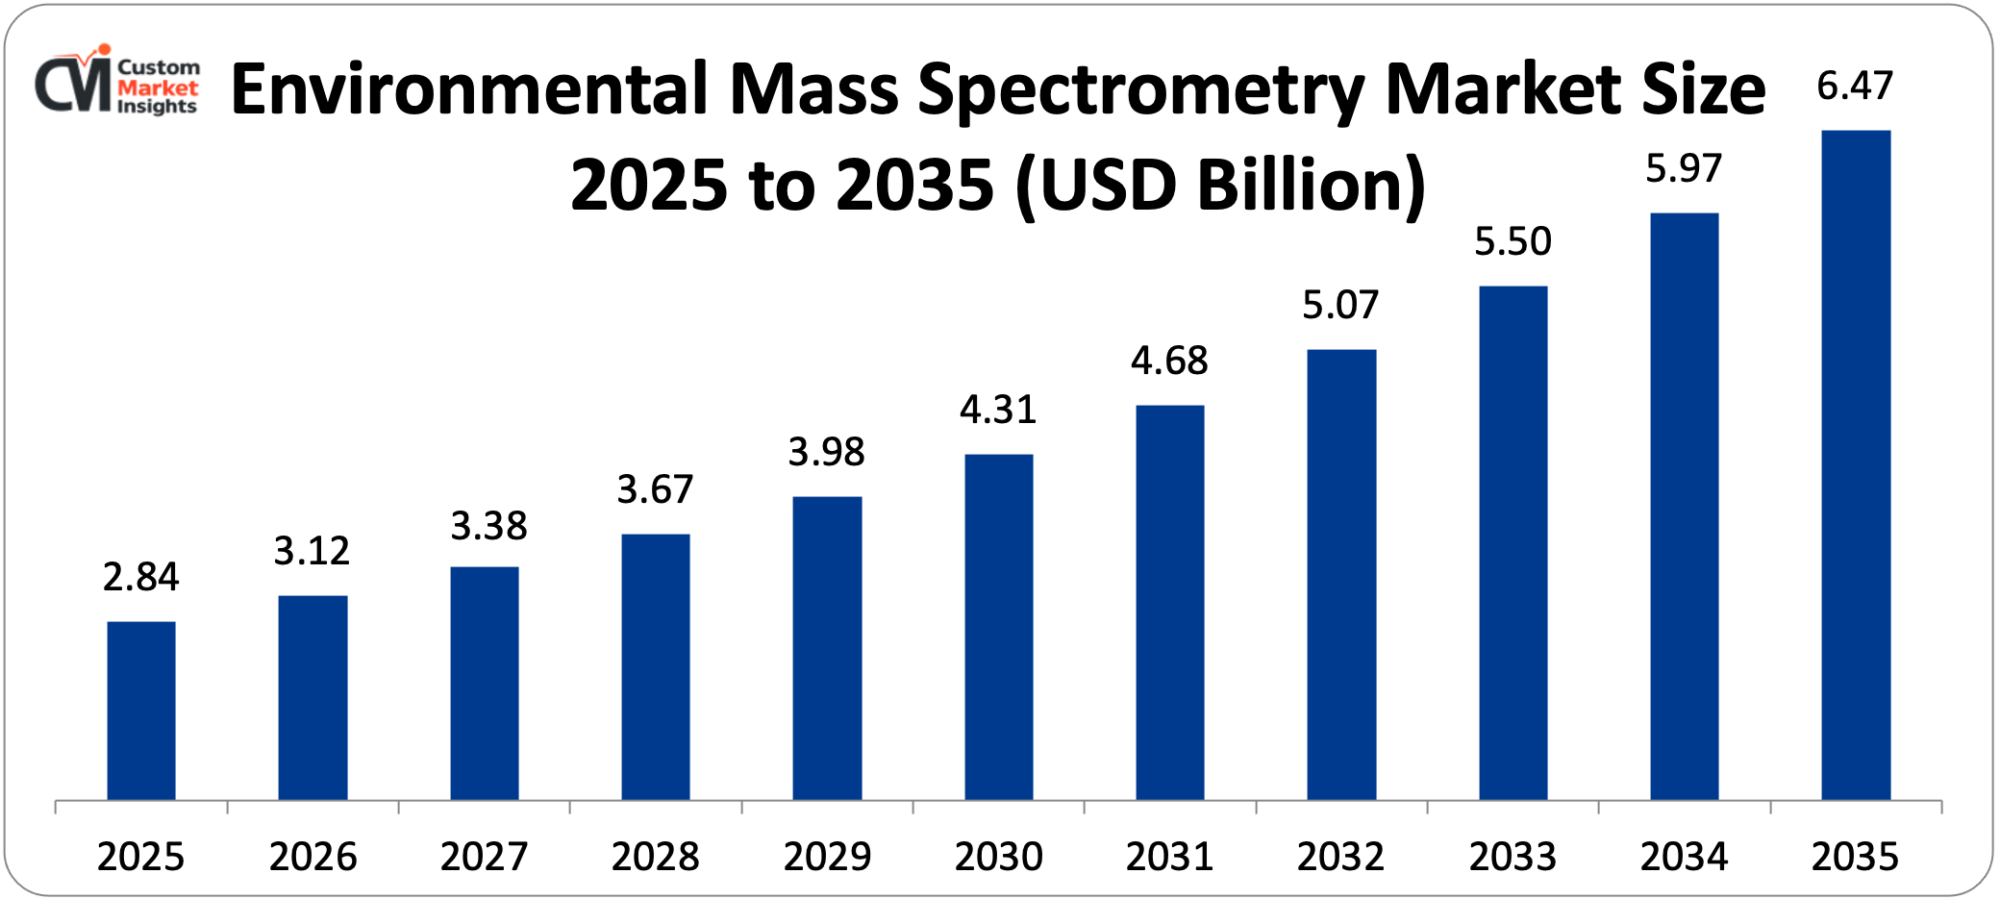
The market size of global environmental mass spectrometry is estimated to be USD 2.84 billion in 2025, and is expected to grow by USD 3.12 billion in the year 2026 to about USD 6.47 billion in 2035 with a CAGR of 7.6% between 2026-2035.
The increasing global regulatory stricter environmental contaminant standards of water, air, soil, and food-based matrices that are compelling the expanded testing capabilities of analytical testing methods, the growing detection and remediation liability of novel contaminants such as per- and polyfluoroalkyl substances (PFAS), microplastics, and pharmaceutical remnants that are dictating the trace level sensitivity available only using mass spectrometry, the growing global network of mass spectrometry based platforms the growing environment compliance liability that is driving environmental analysis investment to the facilities level, and the ongoing development of the mass spectrometry platform capabilities enabling faster, more sensitive, and more cost-effective environmental analysis collectively drive robust and sustained market growth throughout the forecast period.
Market Highlight
- North America controlled the largest market share through environmental mass spectrometry with 38% in 2025.
- Asia Pacific is projected to have the fastest CAGR with 10.2%, between 2026 and 2035.
- By product type, the GC-MS segment won a market of about 36% of the market share in 2025.
- By product type, the fastest CAGR of 10.8% exists in the LC-MS segment between the years 2026 and 2035.
- By Application The water quality testing segment had the largest market share of 41% in 2025, whereas the air quality monitoring segment will have the steepest CAGR of 9.4% in the rest of the forecasted period between 2026 and 2035.
- By end-user, the environmental testing laboratories segment is projected to have the highest market share of 46% in 2025 and the industrial and manufacturing facilities segment is projected to have the best CAGR of 10.6 between the years 2026 and 2035.
Significant Growth Factors
The Environmental Mass Spectrometry Market Trends present significant growth opportunities due to several factors:
- PFAS Contamination Crisis and Emerging Contaminant Regulation Driving Mass Spectrometry Adoption:
The most impactful near-term cause of environmental mass spectrometry instrument investment is the global per- and polyfluoroalkyl substances (PFAS) crisis, in which thousands of synthetic fluorinated compounds used in industry, firefighting foams and consumer goods have contaminated drinking water sources, soils, and ecosystems in both developed and developing countries at ultra-trace concentration levels that no other analytical instrument can match the sensitivity, selectivity, and multi-analyte ability of LC-MS/MS systems can.
In April 2024, the U.S. Environmental Protection Agency finalized maximum contaminant levels (MCLs) of six PFAS compounds in drinking water (the first-ever federal enforceable PFAS drinking water standard) to set maximum contaminant levels (MCLs) in drinking water of six PFAS compounds (including PFOA and PFOS) – and to establish maximum contaminant levels (MCLs) in drinking water of four additional PFAS compounds – and to establish compliance testing requirements that require water systems to serve the majority of the U It is necessary that triple quadrupole LC-MS/MS systems that are run according to the EPA Method 533 or Method 537.1 protocols achieve the 4 ppt detection limit of PFOA and PFOS in complex drinking water matrices — equipment that reflects a capital expenditure of USD 150,000-USD 400,000 per system – an instrument procurement demand flood as public water systems, state environmental laboratories, and commercial environmental testing laboratories invest in LC-MS/MS/capacity to comply with the EPA timeframe of the testing of their compliance.
The PFAS regulatory framework by the European Union, including the EU Drinking Water Directive of a total PFAS sum parameter of 100 ppt and individual PFAS of 10 ppt of drinking water, coupled with the EU’s proposed Universal PFAS Restriction of PFAS in drinking water under the REACH framework, which would be the most global PFAS use restriction regulatory measure ever undertaken, is setting a parallel testing demand in drinking water analysis in Europe. Newly emerging contaminant regulation is not just limited to PFAS, but also includes pharmaceutical and personal care product residues in water, microplastic characterization in water and sediments, pesticide metabolite monitoring in groundwater and surface water, and endocrine-disrupting compound surveillance in aquatic environments — requiring mass spectrometry analysis instruments that are beginning to drive up instrument demand throughout the entire environmental testing laboratory industry. The worldwide market to treat PFAS-contaminated sites-which is estimated to be a multi-hundred billion obligation of contaminated site examination, water treatment and soil remediation-demands numerous analytical tests during the remediation planning, installation, and verification measures, and every PFAS-contaminated site with examination necessitates hundreds or thousands of mass spectrometry tests of site characterization, monitoring on the remediation execution and regulatory reporting.
- Strengthening Global Environmental Regulations and Expanding Monitoring Networks:
The ongoing tightening of environmental quality standards on water, air, soil and food matrices by the regulatory authorities in North America, Europe, China and India among other major economic blocks, coupled with the increase in environmental monitoring networks and the enforcement of the current regulations, is producing a structural upward trend in the volume of environmental analytical testing which drives sustained growth of instruments in the entire environmental mass spectrometry market. The National Primary Drinking Water Regulations of the U.S. EPA, which are regularly amended to include new regulated compounds as toxicological evidence becomes available and new methods are developed to detect them, have continued to include new regulated compounds over the last thirty years, and each new addition has resulted in new mandatory testing of public water systems that, in turn, creates a new demand leading to the purchase of analytical instruments.
The watchlist system of the EU Water Framework Directive, which introduces a rolling list of substances of emerging concern to be monitored with priority across the European water body, imposes continuous new monitoring of compounds on the European environmental laboratories, and with each new watchlist cycle new analytical methods need to be developed and the capability of instruments to analyze the new substances to be demonstrated. The modernization of the environmental monitoring infrastructure in China as a result of environmental protection priorities of the government and the emission reduction obligations of the country as part of its national climate targets is providing significant investments in the national network of environmental monitoring stations and in the capabilities of the analytical instruments of the environmental monitoring centers of the provinces and municipalities of China.
The National Water Quality Monitoring Programme of India – managed through the Central pollution control board with a monitoring point in the major river systems and groundwaters—is broadening its monitoring area and increasing the capacity to analyze the water with mass spectrometry equipment which is able to identify the industrial chemical pollution that is endangering water resources in industrializing areas. In line with the development of epidemiological and toxicological evidence, the periodic revision of the World Health Organization Guidelines to Drinking Water Quality system, the international standard of reference in the development of regulatory frameworks, is gradually introducing new contaminants with more restrictive guideline values, prompting the purchase of instruments to meet the lower limits of increased WHO guidelines in nationwide regulatory applications.
What are the Major Advances Changing the Environmental Mass Spectrometry Market Today?
- High-Resolution Mass Spectrometry Enabling Non-Targeted Environmental Screening:
There is a rapidly growing commercial use of high-resolution mass spectrometry (HRMS) instruments such as quadrupole time-of-flight (QTOF), Orbitrap, and high-field magnetic sector mass spectrometers with mass accuracy of less than 5 parts per million and resolving power greater than 25,000 that are making possible non-targeted modes of environmental screening that can concomitantly measure, identify and tentatively quantify thousands of compounds in a single environmental sample analysis allowing environmental chemical surveillance to no longer be approached as a targeted analysis of a preset.
The conventional targeted environmental analytical procedures, where the analytical system has been programmed to identify a particular predetermined set of regulated compounds, do not give any indication of the presence of unregulated compounds, emerging pollutants, transformation products, or even new industrial chemicals in environmental samples at toxicologically significant levels but are not part of the regulated compounds list. HRMS non-targeted screening fills this gap in analysis by measuring high-resolution mass spectral data of every detectable compound in a sample – generating a complete chemical fingerprint that can then be searched against spectral libraries containing hundreds of thousands of compound entries and processed by computer algorithms to recognize known compounds, suggest structures of any unknown compounds, and warn of new substances of interest.
The use of non-targeted screening of HRMS on PFAS surveillance, in which the universe of PFAS chemicals includes thousands of individual compounds, of which only a small fraction are available in analytical standards to be quantified targetingly, is showing the transformative usefulness of non-targeted methods in providing overall PFAS characterization to add to the small list of compounds of targeted methods. Orbitrap mass spectrometer platforms developed by Thermo Fisher Scientific, such as the Orbitrap Exploris and Orbitrap Eclipse series, initially developed for proteomics research, are being modified for environmental non-targeted screening uses with special data acquisition schemes, environmental spectral library generation, and automated compound discovery computer software that are rendering HRMS-based environmental screening ever more readily available to accredited environmental testing laboratories with the capacity to interpret the complex HRMS output.
The UNIFI Scientific Information System of Waters Corporation, which offers integrated data acquisition, compound identification, and reporting of non-targeted environmental screening workflows to HRMS, and the Unknowns Analysis software of Agilent Technologies, which is a QTOF-based environmental screening workflow software that is enabling wider application of non-targeted methods in environmental testing laboratories, are the most successful commercial applications of software-enabled HRMS environmental screening workflows.
- Triple Quadrupole LC-MS/MS Sensitivity Advances for Ultra-Trace Contaminant Detection:
The ongoing enhancement of triple quadrupole LC-MS/MS sensitivity (with enhancement in ion source design, ion transfer optics, quadrupole mass filter resolution, and detector technology) is not only making possible the detection of contaminants present in the environment at concentration levels previously accessible only to the most specific and technically demanding of analytical methods but also enhancing method robustness, tolerance to matrices and throughput making ultra-trace analysis of the environment increasingly routine in accredited testing laboratory settings.
The selected reaction monitoring (SRM) mode of operation provided by the triple quadrupole LC-MS/MS instrument, where the first quadrupole picks one of the precursor ions of the target population of the third quadrupole, the second quadrupole triggers the collision-induced dissociation needed to produce diagnostic fragment ions, and the third quadrupole transfers specific diagnostic fragment ions to the detector, is the combination of high sensitivity and specificity which makes triple quadrupole systems the instrument of choice as the regulatory method of choice in the most demanding applications of environmental trace analysis such as Top triple quadrupole LC-MS/MS systems of Sciex, Waters, AB Sciex, and Thermo Fisher Scientific. These systems have instrument detection limits of PFOA and PFOS in drinking water of 0.51 ppt and 1 ppt under EPA Method 533 conditions — far below the 4 ppt MCL of the EPA test but well within the instrument technology analysis capability of current instrument platforms to meet the most stringent regulatory requirements.
The invention of high matrix tolerance ion source technologies, such as the TurboV ion source (Sciex), UniSpray (Waters), and HESI-II (Thermo Fisher), that allow quantification of samples at complex environmental matrices such as surface water, groundwater, wastewater effluent, and soil extracts without the extensive sample cleanup that was necessary in older ion source technologies has greatly enhanced the workflow of analytical throughput and per-sample cost at environmental testing labs. Available source options on current generation triple quadrupole systems, such as atmospheric pressure photoionization (APPI) and atmospheric pressure chemical ionization (APCI), are enabling an extension of LC-MS/MS application to non-polar environmental contaminant classes, such as polycyclic aromatic hydrocarbons (PAHs), polychlorinated biphenyls (PCBs), and brominated flame retardants, to be ionized inefficiently by electrospray ionization, enabling a single LC-MS/MS platform to encompass a broader range of environmental contaminant compound classes than was achievable with earlier generation instrumentation.
- ICP-MS Advances for Trace Metal and Metalloid Environmental Monitoring:
The further evolution of inductively coupled plasma mass spectrometry systems, such as the introduction of triple quadrupole ICP-MS/MS, high-resolution sector field ICP-MS, and single particle ICP-MS to characterize nanoparticles, rare earth elements, and new inorganic contaminants, is extending the capacity of environmental laboratory to trace metals and metalloid monitoring to the stringent regulation of already regulated metals as well as to the new monitoring needs of nanoparticles ICP- MS offers the combination of extreme sensitivity – measure limits in the parts per trillion to parts per quadrillion range of most elements – wide elemental coverage – simultaneously measures 60 or more elements in a single run – and high analyst sensitivity that makes it the instrument technology of choice to conduct EPA Methods 200.8 and 6020B and similar international regulatory compliance testing of trace metals in drinking water, surface water, groundwater, and wastewater.
Triple quadrupole ICP-MS – in which a collision/reaction cell between two quadrupole mass filters with controlled chemistry incorporating reactive gases such as hydrogen, ammonia, and oxygen is used to resolve spectral interferences that single quadrupole ICP-MS cannot at specific masses – is allowing the determination of previously interference-afflicted elements such as arsenic in chlorine-rich matrices, selenium in sulfate-rich matrices, and vanadium in iron-rich matrices to the limits of the drinking water regulations. Single particle ICP-MS a mode of measurement where the time resolution of the ICP-MS detector is set to focus on the short signal pulses formed by individual nanoparticles traversing the plasma, is facilitating the characterization of metal containing nanoparticles in environmental waters, not only in terms of particle number concentration but also in terms of individual particle size distribution information, which is not available to dissolved metal ICP-MS analysis alone. This functionality is pertinent to the new regulatory focus on engineered nanoparticles as environmental contaminants, with regulatory agencies in Europe and North America considering monitoring needs on titanium dioxide, silver, and zinc oxide nanoparticles in water that would result in new ICP-MS instrumentation demand in environmental monitoring laboratories.
Category Wise Insights
By Product Type
Why Does GC-MS Lead the Market?
GC-MS is the largest segment of product types with about 36% of the total market share in 2025, due to it being the most established and widely used method of mass spectrometry technique in environmental analysis – the methods of GC-MS are the analytical basis of the EPA priority pollutant monitoring program, USEPA Methods 8260 and 8270 of volatile and semi-volatile organic compounds respectively, the European standard EN ISO methods of monitoring organic compounds in water and soil, and similar national environmental analysis standards in virtually all jurisdictions around the world. It is The ultimate method of environmental monitoring of volatile organic compounds (VOCs); petroleum fuel releases such as benzene, toluene, ethylbenzene, and xylenes (BTEX), semi-volatile organic compounds such as PAHs, organochlorine pesticides, PCBs, and dioxins and other volatile priority pollutants of water, soil, sediment, and air.
The range of compounds that can be analyzed by GC-MS environmental techniques, including hundreds of separate organic compounds subject to different national and international environmental requirements, makes the methodology sustainable, as every new regulated organic compound monitoring need falls on the GC-MS analysis technique due to its already established regulatory acceptability and long history of method validation. GC-MS/MS (triple quadrupole GC-MS) systems – which offer increased sensitivity and selectivity at the trace level analysis of difficult matrices—are increasing in market share in the GC-MS market as environmental labs replace single quadrupole systems with triple quadrupole systems to meet the lower limits of detection of priority compounds such as dioxins, furans and chlorinated pesticides in tightening regulatory requirements.
By Application
Why Does Water Quality Testing Lead the Market?
The greatest market segment application at 41% of the total market share in 2025 is water quality testing, which denotes the status of water as the most highly regulated environmental matrix in the globe, with drinking water quality standards in virtually every country defining the maximum acceptable level of contaminants of dozens to hundreds of chemical compounds that demand mass spectrometry as an analytical method to verify regulatory compliance. The drinking water industry alone, including compliance testing of the public water systems under the safe drinking water act in the United States, the EU drinking water directive in Europe, the WHO guidelines implementation in developing countries, and similar national schemes in other countries of the world, provides the largest and most predictable annual testing volumes in the environmental mass spectrometry industry, which offers commercial testing labs and state utility labs with a stable and increasing base of analytical service income.
The PFAS drinking water MCL finalization in the United States – establishing a mandatory compliance testing regimen of an estimated 66,000 of the public water systems at specified monitoring frequency – is the most influential regulatory measure that creates the mass spectrometry instrument demand in the current market cycle on water quality testing. Wastewater discharge monitoring whereby industrial facilities, municipal wastewater treatment facilities and stormwater discharge permit holders need to prove their adherence to effluent permit constraints on regulated compounds prior to emitting treated effluent is a sizeable and structurally enduring water quality testing mass spectrometry use.
By End-User
Why Do Environmental Testing Laboratories Lead the Market?
Environmental testing laboratories – comprising large, nationwide, commercial environmental testing companies, regional independent testing laboratories, and public sector analytical facilities run by government environmental agencies make up the largest end-user market, with just under 46% of total market share in 2025, wherein commercial testing laboratories are the most important entry point through which regulatory compliance testing demand is translated into purchasing instruments, in that regulated entities such as public water systems, industrial permit holders, and site operators with contamination generally outsource their analytical testing to accredited commercial testing laboratories.
Large commercial testing organizations such as Eurofins Scientific, Bureau Veritas, SGS SA, Intertek and TestAmerica (Eurofins) have a large market share in the global accredited environmental testing laboratory market, operating hundreds of accredited environmental testing laboratories around the world, and are the largest single purchasers of environmental mass spectrometry instruments annually due to their ongoing replacement of instruments cycle, scale capacity expansion requirement of increased testing volumes, and investment in technology upgrades to meet the tightening identification methods requirements. Published market research estimates the U.S. commercial environmental testing laboratory market to be USD 3.5 billion in 2023, with PFAS testing being the most rapidly expanding category of analytical service and leading the next wave of commercial laboratory instrument purchases.
Report Scope
| Feature of the Report | Details |
| Market Size in 2026 | USD 3.12 billion |
| Projected Market Size in 2035 | USD 6.47 billion |
| Market Size in 2025 | USD 2.84 billion |
| CAGR Growth Rate | 7.6% CAGR |
| Base Year | 2025 |
| Forecast Period | 2026-2035 |
| Key Segment | By Product Type, Application, End-User and Region |
| Report Coverage | Revenue Estimation and Forecast, Company Profile, Competitive Landscape, Growth Factors and Recent Trends |
| Regional Scope | North America, Europe, Asia Pacific, Middle East & Africa, and South & Central America |
| Buying Options | Request tailored purchasing options to fulfil your requirements for research. |
Regional Analysis
How Big is the North America Market Size?
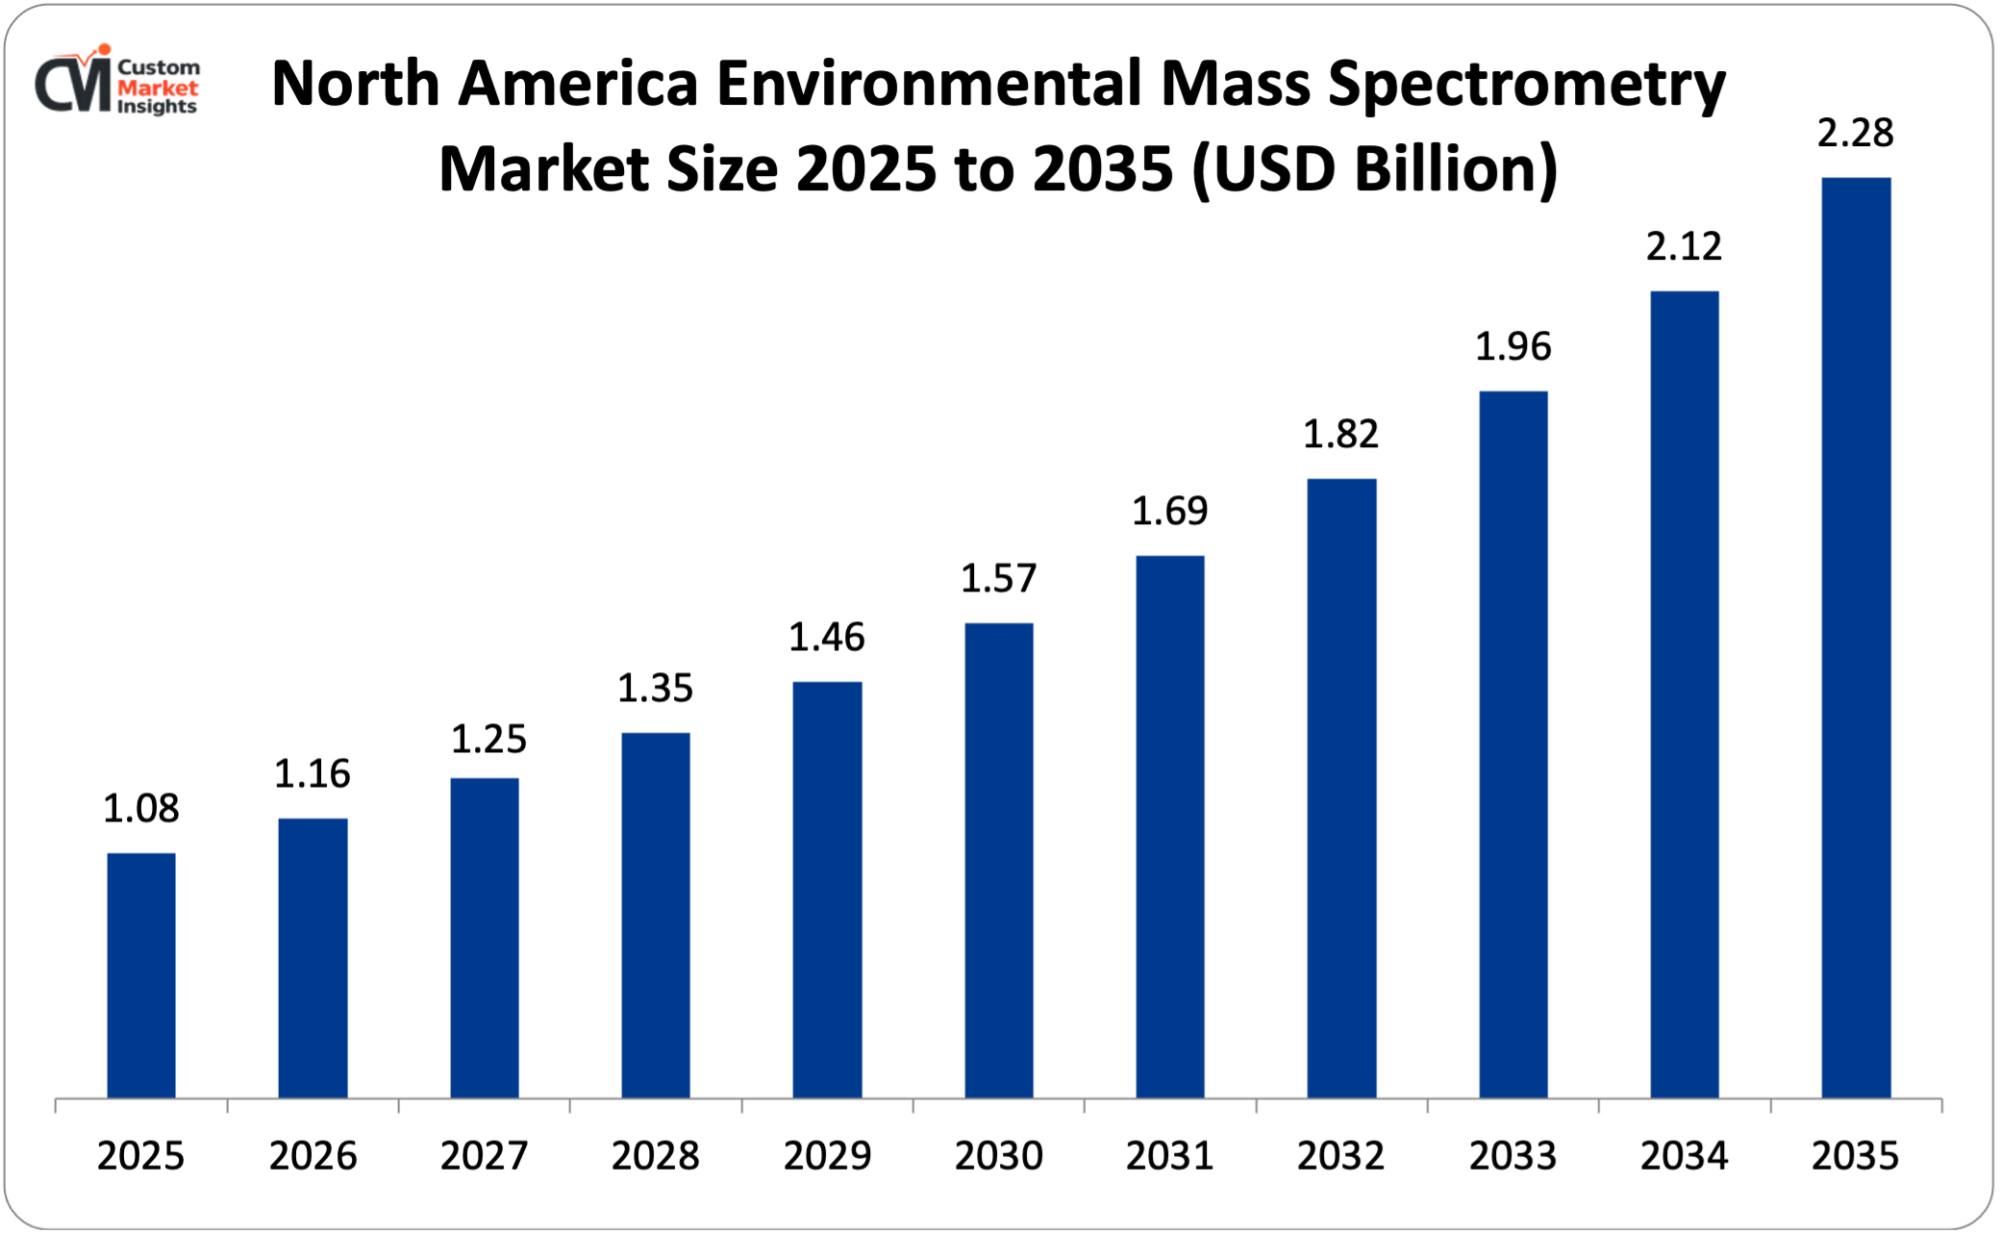
The North America environmental mass spectrometry market size is estimated at USD 1.08 billion in 2025 and is projected to reach approximately USD 2.28 billion by 2035, with a CAGR of 7.8% from 2026 to 2035.
Why Did North America Dominate the Market in 2025?
Only in 2025, a figure of about 38% global market share will be commanded by North America, which is the United States-led global environmental regulatory jurisdiction, the largest commercial environmental testing laboratory sector that creates the highest annual volumes of mass spectrometry instruments, the most active and comprehensive written contaminated site assessment and remediation program creating sustained analytical testing demand, and the imminent wave of instrument procurement created by the EPA finalization of the PFAS MCL in April 2024 creating about 66,000 annual mass spectrometry.
The analytical methods program of the U.S. EPA, it maintains the authoritative library of EPA-approved analytical methods to be used in environmental compliance testing, such as Methods 8260, 8270, 200.8, 533, and 537.1 which are effectively used in defining the instrument technology requirements in environmental compliance testing in the United States, with each method defining the minimum instrument performance requirements that compliance laboratories must be able to demonstrate, pushing the instrument procurement towards platforms that meet or exceed the method requirements. The high number of thousands of sites in the U.S. Superfund program that have been listed on the National Priorities List as contaminated at some point in their lifecycle (undergoing investigation, feasibility study, remedial design, and/or remediation) creates sustained demand on the level of environmental mass spectrometry analytical services and instrumentation. site characterization, remedy selection, and monitoring the performance of the remedy require the use of extensive multi-compound mass spectrometry analysis.
Why is Europe a Strategically Important Market?
The market size of European environmental mass spectrometry is projected to grow to about USD 854 million in 2025, and up to about USD 1.74 billion by 2035, with a compound growth rate of 7.4. Europe is a market with critical strategic significance anchored on the basis of the extraordinarily comprehensive environmental regulatory regime of the EU – including the Water Framework Directive, which sets environmental quality standards on priority substances in European water bodies; the Drinking Water Directive, which sets limits on PFAS unique to the world; the Industrial Emissions Directive, which sets requirements to monitor at industrial installations; and the EU Chemical Strategy for Sustainability, which further extends restrictions on hazardous substances that enable monitoring requirements. The five largest European markets for environmental mass spectrometry are Germany, France, the United Kingdom, the Netherlands, and Sweden, with a combined market share predominantly of 65% of the European market revenue due to the combination of strong environmental regulatory enforcement, a high commercial testing laboratory market, and a high level of government environmental monitoring laboratory infrastructure. The EU Zero Pollution Action Plan (the aim of which is to reduce the health impact of air pollution by 25%, reduce plastic litter in the sea by 50%, and reduce the use and risk of pesticides by 50%) will facilitate a gradual increase in environmental monitoring needs, which will continue to increase the growth of instruments in the forecast period.
Why is Asia Pacific the Fastest-Growing Market?
Asia Pacific has the highest growth regional market with the forecasted 10.2% CAGR 2026-35, due to the exceptional environmental monitoring infrastructure development in China under the pollution control priority of the government, with the ministry of ecology and environment leading the network of national environmental monitoring centers which have been heavily invested in the modern analysis products, India’s industrial pollution control enforcement is growing; and the laboratory modernization programs in Japan, as the country has highly developed environmental monitoring industries, are constantly maintaining the world-leading technology in the area of environmental monitoring, and the expansion of the environmental protection investment in South Korea’s growing environmental protection investment and Australia’s environmental monitoring expansion are driven by industrial contamination assessment obligations and water quality protection programs. China’s 14th Five-Year Plan explicitly prioritizes improvement of ecological environment quality — with binding targets for air quality, water quality, and soil pollution remediation — supporting sustained government investment in environmental monitoring instrumentation at national, provincial, and municipal monitoring center laboratories. India’s National Clean Air Programme—targeting a 40% reduction in particulate matter concentrations in 122 non-attainment cities by 2026 — is driving air quality monitoring infrastructure investment that includes mass spectrometry-based air toxics monitoring capability at central and regional monitoring stations.
Why is the Middle East & Africa Region an Emerging Market?
The LAMEA region shows increasing market evolution due to the industrial environmental compliance programs in Saudi Arabia and the UAE that demand monitoring of petrochemical, refinery and manufacturing facilities emissions and discharges, Israel’s advanced environmental monitoring industry in line with EU environmental programs that harmonize its regulatory framework, South Africa environmental enforcement practices in its mining projects necessitating heavy metal and organic compounds monitoring, Brazil due to its high market in environmental testing laboratories to serve the expansive agricultural, industrial and oil and gas industries and the Middle East and African countries that are embracing international environmental quality standards that demand the use of mass spectrometry monitoring requirements.
Top Players in the Market and Their Offerings
- Thermo Fisher Scientific Inc.
- Waters Corporation
- Agilent Technologies Inc.
- Sciex (Danaher Corporation)
- Shimadzu Corporation
- PerkinElmer Inc. (Revvity)
- Bruker Corporation
- JEOL Ltd.
- Inficon Holding AG
- 908 Devices Inc.
- Microsaic Systems plc
- Others
Key Developments
The market has undergone significant developments as industry participants seek to advance PFAS analytical capabilities, expand high-resolution non-targeted screening platforms, and respond to the global regulatory-driven analytical testing demand expansion.
- In September 2024: Sciex introduced the commercial release of its ZenoTOF 7600 Plus system with added sensitivity to analyze PFAS in drinking water matrices – the instrument had detection limits of 0.3 ppt PFOA and 0.3 ppt PFOS in EPA Method 533 conditions, comfortably below the 4 ppt MCL in the EPA, but specifically aimed at the instrument purchase wave at the U.S. commercial environmental testing laboratories that needed to add LC-MS/MS capability to their service offerings.
- In January 2025: Thermo fisher scientific declared the release of its TSQ Altis MAX triple quadrupole mass spectrometer – utilizing a novel high pressure source ion technology and reformulated ion transfer optics that offer a 3-fold elevation of sensitivity in comparison with the prior TSQ Altis used to analyze multi-compound pesticide toxins in water and food samples in the environmental testing laboratory sector to monitor multi-compound contaminants in organic substances utilizing EPA Methods 8260D and 8270E and comparable worldwide control techniques.
The Environmental Mass Spectrometry Market is segmented as follows:
By Product Type
- Gas Chromatography-Mass Spectrometry (GC-MS and GC-MS/MS)
- Liquid Chromatography-Mass Spectrometry (LC-MS/MS, Triple Quadrupole, QTOF)
- Inductively Coupled Plasma Mass Spectrometry (ICP-MS, ICP-MS/MS)
- Ion Mobility Spectrometry
- High-Resolution Mass Spectrometry (Orbitrap, TOF)
- Other Product Types (Direct MS, Field-Deployable Systems)
By Application
- Water Quality Testing (Drinking Water, Groundwater, Surface Water, Wastewater)
- Air Quality Monitoring (Ambient Air, Stack Emissions, Indoor Air)
- Soil & Sediment Analysis (Contaminated Land, Agricultural Soil)
- Food Safety & Contamination Testing (Pesticide Residues, Mycotoxins, Veterinary Drugs)
- Industrial Effluent & Process Monitoring
- Other Applications (Biota, Emerging Contaminants)
By End-User
- Environmental Testing Laboratories (Accredited Commercial Labs)
- Government & Regulatory Agencies (EPA, Environment Agency, CPCB)
- Industrial & Manufacturing Facilities
- Academic & Research Institutes
- Water Utilities & Municipal Authorities
- Other End-Users
Regional Coverage:
North America
- U.S.
- Canada
- Mexico
- Rest of North America
Europe
- Germany
- France
- U.K.
- Russia
- Italy
- Spain
- Netherlands
- Rest of Europe
Asia Pacific
- China
- Japan
- India
- New Zealand
- Australia
- South Korea
- Taiwan
- Rest of Asia Pacific
The Middle East & Africa
- Saudi Arabia
- UAE
- Egypt
- Kuwait
- South Africa
- Rest of the Middle East & Africa
Latin America
- Brazil
- Argentina
- Rest of Latin America
Table of Contents
- Chapter 1. Report Introduction
- 1.1. Report Description
- 1.1.1. Purpose of the Report
- 1.1.2. USP & Key Offerings
- 1.2. Key Benefits For Stakeholders
- 1.3. Target Audience
- 1.4. Report Scope
- 1.1. Report Description
- Chapter 2. Market Overview
- 2.1. Report Scope (Segments And Key Players)
- 2.1.1. Environmental Mass Spectrometry by Segments
- 2.1.2. Environmental Mass Spectrometry by Region
- 2.2. Executive Summary
- 2.2.1. Market Size & Forecast
- 2.2.2. Environmental Mass Spectrometry Market Attractiveness Analysis, By Product Type
- 2.2.3. Environmental Mass Spectrometry Market Attractiveness Analysis, By Application
- 2.2.4. Environmental Mass Spectrometry Market Attractiveness Analysis, By End-User
- 2.1. Report Scope (Segments And Key Players)
- Chapter 3. Market Dynamics (DRO)
- 3.1. Market Drivers
- 3.1.1. PFAS Contamination Crisis and Emerging Contaminant Regulation Driving Mass Spectrometry Adoption
- 3.1.2. Strengthening Global Environmental Regulations and Expanding Monitoring Networks
- 3.2. Market Restraints
- 3.3. Market Opportunities
- 3.5. Pestle Analysis
- 3.6. Porter Forces Analysis
- 3.7. Technology Roadmap
- 3.8. Value Chain Analysis
- 3.9. Government Policy Impact Analysis
- 3.10. Pricing Analysis
- 3.1. Market Drivers
- Chapter 4. Environmental Mass Spectrometry Market – By Product Type
- 4.1. Product Type Market Overview, By Product Type Segment
- 4.1.1. Environmental Mass Spectrometry Market Revenue Share, By Product Type, 2025 & 2035
- 4.1.2. Gas Chromatography-Mass Spectrometry (GC-MS and GC-MS/MS)
- 4.1.3. Environmental Mass Spectrometry Share Forecast, By Region (USD Billion)
- 4.1.4. Comparative Revenue Analysis, By Country, 2025 & 2035
- 4.1.5. Key Market Trends, Growth Factors, & Opportunities
- 4.1.6. Liquid Chromatography-Mass Spectrometry (LC-MS/MS, Triple Quadrupole, QTOF)
- 4.1.7. Environmental Mass Spectrometry Share Forecast, By Region (USD Billion)
- 4.1.8. Comparative Revenue Analysis, By Country, 2025 & 2035
- 4.1.9. Key Market Trends, Growth Factors, & Opportunities
- 4.1.10. Inductively Coupled Plasma Mass Spectrometry (ICP-MS, ICP-MS/MS)
- 4.1.11. Environmental Mass Spectrometry Share Forecast, By Region (USD Billion)
- 4.1.12. Comparative Revenue Analysis, By Country, 2025 & 2035
- 4.1.13. Key Market Trends, Growth Factors, & Opportunities
- 4.1.14. Ion Mobility Spectrometry
- 4.1.15. Environmental Mass Spectrometry Share Forecast, By Region (USD Billion)
- 4.1.16. Comparative Revenue Analysis, By Country, 2025 & 2035
- 4.1.17. Key Market Trends, Growth Factors, & Opportunities
- 4.1.18. High-Resolution Mass Spectrometry (Orbitrap, TOF)
- 4.1.19. Environmental Mass Spectrometry Share Forecast, By Region (USD Billion)
- 4.1.20. Comparative Revenue Analysis, By Country, 2025 & 2035
- 4.1.21. Key Market Trends, Growth Factors, & Opportunities
- 4.1.22. Other Product Types (Direct MS, Field-Deployable Systems)
- 4.1.23. Environmental Mass Spectrometry Share Forecast, By Region (USD Billion)
- 4.1.24. Comparative Revenue Analysis, By Country, 2025 & 2035
- 4.1.25. Key Market Trends, Growth Factors, & Opportunities
- 4.1. Product Type Market Overview, By Product Type Segment
- Chapter 5. Environmental Mass Spectrometry Market – By Application
- 5.1. Application Market Overview, By Application Segment
- 5.1.1. Environmental Mass Spectrometry Market Revenue Share, By Application, 2025 & 2035
- 5.1.2. Water Quality Testing (Drinking Water, Groundwater, Surface Water, Wastewater)
- 5.1.3. Environmental Mass Spectrometry Share Forecast, By Region (USD Billion)
- 5.1.4. Comparative Revenue Analysis, By Country, 2025 & 2035
- 5.1.5. Key Market Trends, Growth Factors, & Opportunities
- 5.1.6. Air Quality Monitoring (Ambient Air, Stack Emissions, Indoor Air)
- 5.1.7. Environmental Mass Spectrometry Share Forecast, By Region (USD Billion)
- 5.1.8. Comparative Revenue Analysis, By Country, 2025 & 2035
- 5.1.9. Key Market Trends, Growth Factors, & Opportunities
- 5.1.10. Soil & Sediment Analysis (Contaminated Land, Agricultural Soil)
- 5.1.11. Environmental Mass Spectrometry Share Forecast, By Region (USD Billion)
- 5.1.12. Comparative Revenue Analysis, By Country, 2025 & 2035
- 5.1.13. Key Market Trends, Growth Factors, & Opportunities
- 5.1.14. Food Safety & Contamination Testing (Pesticide Residues, Mycotoxins, Veterinary Drugs)
- 5.1.15. Environmental Mass Spectrometry Share Forecast, By Region (USD Billion)
- 5.1.16. Comparative Revenue Analysis, By Country, 2025 & 2035
- 5.1.17. Key Market Trends, Growth Factors, & Opportunities
- 5.1.18. Industrial Effluent & Process Monitoring
- 5.1.19. Environmental Mass Spectrometry Share Forecast, By Region (USD Billion)
- 5.1.20. Comparative Revenue Analysis, By Country, 2025 & 2035
- 5.1.21. Key Market Trends, Growth Factors, & Opportunities
- 5.1.22. Other Applications (Biota, Emerging Contaminants)
- 5.1.23. Environmental Mass Spectrometry Share Forecast, By Region (USD Billion)
- 5.1.24. Comparative Revenue Analysis, By Country, 2025 & 2035
- 5.1.25. Key Market Trends, Growth Factors, & Opportunities
- 5.1. Application Market Overview, By Application Segment
- Chapter 6. Environmental Mass Spectrometry Market – By End-User
- 6.1. End-User Market Overview, By End-User Segment
- 6.1.1. Environmental Mass Spectrometry Market Revenue Share, By End-User, 2025 & 2035
- 6.1.2. Environmental Testing Laboratories (Accredited Commercial Labs)
- 6.1.3. Environmental Mass Spectrometry Share Forecast, By Region (USD Billion)
- 6.1.4. Comparative Revenue Analysis, By Country, 2025 & 2035
- 6.1.5. Key Market Trends, Growth Factors, & Opportunities
- 6.1.6. Government & Regulatory Agencies (EPA, Environment Agency, CPCB)
- 6.1.7. Environmental Mass Spectrometry Share Forecast, By Region (USD Billion)
- 6.1.8. Comparative Revenue Analysis, By Country, 2025 & 2035
- 6.1.9. Key Market Trends, Growth Factors, & Opportunities
- 6.1.10. Industrial & Manufacturing Facilities
- 6.1.11. Environmental Mass Spectrometry Share Forecast, By Region (USD Billion)
- 6.1.12. Comparative Revenue Analysis, By Country, 2025 & 2035
- 6.1.13. Key Market Trends, Growth Factors, & Opportunities
- 6.1.14. Academic & Research Institutes
- 6.1.15. Environmental Mass Spectrometry Share Forecast, By Region (USD Billion)
- 6.1.16. Comparative Revenue Analysis, By Country, 2025 & 2035
- 6.1.17. Key Market Trends, Growth Factors, & Opportunities
- 6.1.18. Water Utilities & Municipal Authorities
- 6.1.19. Environmental Mass Spectrometry Share Forecast, By Region (USD Billion)
- 6.1.20. Comparative Revenue Analysis, By Country, 2025 & 2035
- 6.1.21. Key Market Trends, Growth Factors, & Opportunities
- 6.1.22. Other End-Users
- 6.1.23. Environmental Mass Spectrometry Share Forecast, By Region (USD Billion)
- 6.1.24. Comparative Revenue Analysis, By Country, 2025 & 2035
- 6.1.25. Key Market Trends, Growth Factors, & Opportunities
- 6.1. End-User Market Overview, By End-User Segment
- Chapter 7. Environmental Mass Spectrometry Market – Regional Analysis
- 7.1. Environmental Mass Spectrometry Market Overview, By Region Segment
- 7.1.1. Global Environmental Mass Spectrometry Market Revenue Share, By Region, 2025 & 2035
- 7.1.2. Global Environmental Mass Spectrometry Market Revenue, By Region, 2026 – 2035 (USD Billion)
- 7.1.3. Global Environmental Mass Spectrometry Market Revenue, By Product Type, 2026 – 2035
- 7.1.4. Global Environmental Mass Spectrometry Market Revenue, By Application, 2026 – 2035
- 7.1.5. Global Environmental Mass Spectrometry Market Revenue, By End-User, 2026 – 2035
- 7.2. North America
- 7.2.1. North America Environmental Mass Spectrometry Market Revenue, By Country, 2026 – 2035 (USD Billion)
- 7.2.2. North America Environmental Mass Spectrometry Market Revenue, By Product Type, 2026 – 2035
- 7.2.3. North America Environmental Mass Spectrometry Market Revenue, By Application, 2026 – 2035
- 7.2.4. North America Environmental Mass Spectrometry Market Revenue, By End-User, 2026 – 2035
- 7.2.5. U.S. Environmental Mass Spectrometry Market Revenue, 2026 – 2035 (USD Billion)
- 7.2.6. Canada Environmental Mass Spectrometry Market Revenue, 2026 – 2035 (USD Billion)
- 7.2.7. Mexico Environmental Mass Spectrometry Market Revenue, 2026 – 2035 (USD Billion)
- 7.2.8. Rest of North America Environmental Mass Spectrometry Market Revenue, 2026 – 2035 (USD Billion)
- 7.3. Europe
- 7.3.1. Europe Environmental Mass Spectrometry Market Revenue, By Country, 2026 – 2035 (USD Billion)
- 7.3.2. Europe Environmental Mass Spectrometry Market Revenue, By Product Type, 2026 – 2035
- 7.3.3. Europe Environmental Mass Spectrometry Market Revenue, By Application, 2026 – 2035
- 7.3.4. Europe Environmental Mass Spectrometry Market Revenue, By End-User, 2026 – 2035
- 7.3.5. Germany Environmental Mass Spectrometry Market Revenue, 2026 – 2035 (USD Billion)
- 7.3.6. France Environmental Mass Spectrometry Market Revenue, 2026 – 2035 (USD Billion)
- 7.3.7. U.K. Environmental Mass Spectrometry Market Revenue, 2026 – 2035 (USD Billion)
- 7.3.8. Russia Environmental Mass Spectrometry Market Revenue, 2026 – 2035 (USD Billion)
- 7.3.9. Italy Environmental Mass Spectrometry Market Revenue, 2026 – 2035 (USD Billion)
- 7.3.10. Spain Environmental Mass Spectrometry Market Revenue, 2026 – 2035 (USD Billion)
- 7.3.11. Netherlands Environmental Mass Spectrometry Market Revenue, 2026 – 2035 (USD Billion)
- 7.3.12. Rest of Europe Environmental Mass Spectrometry Market Revenue, 2026 – 2035 (USD Billion)
- 7.4. Asia Pacific
- 7.4.1. Asia Pacific Environmental Mass Spectrometry Market Revenue, By Country, 2026 – 2035 (USD Billion)
- 7.4.2. Asia Pacific Environmental Mass Spectrometry Market Revenue, By Product Type, 2026 – 2035
- 7.4.3. Asia Pacific Environmental Mass Spectrometry Market Revenue, By Application, 2026 – 2035
- 7.4.4. Asia Pacific Environmental Mass Spectrometry Market Revenue, By End-User, 2026 – 2035
- 7.4.5. China Environmental Mass Spectrometry Market Revenue, 2026 – 2035 (USD Billion)
- 7.4.6. Japan Environmental Mass Spectrometry Market Revenue, 2026 – 2035 (USD Billion)
- 7.4.7. India Environmental Mass Spectrometry Market Revenue, 2026 – 2035 (USD Billion)
- 7.4.8. New Zealand Environmental Mass Spectrometry Market Revenue, 2026 – 2035 (USD Billion)
- 7.4.9. Australia Environmental Mass Spectrometry Market Revenue, 2026 – 2035 (USD Billion)
- 7.4.10. South Korea Environmental Mass Spectrometry Market Revenue, 2026 – 2035 (USD Billion)
- 7.4.11. Taiwan Environmental Mass Spectrometry Market Revenue, 2026 – 2035 (USD Billion)
- 7.4.12. Rest of Asia Pacific Environmental Mass Spectrometry Market Revenue, 2026 – 2035 (USD Billion)
- 7.5. The Middle-East and Africa
- 7.5.1. The Middle-East and Africa Environmental Mass Spectrometry Market Revenue, By Country, 2026 – 2035 (USD Billion)
- 7.5.2. The Middle-East and Africa Environmental Mass Spectrometry Market Revenue, By Product Type, 2026 – 2035
- 7.5.3. The Middle-East and Africa Environmental Mass Spectrometry Market Revenue, By Application, 2026 – 2035
- 7.5.4. The Middle-East and Africa Environmental Mass Spectrometry Market Revenue, By End-User, 2026 – 2035
- 7.5.5. Saudi Arabia Environmental Mass Spectrometry Market Revenue, 2026 – 2035 (USD Billion)
- 7.5.6. UAE Environmental Mass Spectrometry Market Revenue, 2026 – 2035 (USD Billion)
- 7.5.7. Egypt Environmental Mass Spectrometry Market Revenue, 2026 – 2035 (USD Billion)
- 7.5.8. Kuwait Environmental Mass Spectrometry Market Revenue, 2026 – 2035 (USD Billion)
- 7.5.9. South Africa Environmental Mass Spectrometry Market Revenue, 2026 – 2035 (USD Billion)
- 7.5.10. Rest of the Middle East & Africa Environmental Mass Spectrometry Market Revenue, 2026 – 2035 (USD Billion)
- 7.6. Latin America
- 7.6.1. Latin America Environmental Mass Spectrometry Market Revenue, By Country, 2026 – 2035 (USD Billion)
- 7.6.2. Latin America Environmental Mass Spectrometry Market Revenue, By Product Type, 2026 – 2035
- 7.6.3. Latin America Environmental Mass Spectrometry Market Revenue, By Application, 2026 – 2035
- 7.6.4. Latin America Environmental Mass Spectrometry Market Revenue, By End-User, 2026 – 2035
- 7.6.5. Brazil Environmental Mass Spectrometry Market Revenue, 2026 – 2035 (USD Billion)
- 7.6.6. Argentina Environmental Mass Spectrometry Market Revenue, 2026 – 2035 (USD Billion)
- 7.6.7. Rest of Latin America Environmental Mass Spectrometry Market Revenue, 2026 – 2035 (USD Billion)
- 7.1. Environmental Mass Spectrometry Market Overview, By Region Segment
- Chapter 8. Competitive Landscape
- 8.1. Company Market Share Analysis – 2025
- 8.1.1. Global Environmental Mass Spectrometry Market: Company Market Share, 2025
- 8.2. Global Environmental Mass Spectrometry Market Company Market Share, 2024
- 8.1. Company Market Share Analysis – 2025
- Chapter 9. Company Profiles
- 9.1. Thermo Fisher Scientific Inc.
- 9.1.1. Company Overview
- 9.1.2. Key Executives
- 9.1.3. Product Portfolio
- 9.1.4. Financial Overview
- 9.1.5. Operating Business Segments
- 9.1.6. Business Performance
- 9.1.7. Recent Developments
- 9.2. Waters Corporation
- 9.3. Agilent Technologies Inc.
- 9.4. Sciex (Danaher Corporation)
- 9.5. Shimadzu Corporation
- 9.6. PerkinElmer Inc. (Revvity)
- 9.7. Bruker Corporation
- 9.8. JEOL Ltd.
- 9.9. Inficon Holding AG
- 9.10. 908 Devices, Inc.
- 9.11. Microsaic Systems plc
- 9.12. Others.
- 9.1. Thermo Fisher Scientific Inc.
- Chapter 10. Research Methodology
- 10.1. Research Methodology
- 10.2. Secondary Research
- 10.3. Primary Research
- 10.3.1. Analyst Tools and Models
- 10.4. Research Limitations
- 10.5. Assumptions
- 10.6. Insights From Primary Respondents
- 10.7. Why Custom Market Insights
- Chapter 11. Standard Report Commercials & Add-Ons
- 11.1. Customization Options
- 11.2. Subscription Module For Market Research Reports
- 11.3. Client Testimonials
List Of Figures
Figures No 1 to 34
List Of Tables
Tables No 1 to 46
Prominent Player
- Thermo Fisher Scientific Inc.
- Waters Corporation
- Agilent Technologies Inc.
- Sciex (Danaher Corporation)
- Shimadzu Corporation
- PerkinElmer Inc. (Revvity)
- Bruker Corporation
- JEOL Ltd.
- Inficon Holding AG
- 908 Devices Inc.
- Microsaic Systems plc
- Others
FAQs
The key players in the market are Thermo Fisher Scientific Inc., Waters Corporation, Agilent Technologies Inc., Sciex (Danaher Corporation), Shimadzu Corporation, PerkinElmer Inc. (Revvity), Bruker Corporation, JEOL Ltd., Inficon Holding AG, 908 Devices Inc., Microsaic Systems plc, Others.
The most significant demand driver in the market of environmental mass spectrometry is government regulations, which act in the form of environmental quality standards that establish the maximum level of contaminants that must be analytically verified, approved methods of analysis that dictate the technology of the instruments that must be used to conduct regulatory compliance testing, accreditation of environmental testing laboratories that require them to demonstrate the ability to perform instruments, and conditions that must be met by industrial permits that require that facilities monitor their contaminant levels at defined frequencies using approved methods of analysis. The U.S. EPA program of analytical methods, which has published and maintained the authoritative EPA methods of environmental compliance testing, is effective in defining instrument technology requirements of the U.S. environmental testing market, with each method specifying minimum instrument detection limit requirements, quality control requirements, and instrument performance verification procedures driving procurement to platforms capable of supporting method requirements. The Water Framework Directive Environmental Quality Standards of the EU- a set of annual average and maximum allowable concentrations in surface water of priority substances to be attained by EU member states – is the force behind the analysis method choice and the purchase of analytical instruments within the government environmental monitoring laboratories of the 27 EU member states. The ISO/IEC 17025 accreditation standard of the International Organization of Standard refers to the accreditation of environmental testing laboratories by national accreditation agencies such as UKAS, DAkkS, COFRAC and A2LA, which mandates that a laboratory demonstrate the performance of instruments by showing the method validation and proficiency testing and quality control monitoring that, effectively, require modern and calibrated mass spectrometry instruments meeting current method performance requirements. New regulatory regimes such as the new national environmental standards in China that feature mass spectrometry methods, updated effluent discharge standards in India on industrial plants, and the continuing adoption of the WHO drinking water standards in the Southeast Asian countries are generating new regulatory-based instrument purchasing demand in traditional less-regulated markets that are adding to the rapid market growth trend in the Asia Pacific.
The price of environmental mass spectrometry instruments covers a great variety of prices depending on the technology platforms, performance, and need of use. The cheaper entry-level single quadrupole GC-MS systems (general organic compound environmental monitoring) cost USD 35,000 to USD 80,000 per system making them affordable to smaller regional testing laboratories and industrial facility monitoring programs with typical sensitivity needs. High-sensitivity priority pollutants Multiple systems Mid-range, triple quadrupole GC-MS/MS systems, such as dioxins, furans, and monitoring chlorinated pesticides, have a price of USD 100,000-250,000 per system, which is compensated by the increased sensitivity and selectivity over single quadrupole systems when used in regulatory analysis contexts that require confirmation-quality analytical data. PFAS, pesticide residues, and pharmaceutical compounds environmental analysis PFAS, pesticides residue, and pharmaceutical compound environmental systems Triple quadrupole LC-MS/MS instruments Triple quadrupole LC-MS/MS Triple quadrupole LC-MS/MS Triple quadrupole LC-MS/MS Triple quadrupole LC-MS/MS Triple quadrupole LC-MS/MS Triple quadrupole LC-MS/MS Triple quadrupole LC-MS/MS Triple quadrupole L HRMS systems with high resolution, such as Orbitrap and QTOF are available at a price of USD 300,000 to USD 600,000 per system, which is quite costly when compared to triple quadrupole systems, owing to the realized high mass accuracy, resolving power, and non-targeted screening capability that justifies installation in labs where comprehensive emerging contaminant surveillance is more important than focused regulatory compliance testing. ICP-MS trace metal analysis systems range between USD 80,000 and USD 350,000 depending on the single-quadrupole or triple quadrupole setup. The commercially relevant parameter of environmental testing laboratory procurement is the total cost of ownership, which includes instrument purchase price; costs of annual service contracts (USD 15,000-USD 35,000); consumable costs such as columns, standards, and gases; and fully burdened laboratory operation cost per sample, with instrument purchase price approaching 40-50% of the total cost of ownership over five years.
This is projected to reach USD 6.47 billion by 2035 due to the implementation of PFAS regulatory programs creating a long-term, decade-old LC-MS/MS instrument-buying wave as the compliance-driven testing programs scale across public water systems, commercial labs, and other industrial facilities worldwide, non-targeted HRMS environmental screening programs transitioning to routine commercial laboratory practice, and field-deployable mass spectrometry scaling between niche early adoption and mainstream contaminated site investigation practice as instrument performance is refined and cost-reduced; and Asia Pacific environmental regulations frameworks.
The highest share of revenue is likely to be located in North America, a market that is expected to command about 38% of the global market share within the forecast period owing to the EPA PFAS MCL finalization forming the first significant unitary regulatory driver of environmental mass spectrometric instrument demand in the present market cycle, the United States being the largest commercial maker of environmental testing laboratories in the world on the basis of the extensive Eurofins, Bureau Veritas, SGS, and Intertek laboratory networks, and the largest Superfund contaminated site investigation and remediation program in the world driving it.
Asia Pacific will have the highest CAGR of 10.2% over the forecast period as the Ministry of Ecology and Environment national monitoring center network of China will receive significant capital investment in the modern mass spectrometry instrumentation industry; India will have its National Clean Air Programme strategy of 40% reduction in particulate matter providing air quality measurement infrastructure investment such as air toxics mass spectrometry capability, Japan will have its world-leading environment analytical instrument manufacturing industry and advanced domestic environmental monitoring sector, South Korea will experience expansion in environmental protection investment with an increasing commercial testing laboratory sector; and Australia has industrial contamination assessment obligations, including PFAS investigation at former defense and industrial sites, creating substantial LC-MS/MS demand from commercial environmental testing laboratories.
It is estimated that the Global Environmental Mass Spectrometry Market will have a significant growth with the release of maximum contaminant levels of six PFAS compounds in drinking water by the U.S EPA in April 2024, establishing maximum contaminant levels of 4 ppt in PFOA and 4 ppt in PFOS, the establishment of a total PFAS sum parameter of 100 ppt in the EU Drinking Water Directive with the creation of a total parameter requiring mass spectrometry analysis instrumentation, the non-targeted screening of human resource by HRMS screening enabling detection of thousands of compounds simultaneously transforming environmental chemical surveillance from targeted to comprehensive approaches, triple quadrupole ICP-MS/MS resolving spectral interferences enabling accurate determination of arsenic, selenium, and other regulated metals at ultra-trace levels in complex environmental matrices, the EPA’s Unregulated Contaminant Monitoring Rule generating pre-regulatory testing volumes that sustain commercial laboratory instrument utilization between formal compliance testing cycles, China’s 14th Five-Year Plan environmental quality improvement targets driving sustained government investment in national monitoring center instrumentation, and industrial fence-line air monitoring regulatory requirements under the EPA’s Fenceline Air Monitoring Rule creating direct mandates for industrial facility mass spectrometry instrument procurement.