Para Bromo Benzoic Acid Market Size, Trends and Insights By Grade (Pharmaceutical Grade (≥99.0% Purity, GMP-Compliant, DMF-Supported), Technical Grade (95–99% Purity, Industrial Applications), Electronic Grade (≥99.9% Purity, Ultra-Low Metal Content), Other Grades (Research Grade, Custom Synthesis)), By Application (Pharmaceuticals & Active Pharmaceutical Ingredients (API Synthesis, Drug Discovery, Medicinal Chemistry), Agrochemicals (Herbicide Intermediates, Fungicide Synthesis, Nematocide Intermediates), Dyes & Pigments (Azo Dye Intermediates, Coupling Components), Organic Synthesis & Chemical Intermediates (Cross-Coupling Reactions, Esterification, Amide Synthesis), Electronic Materials (OLED Intermediates, Organic Semiconductors), Other Applications (Laboratory Reagent, Academic Research)), By End-Use Industry (Pharmaceutical & Biotechnology, Agriculture (Crop Protection), Specialty Chemicals (Dyes, Electronic Materials, Performance Chemicals), Academic & Research Institutions, Other Industries (Cosmetics, Food Additive Research, Polymer Chemistry)), and By Region - Global Industry Overview, Statistical Data, Competitive Analysis, Share, Outlook, and Forecast 2026 – 2035
Report Snapshot
CAGR: 5.2%
| Study Period: | 2026-2035 |
| Fastest Growing Market: | Asia Pacific |
| Largest Market: | Asia Pacific |
Major Players
- Sigma-Aldrich (Merck KGaA)
- TCI Chemicals
- Alfa Aesar (Thermo Fisher Scientific)
- Tokyo Chemical Industry Co. Ltd.
- Others
Reports Description
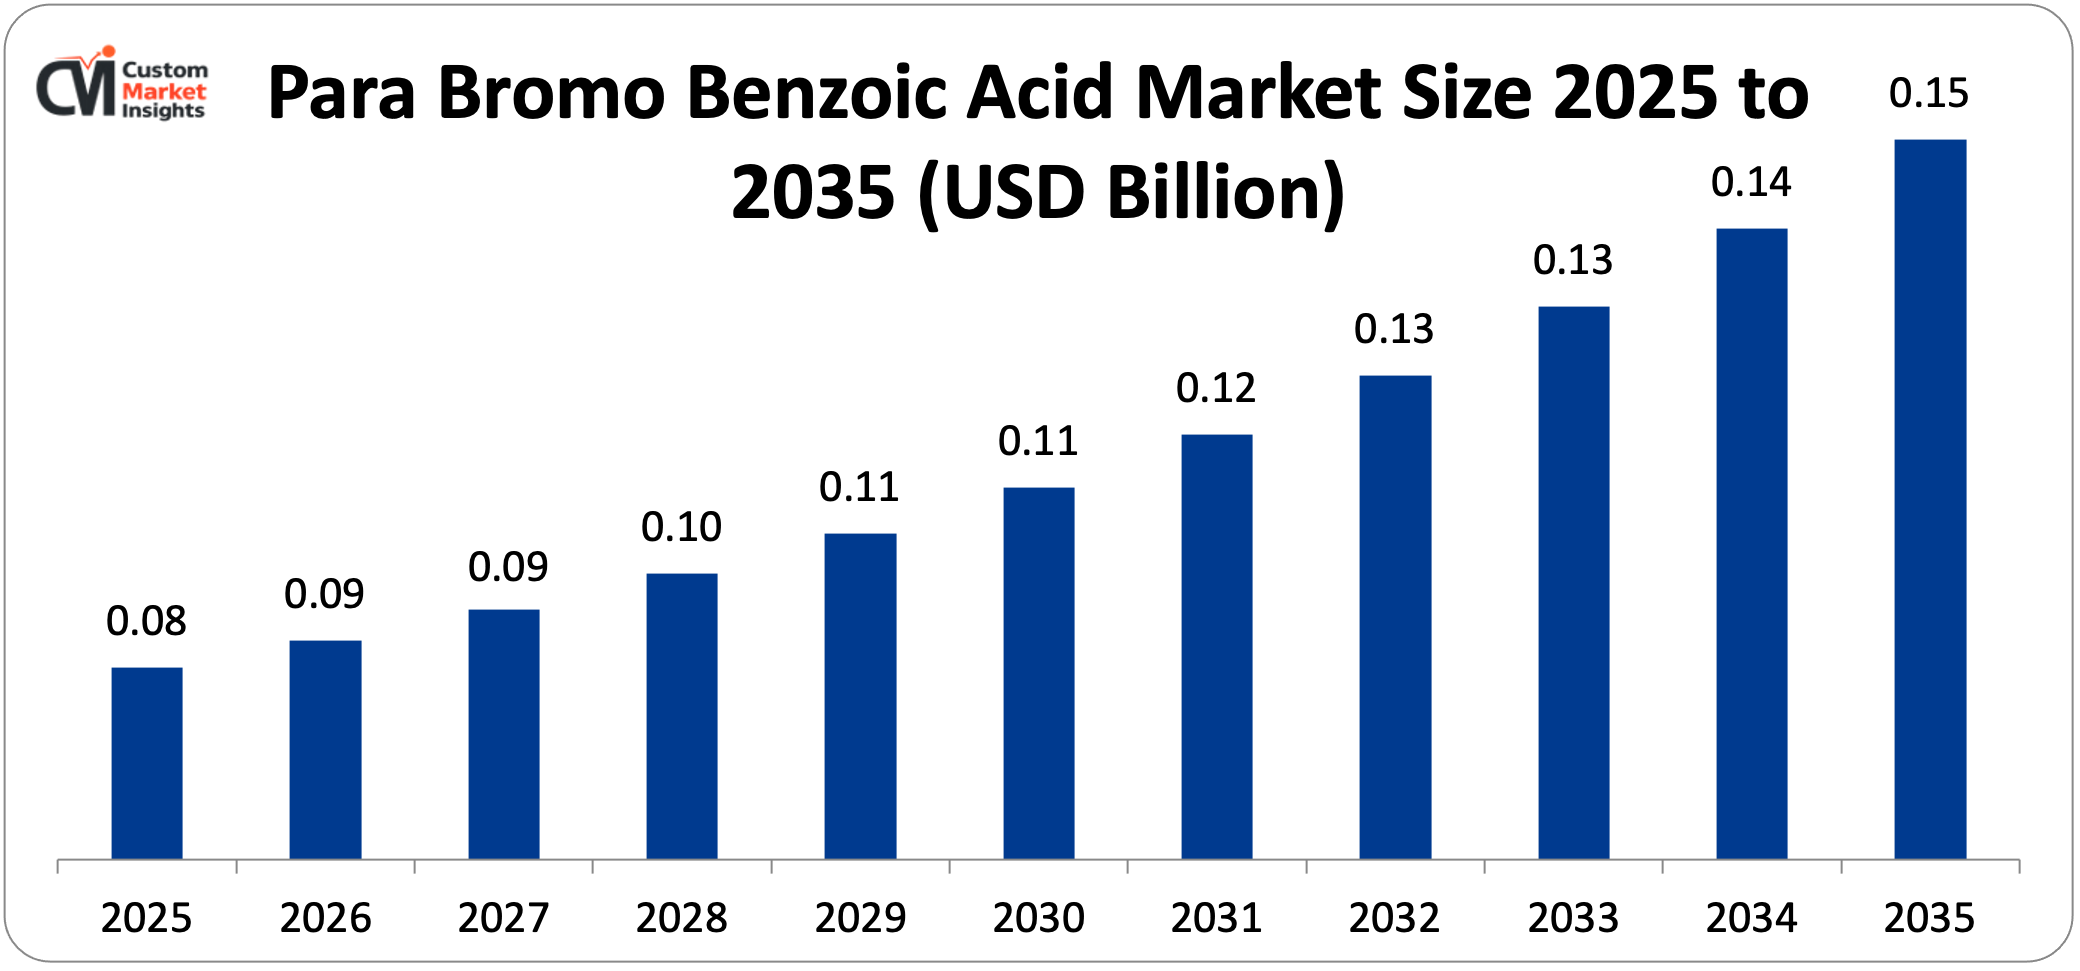
The global market for para bromo benzoic acid is expected to grow from USD 89.8 million in 2026 to about USD 148.4 million by 2035, at a CAGR of 5.2% from 2026 to 2035. The growing pharmaceutical industry demand for para bromo benzoic acid as a critical building block in the synthesis of active pharmaceutical ingredients across cardiovascular, anti-infective, and central nervous system drug categories where the para-bromo substituted benzoic acid moiety provides essential pharmacophore contributions to drug molecule design, the expanding agrochemical sector’s utilization of para bromo benzoic acid as a key intermediate in herbicide and fungicide synthesis where its electron-withdrawing bromo substituent and carboxylic acid functionality enable the chemical transformations required for modern agrochemical compound construction, the progressive growth of specialty dye and pigment applications leveraging para bromo benzoic acid’s reactive functional groups for coupling reactions and intermediate synthesis, the increasing global generic pharmaceutical manufacturing in India and China driving demand for cost-competitive fine chemical intermediates including para bromo benzoic acid, and the continuous expansion of organic synthesis applications across academic and industrial research programs collectively drive robust and sustained market growth throughout the forecast period.
Market Highlight
- In 2025, Asia Pacific had the biggest share of the para bromo benzoic acid market, with 48%.
- Between 2026 and 2035, North America is expected to grow at a rate of 4.8% per year.
- By grade, the pharmaceutical grade segment had about 54% of the market share in 2025.
- The technical grade segment is growing at a CAGR of 4.6% from 2026 to 2035.
- The pharmaceuticals and active pharmaceutical ingredients segment had the largest market share in 2025, accounting for 46% of the total.
Significant Growth Factors
The Para Bromo Benzoic Acid Market Trends present significant growth opportunities due to several factors:
- Pharmaceutical API Synthesis Driving Premium-Grade Demand: The pharmaceutical industry’s sustained demand for para bromo benzoic acid as a critical synthetic intermediate — serving as a pivotal building block in the preparation of a diverse range of active pharmaceutical ingredients through palladium-catalyzed Suzuki coupling, Buchwald-Hartwig amination, and direct esterification reactions that exploit the para-bromo substituent’s reactivity—is the most commercially significant demand driver for the high-purity pharmaceutical grade segment of the para bromo benzoic acid market, with each new pharmaceutical compound incorporating a 4-bromophenyl or 4-carboxyphenyl pharmacophore potentially creating substantial recurring demand for para bromo benzoic acid across the compound’s discovery, development, and commercial manufacturing phases. For pharmaceutical use, para bromo benzoic acid must meet strict purity standards, usually exceeding 99.0% purity by HPLC. There are also strict limits on related impurities like isomeric ortho and meta bromo benzoic acids, residual bromine, and heavy metal contaminants. These standards set pharmaceutical-grade products apart from technical-grade materials and come with high prices that reflect the investment in advanced purification and quality documentation that GMP-compliant pharmaceutical intermediate manufacturing requires. The expansion of generic pharmaceutical manufacturing is increasing the demand for cost-competitive pharmaceutical-grade para bromo benzoic acid supplied under DMF-registered or GMP-audited conditions that support API manufacturers’ own regulatory submissions. This is because Indian API manufacturers like Sun Pharmaceutical, Dr. Reddy’s Laboratories, Aurobindo Pharma, and Cipla and Chinese API manufacturers like Zhejiang Huahai Pharmaceutical, Hunan Hualong Pharmaceutical, and similar fine chemical producers are all expanding their API manufacturing capacity to serve global generic pharmaceutical supply chains. The drug discovery application—where para bromo benzoic acid is used as a fragment or building block in combinatorial chemistry library synthesis, structure-activity relationship exploration, and medicinal chemistry analog preparation at pharmaceutical research institutions and CROs—creates demand that, while small for each program, adds up to a lot when you consider the thousands of active drug discovery programs around the world that might use brominated benzoic acid derivatives as synthetic intermediates.
- Agrochemical Synthesis Intermediate Demand and Crop Protection Expansion: The growing global demand for modern crop protection products — including selective herbicides, systemic fungicides, and nematocides whose active ingredient synthesis requires halogenated aromatic acid intermediates — is creating a structurally growing agrochemical demand for para bromo benzoic acid as a key synthetic starting material whose brominated aryl carboxylic acid structure provides the chemical foundation for constructing the benzoyl, aryl ether, and aryl amine functionalities present in multiple commercial herbicide and fungicide active ingredients. Para bromo benzoic acid is used to make a number of different types of herbicides, such as benzoyloxy herbicides, arylcarboxylic acid herbicides, and heterocyclic herbicides that have 4-bromophenyl groups. The para-bromo group can undergo nucleophilic aromatic substitution or metal-catalyzed coupling to add the heteroatom-containing ring systems that are typical of modern selective herbicide pharmacophores. The global agrochemical market is still growing. This is because we need to feed a projected global population of 9.7 billion by 2050, which means we need to optimize yields on existing farmland through effective crop protection. At the same time, we need to develop new active ingredients to replace older chemicals that are no longer effective. This means that there is still a need for new agrochemical intermediate synthesis, which para bromo benzoic acid helps with in the discovery, scale-up, and commercial production phases of agrochemical development. India’s agricultural sector is growing, and the Indian crop protection market is one of the fastest-growing in the world. This is because more farmers are becoming aware of how pests and diseases can hurt their crops, and government subsidy programs are helping farmers buy crop protection products. As a result, Indian agrochemical manufacturers are seeing more demand for intermediates like para bromo benzoic acid.
What are the Major Advances Changing the Para Bromo Benzoic Acid Market Today?
- Continuous Flow Chemistry Manufacturing Improving Production Economics: The progressive adoption of continuous flow chemistry manufacturing approaches for para bromo benzoic acid production — replacing conventional batch bromination of benzoic acid in stirred tank reactors with flow chemistry systems that pass benzoic acid solution continuously through tubular reactor channels where controlled bromine addition achieves selective para-bromination under optimized temperature and residence time conditions — is improving the selectivity of para isomer formation, reducing the ortho and meta bromination byproduct generation that requires subsequent purification effort, improving heat management during the exothermic bromination reaction, and enabling safer handling of liquid bromine under the controlled conditions that flow chemistry equipment provides relative to conventional batch addition. Optimized continuous flow bromination takes advantage of the kinetic and thermodynamic selectivity benefits of isothermal, well-mixed flow reactor conditions over the temperature and concentration gradients that batch bromination creates. This improves para versus ortho/meta selectivity and lowers the purification burden needed to achieve pharmaceutical-grade para isomer purity. With optimized flow processes, the crude product para isomer content is over 95%, compared to 85–90% for conventional batch bromination. This reduces recrystallization solvent use and product loss which are the significant cost drivers of economies of pharmaceutical-grade production. In the context of broader modernization initiatives of their manufacturing operations, major fine chemical companies are making investments in flow chemistry reactor systems to produce para bromo benzoic acid. These systems enhance the consistency of the products, reduce the exposure of operators to hazardous bromine reagents, reduce waste per kilogram of product, and enable continuous production campaigns that utilize equipment more efficiently than the batch-campaign scheduling.
- Green Chemistry Approaches and Bromine Atom Economy Improvement: The growing use of green chemistry principles in the production of para bromo benzoic acid—such as catalytic bromination methods that use N-bromosuccinimide or hydrogen bromide with oxidant systems that achieve more selective and atom-economical bromination than stoichiometric molecular bromine addition, solvent system optimization that replaces halogenated solvents with water-miscible alternatives that make waste treatment easier, and process intensification that lowers energy use per kilogram of product—shows both the chemical industry’s need to be more sustainable and the practical business reason to lower raw material and waste treatment costs that make up a large part of the cost of making para bromo benzoic acid. The N-bromosuccinimide catalytic bromination approach — in which NBS provides the brominating species in a controlled manner that achieves superior para selectivity compared to molecular bromine under equivalent reaction conditions — is gaining commercial adoption for pharmaceutical-grade production despite NBS’s higher raw material cost relative to molecular bromine, justified by the selectivity advantage that reduces purification cost and the safer handling profile that reduces process safety management requirements. Aqueous or aqueous-organic biphasic reaction systems for para bromo benzoic acid synthesis—utilizing benzoic acid’s variable solubility in water at different pH levels to facilitate product isolation through pH adjustment instead of organic solvent extraction—are decreasing solvent usage and enhancing product isolation efficiency in manufacturing processes where solvent expenses and waste treatment are major contributors to production costs per kilogram.
- Purity Analytical Characterization Advancement for Pharmaceutical Applications: The progressive refinement of analytical characterization methods for pharmaceutical-grade para bromo benzoic acid — incorporating comprehensive HPLC isomer impurity profiling, inductively coupled plasma mass spectrometry for heavy metal trace element analysis, residual solvent determination by GC headspace, Karl Fischer moisture determination, and thermal analysis for polymorph identification — is enabling pharmaceutical intermediate suppliers to provide the comprehensive analytical documentation packages that pharmaceutical API manufacturers require for ICH Q3A-compliant impurity qualification of drug substance manufacturing processes. The requirement for pharmaceutical-grade quality documentation, which includes a certificate of analysis with test results for all specified quality attributes, method validation reports showing that an analytical method is suitable, batch-to-batch consistency data supporting process validation, and stability data supporting shelf life specification, is a large investment in quality management infrastructure that dedicated pharmaceutical fine chemical manufacturers have made. This sets their pharmaceutical-grade product apart from technical-grade material made by commodity chemical manufacturers who don’t have the same quality systems. As more and more pharmaceutical companies require quality audits of their API manufacturers, such as GMP facility audits, quality system documentation reviews, and on-site inspections, the para bromo benzoic acid market is becoming more tiered. This rewards manufacturers with thorough quality systems and ensures a steady supply of API manufacturers through relationships with qualified suppliers.
Category Wise Insights
By Grade
Why Does Pharmaceutical Grade Lead the Market?
In 2025, pharmaceutical grade will be the largest grade segment, making up about 54% of the total market share. This is because pharmaceutical applications are the highest-value end use for para bromo benzoic acid, with prices ranging from USD 25 to USD 80 per kilogram compared to USD 8 to USD 20 per kilogram for technical-grade material. This is because pharmaceutical-grade production requires a lot of purification, quality testing, documentation, and regulatory compliance, which pharmaceutical API manufacturers must also provide to support their own regulatory submissions. The pharmaceutical grade market is worth more than the technical grade market, even though the technical grade market is bigger. This is because fine chemical markets have application-specific quality requirements that create price differences that keep premium segments alive even though they don’t contribute much to unit volume. The increasing production of generic drugs in India and China, along with regulatory frameworks like the US FDA’s Drug Master File system and the European Directive 2001/83/EC, which require documentation of the quality and manufacturing of pharmaceutical intermediates, is structurally driving up the demand for pharmaceutical-grade para bromo benzoic acid. This is because API manufacturers need to get their materials from documented quality systems that support their own regulatory filings. Technical grade makes up about 38% of the market. It is used in agrochemical synthesis, dye intermediates, and general organic synthesis where the absolute purity requirement of pharmaceutical applications is not needed. The lower price of technical-grade materials makes them a good choice for cost-sensitive industrial synthesis applications.
By Application
Why Does Pharmaceuticals & API Segment Lead the Market?
Pharmaceuticals and active pharmaceutical ingredients make up the biggest application segment, with about 46% of the total market share in 2025. This is because the pharmaceutical industry uses para-bromo benzoic acid as a starting material and intermediate in the synthesis of many approved drug classes. The para-bromo benzoic acid structural element is found in the synthesis routes of cardiovascular drugs, kinase inhibitor oncology agents, anti-infective compounds, and CNS active molecules. This means that there is a steady and large demand for pharmaceutical-grade para-bromo benzoic acid supply. The Suzuki coupling reaction application is the most common use of para bromo benzoic acid in pharmaceuticals. In this reaction, the C-Br bond in para bromo benzoic acid undergoes palladium-catalyzed cross-coupling with aryl and heteroaryl boronic acids to make the biaryl and aryl-heterocycle pharmacophores found in many approved drugs. The Suzuki method is well-known for its ability to tolerate the carboxylic acid functional group, which makes it easier to do sequential coupling and carboxylic acid chemistry without having to change protecting groups, which makes multi-step pharmaceutical synthesis routes easier. The organic synthesis and chemical intermediates market is growing the fastest, at a CAGR of 6.4% from 2026 to 2035. This is because the research chemical and specialty synthesis market is expanding, and para bromo benzoic acid is a useful starting material for academic research, custom synthesis services, and specialty chemical preparation programs. All of these things together create growing aggregate demand across thousands of small-scale, but many, applications.
By End-Use Industry
Why Does the Pharmaceutical & Biotechnology Segment Lead the Market?
The pharmaceutical and biotechnology end-use segment is the largest, with about 48% of the market share in 2025. This is because the highest-value para bromo benzoic acid consumption happens in pharmaceutical manufacturing operations, where the unit price premium of pharmaceutical-grade material and the large commercial manufacturing volumes of established APIs that use para bromo benzoic acid-derived pharmacophores combine to make a lot of money for the market. The agriculture segment is growing the fastest, at a rate of 5.8% per year from 2026 to 2035. This is because the agrochemical industry is always developing new active ingredients to deal with the evolution of herbicide resistance. There are major cases of herbicide resistance in over 500 weed biotypes around the world, which means that new mode-of-action herbicides need to be developed. This creates a demand for new synthesis intermediates like para bromo benzoic acid. At the same time, the global crop protection market is growing in Asia, Africa, and Latin America, where agricultural intensification is leading to more herbicide and fungicide use.
Report Scope
| Feature of the Report | Details |
| Market Size in 2026 | USD 89.8 million |
| Projected Market Size in 2035 | USD 148.4 million |
| Market Size in 2025 | USD 81.3 million |
| CAGR Growth Rate | 5.2% CAGR |
| Base Year | 2025 |
| Forecast Period | 2026-2035 |
| Key Segment | By Grade, Application, End-Use Industry and Region |
| Report Coverage | Revenue Estimation and Forecast, Company Profile, Competitive Landscape, Growth Factors and Recent Trends |
| Regional Scope | North America, Europe, Asia Pacific, Middle East & Africa, and South & Central America |
| Buying Options | Request tailored purchasing options to fulfil your requirements for research. |
Regional Analysis
How Big is the Asia Pacific Market Size?
The market for para bromo benzoic acid in the Asia Pacific region is expected to be worth USD 40.6 million in 2025 and grow to about USD 72.4 million by 2035, with a CAGR of 5.9% from 2026 to 2035.
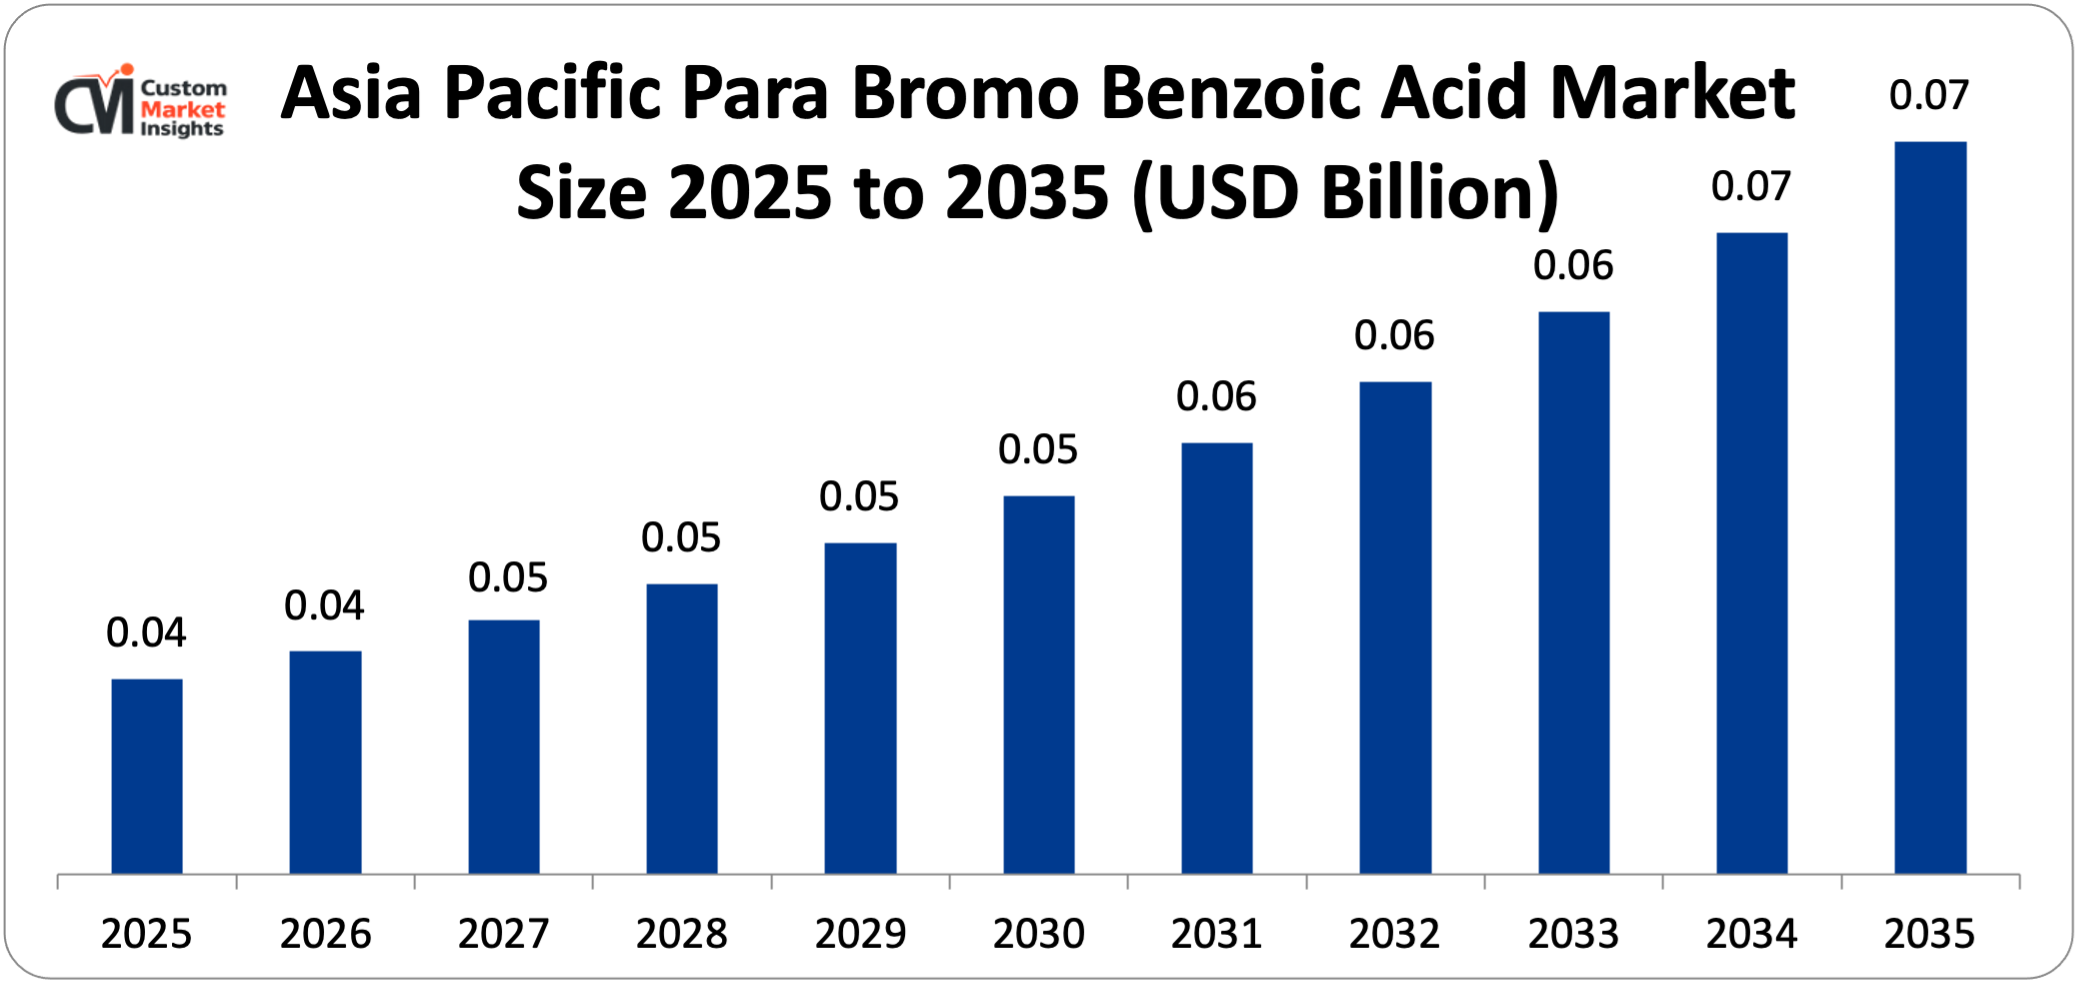
Why Did Asia Pacific Dominate the Market in 2025?
In 2025, Asia Pacific will have about 48% of the world’s market share. This is because the region has the largest manufacturing capacity for para bromo benzoic acid and the fastest-growing end-use demand. For example, Chinese fine chemical manufacturers like Haihang Industry, Nanjing Chemlin, and several specialty chemical producers in Zhejiang and Jiangsu provinces make up the world’s largest production base for halogenated benzoic acid intermediates. Indian pharmaceutical and agrochemical manufacturers make up the fastest-growing customer base for pharmaceutical-grade para bromo benzoic acid in both domestic applications and export-oriented API manufacturing.
China is the world’s largest producer of fine chemicals, making a large part of the world’s supply of pharmaceutical and agrochemical intermediates at prices that are competitive because of the country’s large brine deposits in Shandong province, which allow for domestic bromine production. China’s integrated chemical manufacturing clusters make the supply chain more efficient, and large-scale production gives manufacturers cost advantages. Because of all of this, Chinese manufacturers are the main source of both technical-grade and pharmaceutical-grade para bromo benzoic acid in all major importing markets.
India’s para bromo benzoic acid market is expected to grow at a CAGR of 6.8% through 2035. This is because the country’s pharmaceutical API export industry supplies a large part of the global generic drug markets, the domestic agrochemical manufacturing sector supplies both Indian farmers and export markets, and the Indian specialty chemical industry is growing. The combination of API manufacturing expansion and agrochemical industry growth will keep intermediate demand growing.
Why is North America an Important Market?
The North American para bromo benzoic acid market is expected to be worth about USD 18.2 million in 2025 and grow at a rate of 5.0% per year to reach about USD 29.6 million by 2035. The pharmaceutical and biotech sectors drive demand in North America’s market. U.S. pharmaceutical companies, CROs, and academic research institutions are the biggest customers for pharmaceutical and research-grade para bromo benzoic acid. Most of it comes from domestic distributors and direct international manufacturers.
The U.S. pharmaceutical industry’s strategic sourcing diversification is being driven by worries about supply chain resilience after COVID-19 supply disruptions showed how risky it is to have single-source or geographically concentrated intermediate supply chains. This is making pharmaceutical companies qualify multiple suppliers, including North American sources, for important intermediates like para bromo benzoic acid. This is creating market conditions that are good for North American fine chemical manufacturing investment.
Why is Europe a Strategically Important Market?
The European para bromo benzoic acid market is worth about USD16.8 million in 2025 and is expected to grow at a rate of 5.0% per year to reach about USD27.4 million by 2035. Europe is a strategically important market because it has a lot of major pharmaceutical companies like Roche, Novartis, Bayer, AstraZeneca, and Sanofi and their extensive networks of fine chemical suppliers that create demand for pharmaceutical-grade para bromo benzoic acid. The European agrochemical industry is anchored by BASF, Bayer CropScience, and Syngenta, whose R&D synthesis programs use para bromo benzoic acid to develop new active ingredients.
European REACH regulation requirements for chemical substances make it hard for new suppliers to enter the market, which favors established suppliers with complete regulatory documentation packages. Germany has the largest national para bromo benzoic acid market in Europe because it has a lot of pharmaceutical and fine chemical manufacturing. The UK, France, and Switzerland also have big markets because they have a lot of pharmaceutical companies.
Why is the Middle East & Africa Region an Emerging Market?
The para bromo benzoic acid market in the LAMEA region is slowly but surely growing. This is mostly because pharmaceutical and agrochemical manufacturing is growing in India, which is geographically part of Asia Pacific but is the most important supply and demand dynamic in the broader South Asian context.
Other factors include growing investment in pharmaceutical manufacturing in Saudi Arabia and the UAE through healthcare localization programs, Israel’s large pharmaceutical and agrochemical R&D activities creating research-grade demand, Brazil’s large generic pharmaceutical and agrochemical manufacturing sector being the largest Latin American market for pharmaceutical intermediates like para bromo benzoic acid, and South Africa’s pharmaceutical manufacturing sector serving the African regional pharmaceutical distribution market.
Top Players in the Market and Their Offerings
- Sigma-Aldrich (Merck KGaA)
- TCI Chemicals
- Alfa Aesar (Thermo Fisher Scientific)
- Tokyo Chemical Industry Co. Ltd.
- Biosynth Carbosynth
- Acros Organics (Thermo Fisher Scientific)
- Santa Cruz Biotechnology Inc.
- Oakwood Chemical
- Combi-Blocks Inc.
- Haihang Industry Co. Ltd.
- Nanjing Chemlin Chemical Industry Co. Ltd.
- Others
Key Developments
The market has changed a lot as manufacturers work to make production more efficient, add more pharmaceutical-grade capabilities, and meet the rising global demand for pharmaceutical, agrochemical, and specialty chemical synthesis applications.
- In August 2024: Haihang Industry announced that it had finished expanding the capacity of its Jinan, China, manufacturing facility. This increased the production capacity of para bromo benzoic acid by about 40% by installing a new continuous flow bromination reactor system to replace the old batch bromination equipment.
- In January 2025: Biosynth Carbosynth said it was adding three new ultra-high purity specifications to its para bromo benzoic acid product line: Electronic Grade (≥99.9% purity, ≤1 ppm each Pd, Ni, Fe, Cu), OLED Synthesis Grade (≥99.95% purity, ≤0.5 ppm total transition metals), and Deuterium-Labeled Research Grade (4-bromobenzoic acid-d4 for NMR and mass spectrometry applications).
- In March 2025: the European Chemicals Agency published new requirements for para bromo benzoic acid’s REACH registration dossier. These requirements came after the Community Rolling Action Plan’s substance evaluation review was finished. They required registrants to provide more ecotoxicological data for aquatic chronic toxicity, more biodegradation study data, and reproductive toxicity screening study results within a 24-month compliance deadline.
The Para Bromo Benzoic Acid Market is segmented as follows:
By Grade
- Pharmaceutical Grade (≥99.0% Purity, GMP-Compliant, DMF-Supported)
- Technical Grade (95–99% Purity, Industrial Applications)
- Electronic Grade (≥99.9% Purity, Ultra-Low Metal Content)
- Other Grades (Research Grade, Custom Synthesis)
By Application
- Pharmaceuticals & Active Pharmaceutical Ingredients (API Synthesis, Drug Discovery, Medicinal Chemistry)
- Agrochemicals (Herbicide Intermediates, Fungicide Synthesis, Nematocide Intermediates)
- Dyes & Pigments (Azo Dye Intermediates, Coupling Components)
- Organic Synthesis & Chemical Intermediates (Cross-Coupling Reactions, Esterification, Amide Synthesis)
- Electronic Materials (OLED Intermediates, Organic Semiconductors)
- Other Applications (Laboratory Reagent, Academic Research)
By End-Use Industry
- Pharmaceutical & Biotechnology
- Agriculture (Crop Protection)
- Specialty Chemicals (Dyes, Electronic Materials, Performance Chemicals)
- Academic & Research Institutions
- Other Industries (Cosmetics, Food Additive Research, Polymer Chemistry)
Regional Coverage:
North America
- U.S.
- Canada
- Mexico
- Rest of North America
Europe
- Germany
- France
- U.K.
- Russia
- Italy
- Spain
- Netherlands
- Rest of Europe
Asia Pacific
- China
- Japan
- India
- New Zealand
- Australia
- South Korea
- Taiwan
- Rest of Asia Pacific
The Middle East & Africa
- Saudi Arabia
- UAE
- Egypt
- Kuwait
- South Africa
- Rest of the Middle East & Africa
Latin America
- Brazil
- Argentina
- Rest of Latin America
Table of Contents
- Chapter 1. Report Introduction
- 1.1. Report Description
- 1.1.1. Purpose of the Report
- 1.1.2. USP & Key Offerings
- 1.2. Key Benefits For Stakeholders
- 1.3. Target Audience
- 1.4. Report Scope
- 1.1. Report Description
- Chapter 2. Market Overview
- 2.1. Report Scope (Segments And Key Players)
- 2.1.1. Para Bromo Benzoic Acid by Segments
- 2.1.2. Para Bromo Benzoic Acid by Region
- 2.2. Executive Summary
- 2.2.1. Market Size & Forecast
- 2.2.2. Para Bromo Benzoic Acid Market Attractiveness Analysis, By Grade
- 2.2.3. Para Bromo Benzoic Acid Market Attractiveness Analysis, By Application
- 2.2.4. Para Bromo Benzoic Acid Market Attractiveness Analysis, By End-Use Industry
- 2.1. Report Scope (Segments And Key Players)
- Chapter 3. Market Dynamics (DRO)
- 3.1. Market Drivers
- 3.1.1. Pharmaceutical API Synthesis Driving Premium-Grade Demand
- 3.1.2. Agrochemical Synthesis Intermediate Demand and Crop Protection Expansion
- 3.2. Market Restraints
- 3.3. Market Opportunities
- 3.5. Pestle Analysis
- 3.6. Porter Forces Analysis
- 3.7. Technology Roadmap
- 3.8. Value Chain Analysis
- 3.9. Government Policy Impact Analysis
- 3.10. Pricing Analysis
- 3.1. Market Drivers
- Chapter 4. Para Bromo Benzoic Acid Market – By Grade
- 4.1. Grade Market Overview, By Grade Segment
- 4.1.1. Para Bromo Benzoic Acid Market Revenue Share, By Grade, 2025 & 2035
- 4.1.2. Pharmaceutical Grade (≥99.0% Purity, GMP-Compliant, DMF-Supported)
- 4.1.3. Para Bromo Benzoic Acid Share Forecast, By Region (USD Million)
- 4.1.4. Comparative Revenue Analysis, By Country, 2025 & 2035
- 4.1.5. Key Market Trends, Growth Factors, & Opportunities
- 4.1.6. Technical Grade (95–99% Purity, Industrial Applications)
- 4.1.7. Para Bromo Benzoic Acid Share Forecast, By Region (USD Million)
- 4.1.8. Comparative Revenue Analysis, By Country, 2025 & 2035
- 4.1.9. Key Market Trends, Growth Factors, & Opportunities
- 4.1.10. Electronic Grade (≥99.9% Purity, Ultra-Low Metal Content)
- 4.1.11. Para Bromo Benzoic Acid Share Forecast, By Region (USD Million)
- 4.1.12. Comparative Revenue Analysis, By Country, 2025 & 2035
- 4.1.13. Key Market Trends, Growth Factors, & Opportunities
- 4.1.14. Other Grades (Research Grade, Custom Synthesis)
- 4.1.15. Para Bromo Benzoic Acid Share Forecast, By Region (USD Million)
- 4.1.16. Comparative Revenue Analysis, By Country, 2025 & 2035
- 4.1.17. Key Market Trends, Growth Factors, & Opportunities
- 4.1. Grade Market Overview, By Grade Segment
- Chapter 5. Para Bromo Benzoic Acid Market – By Application
- 5.1. Application Market Overview, By Application Segment
- 5.1.1. Para Bromo Benzoic Acid Market Revenue Share, By Application, 2025 & 2035
- 5.1.2. Pharmaceuticals & Active Pharmaceutical Ingredients (API Synthesis, Drug Discovery, Medicinal Chemistry)
- 5.1.3. Para Bromo Benzoic Acid Share Forecast, By Region (USD Million)
- 5.1.4. Comparative Revenue Analysis, By Country, 2025 & 2035
- 5.1.5. Key Market Trends, Growth Factors, & Opportunities
- 5.1.6. Agrochemicals (Herbicide Intermediates, Fungicide Synthesis, Nematocide Intermediates)
- 5.1.7. Para Bromo Benzoic Acid Share Forecast, By Region (USD Million)
- 5.1.8. Comparative Revenue Analysis, By Country, 2025 & 2035
- 5.1.9. Key Market Trends, Growth Factors, & Opportunities
- 5.1.10. Dyes & Pigments (Azo Dye Intermediates, Coupling Components)
- 5.1.11. Para Bromo Benzoic Acid Share Forecast, By Region (USD Million)
- 5.1.12. Comparative Revenue Analysis, By Country, 2025 & 2035
- 5.1.13. Key Market Trends, Growth Factors, & Opportunities
- 5.1.14. Organic Synthesis & Chemical Intermediates (Cross-Coupling Reactions, Esterification, Amide Synthesis)
- 5.1.15. Para Bromo Benzoic Acid Share Forecast, By Region (USD Million)
- 5.1.16. Comparative Revenue Analysis, By Country, 2025 & 2035
- 5.1.17. Key Market Trends, Growth Factors, & Opportunities
- 5.1.18. Electronic Materials (OLED Intermediates, Organic Semiconductors)
- 5.1.19. Para Bromo Benzoic Acid Share Forecast, By Region (USD Million)
- 5.1.20. Comparative Revenue Analysis, By Country, 2025 & 2035
- 5.1.21. Key Market Trends, Growth Factors, & Opportunities
- 5.1.22. Other Applications (Laboratory Reagent, Academic Research)
- 5.1.23. Para Bromo Benzoic Acid Share Forecast, By Region (USD Million)
- 5.1.24. Comparative Revenue Analysis, By Country, 2025 & 2035
- 5.1.25. Key Market Trends, Growth Factors, & Opportunities
- 5.1. Application Market Overview, By Application Segment
- Chapter 6. Para Bromo Benzoic Acid Market – By End-Use Industry
- 6.1. End-Use Industry Market Overview, By End-Use Industry Segment
- 6.1.1. Para Bromo Benzoic Acid Market Revenue Share, By End-Use Industry, 2025 & 2035
- 6.1.2. Pharmaceutical & Biotechnology
- 6.1.3. Para Bromo Benzoic Acid Share Forecast, By Region (USD Million)
- 6.1.4. Comparative Revenue Analysis, By Country, 2025 & 2035
- 6.1.5. Key Market Trends, Growth Factors, & Opportunities
- 6.1.6. Agriculture (Crop Protection)
- 6.1.7. Para Bromo Benzoic Acid Share Forecast, By Region (USD Million)
- 6.1.8. Comparative Revenue Analysis, By Country, 2025 & 2035
- 6.1.9. Key Market Trends, Growth Factors, & Opportunities
- 6.1.10. Specialty Chemicals (Dyes, Electronic Materials, Performance Chemicals)
- 6.1.11. Para Bromo Benzoic Acid Share Forecast, By Region (USD Million)
- 6.1.12. Comparative Revenue Analysis, By Country, 2025 & 2035
- 6.1.13. Key Market Trends, Growth Factors, & Opportunities
- 6.1.14. Academic & Research Institutions
- 6.1.15. Para Bromo Benzoic Acid Share Forecast, By Region (USD Million)
- 6.1.16. Comparative Revenue Analysis, By Country, 2025 & 2035
- 6.1.17. Key Market Trends, Growth Factors, & Opportunities
- 6.1.18. Other Industries (Cosmetics, Food Additive Research, Polymer Chemistry)
- 6.1.19. Para Bromo Benzoic Acid Share Forecast, By Region (USD Million)
- 6.1.20. Comparative Revenue Analysis, By Country, 2025 & 2035
- 6.1.21. Key Market Trends, Growth Factors, & Opportunities
- 6.1. End-Use Industry Market Overview, By End-Use Industry Segment
- Chapter 7. Para Bromo Benzoic Acid Market – Regional Analysis
- 7.1. Para Bromo Benzoic Acid Market Overview, By Region Segment
- 7.1.1. Global Para Bromo Benzoic Acid Market Revenue Share, By Region, 2025 & 2035
- 7.1.2. Global Para Bromo Benzoic Acid Market Revenue, By Region, 2026 – 2035 (USD Million)
- 7.1.3. Global Para Bromo Benzoic Acid Market Revenue, By Grade, 2026 – 2035
- 7.1.4. Global Para Bromo Benzoic Acid Market Revenue, By Application, 2026 – 2035
- 7.1.5. Global Para Bromo Benzoic Acid Market Revenue, By End-Use Industry, 2026 – 2035
- 7.2. North America
- 7.2.1. North America Para Bromo Benzoic Acid Market Revenue, By Country, 2026 – 2035 (USD Million)
- 7.2.2. North America Para Bromo Benzoic Acid Market Revenue, By Grade, 2026 – 2035
- 7.2.3. North America Para Bromo Benzoic Acid Market Revenue, By Application, 2026 – 2035
- 7.2.4. North America Para Bromo Benzoic Acid Market Revenue, By End-Use Industry, 2026 – 2035
- 7.2.5. U.S. Para Bromo Benzoic Acid Market Revenue, 2026 – 2035 (USD Million)
- 7.2.6. Canada Para Bromo Benzoic Acid Market Revenue, 2026 – 2035 (USD Million)
- 7.2.7. Mexico Para Bromo Benzoic Acid Market Revenue, 2026 – 2035 (USD Million)
- 7.2.8. Rest of North America Para Bromo Benzoic Acid Market Revenue, 2026 – 2035 (USD Million)
- 7.3. Europe
- 7.3.1. Europe Para Bromo Benzoic Acid Market Revenue, By Country, 2026 – 2035 (USD Million)
- 7.3.2. Europe Para Bromo Benzoic Acid Market Revenue, By Grade, 2026 – 2035
- 7.3.3. Europe Para Bromo Benzoic Acid Market Revenue, By Application, 2026 – 2035
- 7.3.4. Europe Para Bromo Benzoic Acid Market Revenue, By End-Use Industry, 2026 – 2035
- 7.3.5. Germany Para Bromo Benzoic Acid Market Revenue, 2026 – 2035 (USD Million)
- 7.3.6. France Para Bromo Benzoic Acid Market Revenue, 2026 – 2035 (USD Million)
- 7.3.7. U.K. Para Bromo Benzoic Acid Market Revenue, 2026 – 2035 (USD Million)
- 7.3.8. Russia Para Bromo Benzoic Acid Market Revenue, 2026 – 2035 (USD Million)
- 7.3.9. Italy Para Bromo Benzoic Acid Market Revenue, 2026 – 2035 (USD Million)
- 7.3.10. Spain Para Bromo Benzoic Acid Market Revenue, 2026 – 2035 (USD Million)
- 7.3.11. Netherlands Para Bromo Benzoic Acid Market Revenue, 2026 – 2035 (USD Million)
- 7.3.12. Rest of Europe Para Bromo Benzoic Acid Market Revenue, 2026 – 2035 (USD Million)
- 7.4. Asia Pacific
- 7.4.1. Asia Pacific Para Bromo Benzoic Acid Market Revenue, By Country, 2026 – 2035 (USD Million)
- 7.4.2. Asia Pacific Para Bromo Benzoic Acid Market Revenue, By Grade, 2026 – 2035
- 7.4.3. Asia Pacific Para Bromo Benzoic Acid Market Revenue, By Application, 2026 – 2035
- 7.4.4. Asia Pacific Para Bromo Benzoic Acid Market Revenue, By End-Use Industry, 2026 – 2035
- 7.4.5. China Para Bromo Benzoic Acid Market Revenue, 2026 – 2035 (USD Million)
- 7.4.6. Japan Para Bromo Benzoic Acid Market Revenue, 2026 – 2035 (USD Million)
- 7.4.7. India Para Bromo Benzoic Acid Market Revenue, 2026 – 2035 (USD Million)
- 7.4.8. New Zealand Para Bromo Benzoic Acid Market Revenue, 2026 – 2035 (USD Million)
- 7.4.9. Australia Para Bromo Benzoic Acid Market Revenue, 2026 – 2035 (USD Million)
- 7.4.10. South Korea Para Bromo Benzoic Acid Market Revenue, 2026 – 2035 (USD Million)
- 7.4.11. Taiwan Para Bromo Benzoic Acid Market Revenue, 2026 – 2035 (USD Million)
- 7.4.12. Rest of Asia Pacific Para Bromo Benzoic Acid Market Revenue, 2026 – 2035 (USD Million)
- 7.5. The Middle-East and Africa
- 7.5.1. The Middle-East and Africa Para Bromo Benzoic Acid Market Revenue, By Country, 2026 – 2035 (USD Million)
- 7.5.2. The Middle-East and Africa Para Bromo Benzoic Acid Market Revenue, By Grade, 2026 – 2035
- 7.5.3. The Middle-East and Africa Para Bromo Benzoic Acid Market Revenue, By Application, 2026 – 2035
- 7.5.4. The Middle-East and Africa Para Bromo Benzoic Acid Market Revenue, By End-Use Industry, 2026 – 2035
- 7.5.5. Saudi Arabia Para Bromo Benzoic Acid Market Revenue, 2026 – 2035 (USD Million)
- 7.5.6. UAE Para Bromo Benzoic Acid Market Revenue, 2026 – 2035 (USD Million)
- 7.5.7. Egypt Para Bromo Benzoic Acid Market Revenue, 2026 – 2035 (USD Million)
- 7.5.8. Kuwait Para Bromo Benzoic Acid Market Revenue, 2026 – 2035 (USD Million)
- 7.5.9. South Africa Para Bromo Benzoic Acid Market Revenue, 2026 – 2035 (USD Million)
- 7.5.10. Rest of the Middle East & Africa Para Bromo Benzoic Acid Market Revenue, 2026 – 2035 (USD Million)
- 7.6. Latin America
- 7.6.1. Latin America Para Bromo Benzoic Acid Market Revenue, By Country, 2026 – 2035 (USD Million)
- 7.6.2. Latin America Para Bromo Benzoic Acid Market Revenue, By Grade, 2026 – 2035
- 7.6.3. Latin America Para Bromo Benzoic Acid Market Revenue, By Application, 2026 – 2035
- 7.6.4. Latin America Para Bromo Benzoic Acid Market Revenue, By End-Use Industry, 2026 – 2035
- 7.6.5. Brazil Para Bromo Benzoic Acid Market Revenue, 2026 – 2035 (USD Million)
- 7.6.6. Argentina Para Bromo Benzoic Acid Market Revenue, 2026 – 2035 (USD Million)
- 7.6.7. Rest of Latin America Para Bromo Benzoic Acid Market Revenue, 2026 – 2035 (USD Million)
- 7.1. Para Bromo Benzoic Acid Market Overview, By Region Segment
- Chapter 8. Competitive Landscape
- 8.1. Company Market Share Analysis – 2025
- 8.1.1. Global Para Bromo Benzoic Acid Market: Company Market Share, 2025
- 8.2. Global Para Bromo Benzoic Acid Market Company Market Share, 2024
- 8.1. Company Market Share Analysis – 2025
- Chapter 9. Company Profiles
- 9.1. Sigma-Aldrich (Merck KGaA)
- 9.1.1. Company Overview
- 9.1.2. Key Executives
- 9.1.3. Product Portfolio
- 9.1.4. Financial Overview
- 9.1.5. Operating Business Segments
- 9.1.6. Business Performance
- 9.1.7. Recent Developments
- 9.2. TCI Chemicals
- 9.3. Alfa Aesar (Thermo Fisher Scientific)
- 9.4. Tokyo Chemical Industry Co. Ltd.
- 9.5. Biosynth Carbosynth
- 9.6. Acros Organics (Thermo Fisher Scientific)
- 9.7. Santa Cruz Biotechnology Inc.
- 9.8. Oakwood Chemical
- 9.9. Combi-Blocks Inc.
- 9.10. Haihang Industry Co. Ltd.
- 9.11. Nanjing Chemlin Chemical Industry Co. Ltd.
- 9.12. Others.
- 9.1. Sigma-Aldrich (Merck KGaA)
- Chapter 10. Research Methodology
- 10.1. Research Methodology
- 10.2. Secondary Research
- 10.3. Primary Research
- 10.3.1. Analyst Tools and Models
- 10.4. Research Limitations
- 10.5. Assumptions
- 10.6. Insights From Primary Respondents
- 10.7. Why Healthcare Foresights
- Chapter 11. Standard Report Commercials & Add-Ons
- 11.1. Customization Options
- 11.2. Subscription Module For Market Research Reports
- 11.3. Client Testimonials
- Chapter 12. List Of Figures
- 12.1. Figures No 1 to 31
- Chapter 13. List Of Tables
- 13.1. Tables No 1 to 46
Prominent Player
- Sigma-Aldrich (Merck KGaA)
- TCI Chemicals
- Alfa Aesar (Thermo Fisher Scientific)
- Tokyo Chemical Industry Co. Ltd.
- Biosynth Carbosynth
- Acros Organics (Thermo Fisher Scientific)
- Santa Cruz Biotechnology Inc.
- Oakwood Chemical
- Combi-Blocks Inc.
- Haihang Industry Co. Ltd.
- Nanjing Chemlin Chemical Industry Co. Ltd.
- Others
FAQs
The key players in the market are Sigma-Aldrich (Merck KGaA), TCI Chemicals, Alfa Aesar (Thermo Fisher Scientific), Tokyo Chemical Industry Co. Ltd., Biosynth Carbosynth, Acros Organics (Thermo Fisher Scientific), Santa Cruz Biotechnology Inc., Oakwood Chemical, Combi-Blocks Inc., Haihang Industry Co. Ltd., Nanjing Chemlin Chemical Industry Co. Ltd., Others.
Government rules affect the para bromo benzoic acid market in many ways. For example, pharmaceutical regulatory frameworks control the quality of intermediate quality documentation, chemical substance regulations control the production and trade of brominated organic chemicals, and environmental regulations control the design of manufacturing processes and waste management. The FDA’s rules for making pharmaceutical drugs include ICH Q3A impurity qualification thresholds, ICH Q7 Good Manufacturing Practice for Active Pharmaceutical Ingredients, and Drug Master File submission infrastructure. These rules set the quality documentation standards that suppliers of pharmaceutical-grade para bromo benzoic acid must meet. Before they can supply FDA-regulated pharmaceutical manufacturing programs, suppliers’ facilities must be inspected and approved by the FDA. The EU’s REACH Regulation requires that chemical substances made or brought into the EU in amounts greater than one tonne per year be registered, evaluated, and authorized. This means that para bromo benzoic acid manufacturers and importers who want to sell their products in Europe must register the substance and provide documentation of its toxicological, ecotoxicological, and physical-chemical properties. This is a big investment in compliance, but it gives them access to the European market. China’s environmental rules are getting stricter. The Ministry of Ecology and Environment is gradually putting in place tougher standards for managing chemical manufacturing wastewater, air emissions, and solid waste. This has led to consolidation in the Chinese fine chemical manufacturing industry. At the same time, these stricter standards are making it easier for Chinese para bromo benzoic acid manufacturers to follow the rules while concentrating market share among larger, more capital-intensive producers who can handle the new environmental control systems. The Globally Harmonized System of Classification and Labelling of Chemicals (GHS) sets the safety communication standards for the irritant and environmental hazard classifications of para bromo benzoic acid. These standards are enforced in all major manufacturing and importing markets through national GHS implementing regulations. All supply chain transactions must follow these standards.
The price of para bromo benzoic acid changes a lot depending on the grade, purity level, amount, and where it is sold. Technical-grade material, which is 95–99% pure and comes with a standard certificate of analysis, is available from bulk Asian manufacturers for USD 8–USD 20 per kilogram. This is the price range for industrial synthesis applications in agrochemicals, dye intermediates, and general organic chemistry where cost is the main factor in choosing a supplier. Pharmaceutical-grade material—meeting ≥99.0% purity with full GMP documentation, impurity profiling, and DMF-support capability—commands pricing of USD 25–USD 80 per kilogram depending on supplier, volume, and documentation scope, with the pricing premium over technical grade reflecting the analytical testing, quality management system maintenance, regulatory documentation preparation, and supply chain traceability infrastructure costs that pharmaceutical-grade manufacturing requires. Electronic and ultra-high purity grades, which have transition metal specifications below 1–2 ppm by ICP-MS and purity levels of at least 99.9%, cost between USD 100 and USD 300 per kilogram in commercial quantities. This is because ultra-pure material supply requires more purification steps, more rigorous analytical characterization, and special packaging. Research catalog quantities—1–100 gram bottles from major chemical reagent distributors—cost USD 0.50–USD 5.00 per gram. This is because the cost of bulk materials is marked up for distribution. Research-grade catalog pricing is for academic institutions, pharmaceutical research labs, and small-scale synthesis applications where product availability and analytical characterization quality are more important than unit cost. Price sensitivity varies greatly depending on how the product will be used. For example, pharmaceutical API manufacturers see para bromo benzoic acid as a key quality intermediate, and they are willing to pay more for it because of the need for supply security and quality documentation in multimillion-dollar API manufacturing programs. On the other hand, technical grade industrial users put a lot of pressure on costs because non-pharmaceutical halogenated benzoic acid applications have a competitive supply dynamic that makes it look like a commodity.
Based on current analysis, the market is projected to reach approximately USD 148.4 million by 2035, driven by the pharmaceutical API synthesis application sustaining its largest-segment market position as generic pharmaceutical manufacturing expansion in India and China continues generating proportional demand for pharmaceutical-grade intermediates, the agrochemical new active ingredient pipeline maintaining sustained demand as herbicide resistance management requires continuous novel chemistry development consuming para bromo benzoic acid intermediates, OLED material synthesis creating a premium electronic-grade product tier whose demand grows proportionally with the OLED display market’s extraordinary adoption trajectory, the drug discovery and research chemical market generating consistent demand growth as global pharmaceutical R&D investment sustains building block consumption across thousands of active research programs, and Asian fine chemical manufacturer capacity expansion and quality upgrading progressively enabling more competitive participation in global pharmaceutical-grade supply markets while simultaneously growing the Asian domestic consumption base, at a CAGR of 5.2% from 2026 to 2035.
Asia Pacific is expected to keep the biggest share of the market throughout the forecast period. In 2025, it will have about 48% of the global market share. This is because the region is both the world’s biggest manufacturing base for para bromo benzoic acid (with Chinese manufacturers providing a large part of the global supply at competitive prices thanks to integrated bromine raw material access and established fine chemical manufacturing infrastructure) and the fastest-growing demand market (with Indian pharmaceutical and agrochemical manufacturing expansion, Chinese domestic pharmaceutical consumption, and Japanese and Korean electronic material synthesis demand all contributing to Asia Pacific’s market leadership across both supply and demand dimensions at the same time).
The Asia Pacific region is expected to grow the fastest during the forecast period, with a CAGR of 5.9%. This is because India’s para bromo benzoic acid market is growing at a CAGR of 6.8% as pharmaceutical API export manufacturing expands and the agrochemical industry grows, which keeps demand for intermediates high. China’s domestic pharmaceutical and agrochemical manufacturing continues to consume para bromo benzoic acid as the Chinese chemical industry consolidates to meet environmental regulations, focusing production among larger compliant manufacturers who are expanding their pharmaceutical-grade capabilities. Japan’s OLED material manufacturing creates demand for electronic-grade materials, and South Korea’s OLED display industry creates demand for ultra-high purity materials. Overall, the region’s pharmaceutical and agrochemical manufacturing is growing, which is increasing consumption of fine chemical intermediates like para bromo benzoic acid.
The Global Para Bromo Benzoic Acid Market is predicted to experience substantial growth due to the pharmaceutical industry’s extensive use of para bromo benzoic acid in Suzuki coupling, Buchwald-Hartwig amination, and esterification reactions creating sustained demand across API synthesis programs, the global generic pharmaceutical manufacturing expansion in India and China driving demand for cost-competitive pharmaceutical-grade intermediates under GMP-compliant supply chains, the agrochemical industry’s continuous new active ingredient development pipeline responding to herbicide resistance in over 500 documented weed biotypes requiring novel herbicide synthesis intermediates, the OLED display market’s extraordinary growth in smartphones, tablets, and automotive displays creating demand for ultra-high purity electronic material synthesis intermediates, continuous flow chemistry adoption improving para isomer selectivity and manufacturing economics enabling cost-effective pharmaceutical-grade production, the drug discovery market’s sustained demand for brominated aromatic building blocks in combinatorial chemistry library synthesis and medicinal chemistry analog preparation, and REACH regulatory compliance requirements for EU market access motivating comprehensive quality documentation investment that creates competitive differentiation for compliant pharmaceutical-grade manufacturers.